


The global Aircraft Seating market is expected to grow at a significant rate in the forecast period. Consumers seeking alternative modes of transportation are increasingly opting for air travel, which has increased the demand for aircraft seats. Passengers on aeroplanes demand the highest level of comfort, especially when traveling long distances and spending more than 24 hours seated in a plane. Manufacturers in the worldwide aircraft seating industry are responding to these demands by improving product comfort levels. Furthermore, strict passenger safety rules have pushed the safety provisions on aircraft seats forward. Aircraft seats will be primarily responsible in the near future for keeping passengers safe in the event of air turbulence and faulty landings and take-offs. Each of these factors is anticipated to have a definite impact on the global Aircraft Seating market during the forecast period.
Furthermore, the gaining of raw fabrics and technical textiles will be simplified, which will reduce the complexity of manufacturing aircraft seats. The increased usage of hybrid composite materials in aircraft seat manufacturing is likely to put manufacturers at rest. Meanwhile, increased participation in the global air transport landscape, lower air travel rates, and efficient aircraft designs permitting maximum seating capacity are likely to drive up demand for aircraftseats. All these factors majorly contribute towards the growth of the global Aircraft Seating market in the forthcoming period.
| Report Metric | Details |
| Market size available for years | 2023–2030 |
| Base year considered | 2023 |
| Forecast period | 2024–2030 |
| Forecast unit | Value (USD Million) |
| Segments covered | Aircraft Type, Seating Class Type, Fit Type, and Region |
| Regions covered | North America (the U.S. and Canada), Europe (UK, Germany, France, Italy, Spain, Russia, Rest of Europe), Asia-Pacific (China, India, Japan, Australia, South East Asia, Rest of Asia Pacific), Latin America and the Middle East and Africa (Brazil, Saudi Arabia, UAE, Rest of LAMEA) |
| Companies covered | Zodiac Aerospace Group, RECARO Aircraft Seating GmbH & Co. KG, B/E Aerospace, Inc., JAMCO Corporation, Aviointeriors S.p.A, Acro Aircraft Seating, Geven S.p.A, Mirus Aircraft Seating Ltd, Thompson Aero Seating Ltd, ZANKER PROMOTION GMBH. |
Covid-19 Impact on Aircraft Seating Market
As the COVID-19 pandemic continuing its effect around the world, many defense and aerospace companies are facing its impact during this time around the world. For instance, commercial aviation companies in the U.S., France, Germany, and Canada are facing disruption in the production process and reduced demand as workforces staying at home, passengers stop traveling, and delay in delivery of new aircraft. Analysts expecting a drop from 3,000 to 4,000 aircraft during the pandemic period. On the defense side, contractors operating in the sector are in a better position, hence the impact of the pandemic is likely low in the short to mid-term. However, low demand due to budget constraints affecting the production as in aircraft manufacturing.
Aircraft Seating Market Segment Overview
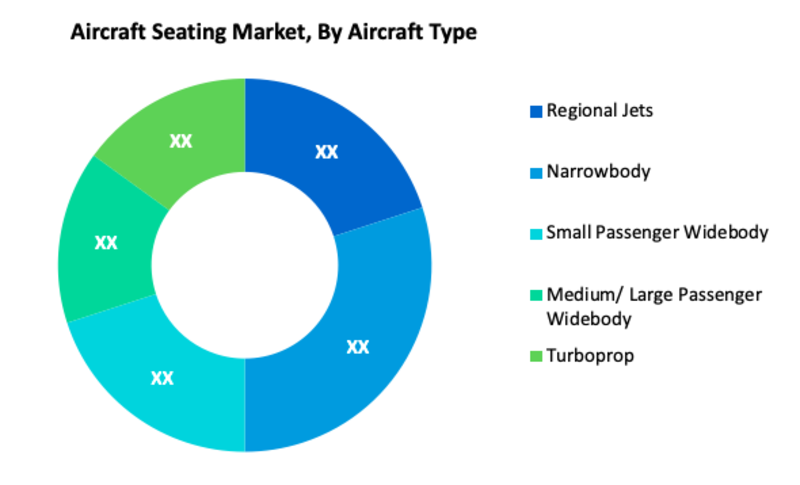
Based on Aircraft Type, the Narrow-Body segment is estimated to hold the maximum share of the global Aircraft Seating market in the coming years. This is primarily due to the increase in the number of narrow-body aircraft delivery. Furthermore, Regional Jets is one of the major segments which is expected to rise at a considerable rate in the forthcoming years. A regional jet is a small aircraft that is used by airlines operating regional flights. Regional jets usually have less than 150 seats and are typically produced by aircraft manufacturers that specialize in making smaller aircraft. Because of their purpose to regional flights, which are in less demand than other flights, regional jets are only ever used for short-haul flights, often within a country or a certain area of a continent.
Aircraft Seating Market, By Aircraft Type
· Regional Jets
· Narrowbody
· Small Passenger Widebody
· Medium/ Large Passenger Widebody
· Turboprop
Aircraft Seating Market, By Seating Class Type
· Economy Class
· Business Class
· First Class
Aircraft Seating Market, By Fit Type
· Retro Fit
· Line Fit
Aircraft Seating Regional Overview
Geographically, North America is expected to dominate the global Aircraft Seating market during the forecast period. This is mainly due to the large demand for air transportation, international air traffic, increasing flight frequency. Likewise, the market in the Asia Pacific is projected to rise at the highest rate during the forecast period. The growth of this region is primarily attributed to the countries in this region upgrading their capabilities by undertaking developments in the field of aircraft seating, consequently offering a substantial opportunity for OEM manufacturers to expand their businesses. These aspects are contributed to the market development in this region.
Aircraft Seating Market, By Geography
· North America (US & Canada)
· Europe (UK, Germany, France, Italy, Spain, Russia & Rest of Europe)
· Asia-Pacific (Japan, China, India, Australia, & South Korea, & Rest of Asia-Pacific)
· LAMEA (Brazil, Saudi Arabia, UAE & Rest of LAMEA)
Aircraft Seating Market Competitor overview
Some key developments and strategies adopted by manufacturers in Aircraft Seating are highlighted below.
· In 2023, Safran Seats began quietly developing a premium, international-style business class seat for long-haul, single-aisle twinjets. As an aircraft seating manufacturer covering all classes of service — from economy to first class — Safran Seats’ decision to bring a tailored product to this part of the market was a no-brainer, and gave it the opportunity to enable a cohesive flight experience with widebodies in the world fleet, where its premium seats historically enjoyed strong take-up from airlines.
Aircraft Seating Market, Key Players
· Zodiac Aerospace Group
· RECARO Aircraft Seating GmbH & Co. KG
· B/E Aerospace, Inc.
· JAMCO Corporation
· Aviointeriors S.p.A
· Acro Aircraft Seating
· Geven S.p.A
· Mirus Aircraft Seating Ltd
· Thompson Aero Seating Ltd
· ZANKER PROMOTION GMBH
Frequently Asked Questions (FAQ) :
Q1. What is the total CAGR expected to be recorded for the Aircraft Seating market during the forecast period?
Q2. Which Segments are covered in the Aircraft Seating market report?
Q3. Which segment is projected to hold the largest share in the Aircraft Seating Market?
Q4. Which region holds the largest share in the Aircraft Seating market?
Q5. Which are the prominent players in the Aircraft Seating Market?
1. Introduction
- 1.1. Research Scope
- 1.2. Market Segmentation
- 1.3. Research Methodology
- 1.4. Definitions and Assumptions
2. Executive Summary
3. Market Dynamics
- 3.1. Market Drivers
- 3.2. Market Restraints
- 3.3. Market Opportunities
4. Key Insights
- 4.1. Key Emerging Trends – For Major Countries
- 4.2. Latest Technological Advancement
- 4.3. Regulatory Landscape
- 4.4. Industry SWOT Analysis
- 4.5. Porters Five Forces Analysis
5. Global Aircraft Seating Market Analysis (USD Billion), Insights and Forecast, 2020-2027
- 5.1. Key Findings / Summary
- 5.2. Market Analysis, Insights and Forecast – By Aircraft Type
- 5.2.1. Regional Jets
- 5.2.2. Narrowbody
- 5.2.3. Small Passenger Widebody
- 5.2.4. Medium/ Large Passenger Widebody
- 5.2.5. Turboprop
- 5.3. Market Analysis, Insights and Forecast – By Seating Class Type
- 5.3.1. Economy Class
- 5.3.2. Business Class
- 5.3.3. First Class
- 5.4. Market Analysis, Insights and Forecast – By Fit Type
- 5.4.1. Retro Fit
- 5.4.2. Line Fit
- 5.5. Market Analysis, Insights and Forecast – By Region
- 5.5.1. North America
- 5.5.2. Europe
- 5.5.3. Asia Pacific
- 5.5.4. Latin America, Middle East and Africa
6. North America Aircraft Seating Market Analysis (USD Billion), Insights and Forecast, 2020-2027
- 6.1. Key Findings / Summary
- 6.2. Market Analysis, Insights and Forecast – By Aircraft Type
- 6.2.1. Regional Jets
- 6.2.2. Narrowbody
- 6.2.3. Small Passenger Widebody
- 6.2.4. Medium/ Large Passenger Widebody
- 6.2.5. Turboprop
- 6.3. Market Analysis, Insights and Forecast – By Seating Class Type
- 6.3.1. Economy Class
- 6.3.2. Business Class
- 6.3.3. First Class
- 6.4. Market Analysis, Insights and Forecast – By Fit Type
- 6.4.1. Retro Fit
- 6.4.2. Line Fit
- 6.5. Market Analysis, Insights and Forecast – By Country
- 6.5.1. U.S.
- 6.5.2. Canada
7. Europe Aircraft Seating Market Analysis (USD Billion), Insights and Forecast, 2020-2027
- 7.1. Key Findings / Summary
- 7.2. Market Analysis, Insights and Forecast – By Aircraft Type
- 7.2.1. Regional Jets
- 7.2.2. Narrowbody
- 7.2.3. Small Passenger Widebody
- 7.2.4. Medium/ Large Passenger Widebody
- 7.2.5. Turboprop
- 7.3. Market Analysis, Insights and Forecast – By Seating Class Type
- 7.3.1. Economy Class
- 7.3.2. Business Class
- 7.3.3. First Class
- 7.4. Market Analysis, Insights and Forecast – By Fit Type
- 7.4.1. Retro Fit
- 7.4.2. Line Fit
- 7.5. Market Analysis, Insights and Forecast – By Country
- 7.5.1. UK
- 7.5.2. Germany
- 7.5.3. France
- 7.5.4. Italy
- 7.5.5. Spain
- 7.5.6. Russia
- 7.5.7. Rest of Europe
8. Asia Pacific Aircraft Seating Market Analysis (USD Billion), Insights and Forecast, 2020-2027
- 8.1. Key Findings / Summary
- 8.2. Market Analysis, Insights and Forecast – By Aircraft Type
- 8.2.1. Regional Jets
- 8.2.2. Narrowbody
- 8.2.3. Small Passenger Widebody
- 8.2.4. Medium/ Large Passenger Widebody
- 8.2.5. Turboprop
- 8.3. Market Analysis, Insights and Forecast – By Seating Class Type
- 8.3.1. Economy Class
- 8.3.2. Business Class
- 8.3.3. First Class
- 8.4. Market Analysis, Insights and Forecast – By Fit Type
- 8.4.1. Retro Fit
- 8.4.2. Line Fit
- 8.5. Market Analysis, Insights and Forecast – By Country
- 8.5.1. China
- 8.5.2. India
- 8.5.3. Japan
- 8.5.4. Australia
- 8.5.5. South East Asia
- 8.5.6. Rest of Asia Pacific
9. Latin America, Middle East and Africa Aircraft Seating Market Analysis (USD Billion), Insights and Forecast, 2020-2027
- 9.1. Key Findings / Summary
- 9.2. Market Analysis, Insights and Forecast – By Aircraft Type
- 9.2.1. Regional Jets
- 9.2.2. Narrowbody
- 9.2.3. Small Passenger Widebody
- 9.2.4. Medium/ Large Passenger Widebody
- 9.2.5. Turboprop
- 9.3. Market Analysis, Insights and Forecast – By Seating Class Type
- 9.3.1. Economy Class
- 9.3.2. Business Class
- 9.3.3. First Class
- 9.4. Market Analysis, Insights and Forecast – By Fit Type
- 9.4.1. Retro Fit
- 9.4.2. Line Fit
- 9.5. Market Analysis, Insights and Forecast – By Country
- 9.5.1. Brazil
- 9.5.2. Saudi Arabia
- 9.5.3. UAE
- 9.5.4. Rest of LAMEA
10. Competitive Analysis
- 10.1. Company Market Share Analysis, 2018
- 10.2. Key Industry Developments
- 10.3. Company Profile
- 10.4. Zodiac Aerospace Group
- 10.4.1. Business Overview
- 10.4.2. Segment 1 & Service Offering
- 10.4.3. Overall Revenue
- 10.4.4. Geographic Presence
- 10.4.5. Recent Development
- 10.5. RECARO Aircraft Seating GmbH & Co. KG
- 10.6. B/E Aerospace, Inc.
- 10.7. JAMCO Corporation
- 10.8. Aviointeriors S.p.A
- 10.9. Acro Aircraft Seating
- 10.10. Geven S.p.A
- 10.11. Mirus Aircraft Seating Ltd
- 10.12. Thompson Aero Seating Ltd
Data Library Research are conducted by industry experts who offer insight on industry structure, market segmentations technology assessment and competitive landscape (CL), and penetration, as well as on emerging trends. Their analysis is based on primary interviews (~ 80%) and secondary research (~ 20%) as well as years of professional expertise in their respective industries. Adding to this, by analysing historical trends and current market positions, our analysts predict where the market will be headed for the next five years. Furthermore, the varying trends of segment & categories geographically presented are also studied and the estimated based on the primary & secondary research.
In this particular report from the supply side Data Library Research has conducted primary surveys (interviews) with the key level executives (VP, CEO’s, Marketing Director, Business Development Manager and SOFT) of the companies that active & prominent as well as the midsized organization
FIGURE 1: DLR RESEARH PROCESS

Extensive primary research was conducted to gain a deeper insight of the market and industry performance. The analysis is based on both primary and secondary research as well as years of professional expertise in the respective industries.
In addition to analysing current and historical trends, our analysts predict where the market is headed over the next five years.
It varies by segment for these categories geographically presented in the list of market tables. Speaking about this particular report we have conducted primary surveys (interviews) with the key level executives (VP, CEO’s, Marketing Director, Business Development Manager and many more) of the major players active in the market.
Secondary ResearchSecondary research was mainly used to collect and identify information useful for the extensive, technical, market-oriented, and Friend’s study of the Global Extra Neutral Alcohol. It was also used to obtain key information about major players, market classification and segmentation according to the industry trends, geographical markets, and developments related to the market and technology perspectives. For this study, analysts have gathered information from various credible sources, such as annual reports, sec filings, journals, white papers, SOFT presentations, and company web sites.
Market Size EstimationBoth, top-down and bottom-up approaches were used to estimate and validate the size of the Global market and to estimate the size of various other dependent submarkets in the overall Extra Neutral Alcohol. The key players in the market were identified through secondary research and their market contributions in the respective geographies were determined through primary and secondary research.
Forecast Model
