


The bicycle market has shown constant growth over the last decade, thanks to two key factors: a growing desire for a healthy lifestyle and a growing focus on environmental protection. Although bicycles are still primarily used for transportation, they have gained a lot of favour as an environmentally friendly alternative.
Technology advancements, as well as the introduction of a diverse range of bicycles into the existing market environment, are expected to shape the bicycle industry's growth in the following decade. Consumer preferences are shifting toward environmentally-friendly transportation options, such as electric bicycles and vehicles, according to current trends, a factor that is projected to help the global bicycle market's growth in the future years. Bicycle sales have risen dramatically in recent years as manufacturers have focused more on enhancing rider comfort, adding new features, and improving overall performance. As a result of these reasons, as well as rising environmental awareness and increased attention to the development of bicycle infrastructure in upcoming and existing metropolitan areas, the global Bicycle market is expected to rise at a significant rate in the forthcoming years.
On the negative side, the lack of infrastructure essential to inspire and support bicycle commutation, mostly in developing countries (such as India), is anticipated to hinder the growth of the bicycle market.
| Report Metric | Details |
| Market size available for years | 2023–2030 |
| Base year considered | 2023 |
| Forecast period | 2024–2030 |
| Forecast unit | Value (USD Million) |
| Segments covered | Type, Technology, Gear Type, Distribution Channel, and Region. |
| Regions covered | North America (the U.S. and Canada), Europe (UK, Germany, France, Italy, Spain, Russia, Rest of Europe), Asia-Pacific (China, India, Japan, Australia, South East Asia, Rest of Asia Pacific), Latin America and the Middle East and Africa (Brazil, Saudi Arabia, UAE, Rest of LAMEA) |
| Companies covered | BMC Switzerland AG, Boardman Bikes Ltd, Cannondale Bicycle Corporation (Cycling Sports Group, Inc.), Firefox Bikes, Fuji Bike Worldwide, Giant Bicycle, SCOTT Sports SA, Shimano Inc., Specialized Bicycle Components, Inc., Trek Bicycle Corporation. |
Covid-19 Impact on Bicycle Market
Consumers across the globe are adjusting to the new normal and there is a noteworthy discrepancy in consumer behavior. Consumer's purchasing habits, behavior, and attitudes have changed in light of COVID-19. People are shopping very consciously and are majorly centered on basic needs and are buying locally. Consumers are using digital commerce to play, learn, and connect to manage isolation and follow social distancing policy. The covid-19 has consistently impacted the shopping behavior of 9 in 10 consumers. Nearly 30-50 percent of the consumers have shifted towards online shopping from March 2020 to December 2020.
Bicycle Market Segment Overview
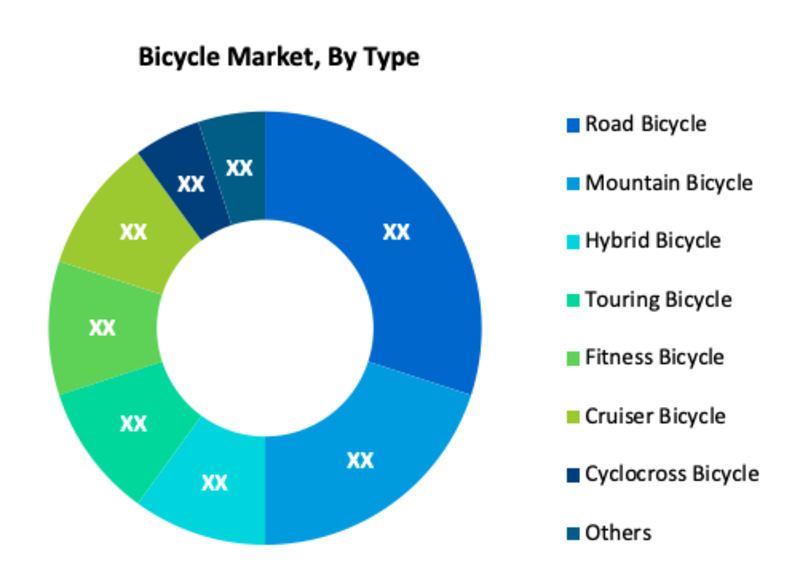
According to Type, Road Bicycle holds the largest share of the global Bicycle market. The fact that these are the most basic vehicles, which do not require any sophisticated accessories, such as those required by racing, mountain, or other special-purpose bicycles, can be attributed to their growth. In the next years, the growing desire among people to modify road bicycles for specific purposes is expected to contribute to the segment's growth. Furthermore, the mountain bicycle segment is predicted to increase significantly throughout the projection period as customers, particularly millennials, continue to choose mountain biking as a leisure and adventure activity. Furthermore, the number of women and children participating in sports is gradually increasing, which is projected to have a positive impact on the growth market.
Bicycle Market, By Type
· Road Bicycle
· Mountain Bicycle
· Hybrid Bicycle
· Touring Bicycle
· Fitness Bicycle
· Cruiser Bicycle
· Cyclocross Bicycle
· Others
Bicycle Market, By Technology
· Conventional
· Electric
Bicycle Market, By Gear Type
· Without Gear
· With Gear
Bicycle Market, By Distribution Channel
· Online
· Offline
Bicycle Market Regional Overview
Geographically, North America is one of the most prominent regions for the global Bicycle market. A factor predicted to drive the market for bicycles in the region is the growing popularity of bicycle ridesharing services, notably in North America, which provides short-term public bike rentals via smartphone applications. Rideshare programs have gained a lot of traction, especially in cities with a lot of traffic. San Francisco, New York, and Washington, D.C. are among the major cities in the United States where bicycle rideshare services are gaining popularity. Moreover, the market in the Asia Pacific is projected to grow considerably in the coming years. Significant factors such as growing importance for fitness and concern for the environment majorly contribute towards the growth of the market in this region.
Bicycle Market, By Geography
· North America (US & Canada)
· Europe (UK, Germany, France, Italy, Spain, Russia & Rest of Europe)
· Asia-Pacific (Japan, China, India, Australia, & South Korea, & Rest of Asia-Pacific)
· LAMEA (Brazil, Saudi Arabia, UAE & Rest of LAMEA)
Bicycle Market, Key Players
· BMC Switzerland AG
· Boardman Bikes Ltd
· Cannondale Bicycle Corporation (Cycling Sports Group, Inc.)
· Firefox Bikes
· Fuji Bike Worldwide
· Giant Bicycle
· SCOTT Sports SA
· Shimano Inc.
· Specialized Bicycle Components, Inc.
· Trek Bicycle Corporation
Frequently Asked Questions (FAQ) :
Q1. What are the driving factors for the global Bicycle market?
Q2. What are the restraining factors for the global Bicycle market?
Q3. Which segment is projected to hold the largest share in the global Bicycle market?
Q4. Which region is holds largest share in the global Bicycle market?
Q5. Which are the prominent players in the Bicycle market?
1. Introduction
- 1.1. Research Scope
- 1.2. Market Segmentation
- 1.3. Research Methodology
- 1.4. Definitions and Assumptions
2. Executive Summary
3. Market Dynamics
- 3.1. Market Drivers
- 3.2. Market Restraints
- 3.3. Market Opportunities
4. Key Insights
- 4.1. Key Emerging Trends – For Major Countries
- 4.2. Latest Technological Advancement
- 4.3. Regulatory Landscape
- 4.4. Industry SWOT Analysis
- 4.5. Porters Five Forces Analysis
5. Global Bicycle Market Analysis (USD Billion), Insights and Forecast, 2020-2027
- 5.1. Key Findings / Summary
- 5.2. Market Analysis, Insights and Forecast – By Type
- 5.2.1. Road Bicycle
- 5.2.2. Mountain Bicycle
- 5.2.3. Hybrid Bicycle
- 5.2.4. Touring Bicycle
- 5.2.5. Fitness Bicycle
- 5.2.6. Cruiser Bicycle
- 5.2.7. Cyclocross Bicycle
- 5.2.8. Others
- 5.3. Market Analysis, Insights and Forecast – By Technology
- 5.3.1. Conventional
- 5.3.2. Electric
- 5.4. Market Analysis, Insights and Forecast – By Gear Type
- 5.4.1. Without Gear
- 5.4.2. With Gear
- 5.5. Market Analysis, Insights and Forecast – By Distribution Channel
- 5.5.1. Online
- 5.5.2. Offline
- 5.6. Market Analysis, Insights and Forecast – By Region
- 5.6.1. North America
- 5.6.2. Europe
- 5.6.3. Asia Pacific
- 5.6.4. Latin America, Middle East and Africa
6. North America Bicycle Market Analysis (USD Billion), Insights and Forecast, 2020-2027
- 6.1. Key Findings / Summary
- 6.2. Market Analysis, Insights and Forecast – By Type
- 6.2.1. Road Bicycle
- 6.2.2. Mountain Bicycle
- 6.2.3. Hybrid Bicycle
- 6.2.4. Touring Bicycle
- 6.2.5. Fitness Bicycle
- 6.2.6. Cruiser Bicycle
- 6.2.7. Cyclocross Bicycle
- 6.2.8. Others
- 6.3. Market Analysis, Insights and Forecast – By Technology
- 6.3.1. Conventional
- 6.3.2. Electric
- 6.4. Market Analysis, Insights and Forecast – By Gear Type
- 6.4.1. Without Gear
- 6.4.2. With Gear
- 6.5. Market Analysis, Insights and Forecast – By Distribution Channel
- 6.5.1. Online
- 6.5.2. Offline
- 6.6. Market Analysis, Insights and Forecast – By Country
- 6.6.1. U.S.
- 6.6.2. Canada
7. Europe Bicycle Market Analysis (USD Billion), Insights and Forecast, 2020-2027
- 7.1. Key Findings / Summary
- 7.2. Market Analysis, Insights and Forecast – By Type
- 7.2.1. Road Bicycle
- 7.2.2. Mountain Bicycle
- 7.2.3. Hybrid Bicycle
- 7.2.4. Touring Bicycle
- 7.2.5. Fitness Bicycle
- 7.2.6. Cruiser Bicycle
- 7.2.7. Cyclocross Bicycle
- 7.2.8. Others
- 7.3. Market Analysis, Insights and Forecast – By Technology
- 7.3.1. Conventional
- 7.3.2. Electric
- 7.4. Market Analysis, Insights and Forecast – By Gear Type
- 7.4.1. Without Gear
- 7.4.2. With Gear
- 7.5. Market Analysis, Insights and Forecast – By Distribution Channel
- 7.5.1. Online
- 7.5.2. Offline
- 7.6. Market Analysis, Insights and Forecast – By Country
- 7.6.1. UK
- 7.6.2. Germany
- 7.6.3. France
- 7.6.4. Italy
- 7.6.5. Spain
- 7.6.6. Russia
- 7.6.7. Rest of Europe
8. Asia Pacific Bicycle Market Analysis (USD Billion), Insights and Forecast, 2020-2027
- 8.1. Key Findings / Summary
- 8.2. Market Analysis, Insights and Forecast – By Type
- 8.2.1. Road Bicycle
- 8.2.2. Mountain Bicycle
- 8.2.3. Hybrid Bicycle
- 8.2.4. Touring Bicycle
- 8.2.5. Fitness Bicycle
- 8.2.6. Cruiser Bicycle
- 8.2.7. Cyclocross Bicycle
- 8.2.8. Others
- 8.3. Market Analysis, Insights and Forecast – By Technology
- 8.3.1. Conventional
- 8.3.2. Electric
- 8.4. Market Analysis, Insights and Forecast – By Gear Type
- 8.4.1. Without Gear
- 8.4.2. With Gear
- 8.5. Market Analysis, Insights and Forecast – By Distribution Channel
- 8.5.1. Online
- 8.5.2. Offline
- 8.6. Market Analysis, Insights and Forecast – By Country
- 8.6.1. China
- 8.6.2. India
- 8.6.3. Japan
- 8.6.4. Australia
- 8.6.5. South East Asia
- 8.6.6. Rest of Asia Pacific
9. Latin America, Middle East and Africa Bicycle Market Analysis (USD Billion), Insights and Forecast, 2020-2027
- 9.1. Key Findings / Summary
- 9.2. Market Analysis, Insights and Forecast – By Type
- 9.2.1. Road Bicycle
- 9.2.2. Mountain Bicycle
- 9.2.3. Hybrid Bicycle
- 9.2.4. Touring Bicycle
- 9.2.5. Fitness Bicycle
- 9.2.6. Cruiser Bicycle
- 9.2.7. Cyclocross Bicycle
- 9.2.8. Others
- 9.3. Market Analysis, Insights and Forecast – By Technology
- 9.3.1. Conventional
- 9.3.2. Electric
- 9.4. Market Analysis, Insights and Forecast – By Gear Type
- 9.4.1. Without Gear
- 9.4.2. With Gear
- 9.5. Market Analysis, Insights and Forecast – By Distribution Channel
- 9.5.1. Online
- 9.5.2. Offline
- 9.6. Market Analysis, Insights and Forecast – By Country
- 9.6.1. Brazil
- 9.6.2. Saudi Arabia
- 9.6.3. UAE
- 9.6.4. Rest of LAMEA
10. Competitive Analysis
- 10.1. Company Market Share Analysis, 2018
- 10.2. Key Industry Developments
- 10.3. Company Profile
- 10.4. BMC Switzerland AG
- 10.4.1. Business Overview
- 10.4.2. Segment 1 & Service Offering
- 10.4.3. Overall Revenue
- 10.4.4. Geographic Presence
- 10.4.5. Recent Development
- 10.5. Boardman Bikes Ltd
- 10.6. Cannondale Bicycle Corporation (Cycling Sports Group, Inc.)
- 10.7. Firefox Bikes
- 10.8. Fuji Bike Worldwide
- 10.9. Giant Bicycle
- 10.10. SCOTT Sports SA
- 10.11. Shimano Inc.
- 10.12. Specialized Bicycle Components, Inc.
Data Library Research are conducted by industry experts who offer insight on industry structure, market segmentations technology assessment and competitive landscape (CL), and penetration, as well as on emerging trends. Their analysis is based on primary interviews (~ 80%) and secondary research (~ 20%) as well as years of professional expertise in their respective industries. Adding to this, by analysing historical trends and current market positions, our analysts predict where the market will be headed for the next five years. Furthermore, the varying trends of segment & categories geographically presented are also studied and the estimated based on the primary & secondary research.
In this particular report from the supply side Data Library Research has conducted primary surveys (interviews) with the key level executives (VP, CEO’s, Marketing Director, Business Development Manager and SOFT) of the companies that active & prominent as well as the midsized organization
FIGURE 1: DLR RESEARH PROCESS

Extensive primary research was conducted to gain a deeper insight of the market and industry performance. The analysis is based on both primary and secondary research as well as years of professional expertise in the respective industries.
In addition to analysing current and historical trends, our analysts predict where the market is headed over the next five years.
It varies by segment for these categories geographically presented in the list of market tables. Speaking about this particular report we have conducted primary surveys (interviews) with the key level executives (VP, CEO’s, Marketing Director, Business Development Manager and many more) of the major players active in the market.
Secondary ResearchSecondary research was mainly used to collect and identify information useful for the extensive, technical, market-oriented, and Friend’s study of the Global Extra Neutral Alcohol. It was also used to obtain key information about major players, market classification and segmentation according to the industry trends, geographical markets, and developments related to the market and technology perspectives. For this study, analysts have gathered information from various credible sources, such as annual reports, sec filings, journals, white papers, SOFT presentations, and company web sites.
Market Size EstimationBoth, top-down and bottom-up approaches were used to estimate and validate the size of the Global market and to estimate the size of various other dependent submarkets in the overall Extra Neutral Alcohol. The key players in the market were identified through secondary research and their market contributions in the respective geographies were determined through primary and secondary research.
Forecast Model
