Global Circulating Tumor Cell Testing Market Opportunities and Forecast 2023-2030

  •   DLR2155
  •   March, 2022
  •   Pages: 120
  •  Global
Circulating Tumor Cell Testing Market Overview

In recent years, the number of cancer patients in all parts of the world has increased dramatically. This reason is propelling the global circulating tumor cell testing market forward. One of the primary factors driving the growth of the market for circulating tumor cell testing is the significant increase in the number of older people from all over the world. Some of the factors driving the growth of the circulating tumor cell testing market include technological advancements in the field, higher awareness of circulating tumor cell testing, increased healthcare spending, and expanding government backing.

On the other hand, some obstacles are limiting the global circulating tumor cell testing market growth. Strict regulatory frameworks, cost reduction measures, and the requirement of lengthy product launch clearances are among the market restraints.

Report Metric Details
Market size available for years 2023–2030
Base year considered 2023
Forecast period 2024–2030
Forecast unit Value (USD Million)
Segments covered Technology, End Users, and Region.
Regions covered North America (the U.S. and Canada), Europe (UK, Germany, France, Italy, Spain, Russia, Rest of Europe), Asia-Pacific (China, India, Japan, Australia, South East Asia, Rest of Asia Pacific), Latin America and the Middle East and Africa (Brazil, Saudi Arabia, UAE, Rest of LAMEA)
Companies covered Clearbridge BioMedics, Fluxion Biosciences, Apocell, Adnagen, Cynvenio Biosystems, Advanced Cell Diagnostics, Biocept Inc., Aviva Biosciences.


Covid-19 Impact on Circulating Tumor Cell Testing Market
 
In addition, the current Circulating Tumor Cell Testing Market study offers a detailed analysis of the current COVID-19 pandemic impact on the market growth and its influence on the future growth of the Circulating Tumor Cell Testing Market. The recently published report demonstrates the elevation in the demand for the healthcare sector. The healthcare manufacturers have experienced long-term as well as short-term effect which includes supply shortages, panic buying, and stocking, regulation changes as short-term whereas approval delays and possible trend variations in consumption could be perceived as long-term impacts of COVID-19 on the health and pharmaceutical market.

The increasing need for a cure has pushed vaccine research and manufacturers to the limit. In addition to this, panic conditions have already spurred the demand for many healthcare products and services which are discussed in detail in this report. Moreover, the impact of COVID-19 on overall market revenue for the base year 2020 and its projection up to 2027 is provided in detail in this report.
 
Circulating Tumor Cell Testing Market Segment Overview


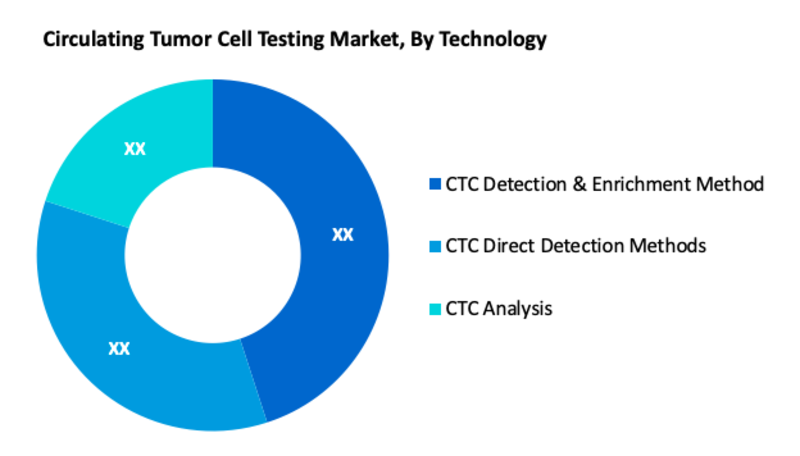
According to Technology, CTC Detection & Enrichment Method is one of the largest segments of the global Circulating Tumor Cell Testing Market. Over the projection period, the availability of various technologies for enriching circulating tumor cells in cancer detection is projected to have a major impact on segment growth. Furthermore, the market expansion is expected to be propelled by positive or negative enrichment of circulating tumor cells based on biological features.
 
Circulating Tumor Cell Testing Market, By Technology
·       CTC Detection & Enrichment Method
·       CTC Direct Detection Methods
·       CTC Analysis

Circulating Tumor Cell Testing Market, By End Users
·       Hospital & Clinics
·       Research & Academic Institutes
·       Diagnostic Centres

Circulating Tumor Cell Testing Market Regional Overview

In terms of geography, the global Circulating Tumor Cell Testing market is classified into North America, South America, Europe, Asia Pacific, and Middle East & Africa. North America is one of the most important regions of the market for circulating tumor cell testing. The region is significant in terms of overall market growth due to the presence of a large number of industry participants. Aside from that, the rising number of cancer patients in this region is expected to propel the circulating tumor cell testing market forward in the coming years. Moreover, Asia Pacific is expected to develop at a fast pace due to high unmet diagnostic needs and quickly growing patient awareness of cancer early detection and risk assessment.
 
Circulating Tumor Cell Testing Market, By Geography
 
·       North America (US & Canada)
·       Europe (UK, Germany, France, Italy, Spain, Russia & Rest of Europe)
·       Asia-Pacific (Japan, China, India, Australia, & South Korea, & Rest of Asia-Pacific)
·       LAMEA (Brazil, Saudi Arabia, UAE & Rest of LAMEA)
 
Circulating Tumor Cell Testing Market, Key Players

·       Clearbridge BioMedics
·       Fluxion Biosciences
·       Apocell
·       Adnagen
·       Cynvenio Biosystems
·       Advanced Cell Diagnostics
·       Biocept Inc.
·       Aviva Biosciences

Frequently Asked Questions (FAQ) :

Q1. What are the driving factors for the global Circulating Tumor Cell Testing market?

The number of cancer patients in all parts of the world has increased dramatically. This reason is propelling the global circulating tumor cell testing market forward.

Q2. What are the restraining factors for the global Circulating Tumor Cell Testing market?

Strict regulatory frameworks, cost reduction measures, and the requirement of lengthy product launch clearances are some factors that restrain the growth of the global Circulating Tumor Cell Testing market.

Q3. Which segment is projected to hold the largest share in the global Circulating Tumor Cell Testing market?

CTC Detection & Enrichment Method segment is projected to hold the largest share in the global Circulating Tumor Cell Testing market.

Q4. Which region holds the largest share in the global Circulating Tumor Cell Testing market?

North America held the largest share in the global Circulating Tumor Cell Testing market.

Q5. Which are the prominent players in the global Circulating Tumor Cell Testing market?

Clearbridge BioMedics, Fluxion Biosciences, Apocell, Adnagen, Cynvenio Biosystems, Advanced Cell Diagnostics, Biocept Inc., Aviva Biosciences. are some key players in the global Circulating Tumor Cell Testing market.
Circulating Tumor Cell Testing Market Study Global Market Analysis, Insights and Forecast, 2020-2027

    1. Introduction

    • 1.1. Research Scope
    • 1.2. Market Segmentation
    • 1.3. Research Methodology
    • 1.4. Definitions and Assumptions

    2. Executive Summary

      3. Market Dynamics

      • 3.1. Market Drivers
      • 3.2. Market Restraints
      • 3.3. Market Opportunities

      4. Key Insights

      • 4.1. Key Emerging Trends – For Major Countries
      • 4.2. Latest Technological Advancement
      • 4.3. Regulatory Landscape
      • 4.4. Industry SWOT Analysis
      • 4.5. Porters Five Forces Analysis

      5. Global Circulating Tumor Cell Testing Market Analysis (USD Billion), Insights and Forecast, 2020-2027

      • 5.1. Key Findings / Summary
      • 5.2. Market Analysis, Insights and Forecast – By Technology
        • 5.2.1. CTC Detection & Enrichment Method
        • 5.2.2. CTC Direct Detection Methods
        • 5.2.3. CTC Analysis
      • 5.3. Market Analysis, Insights and Forecast – By End Users
        • 5.3.1. Hospital & Clinics
        • 5.3.2. Research & Academic Institutes
        • 5.3.3. Diagnostic Centres
      • 5.4. Market Analysis, Insights and Forecast – By Region
        • 5.4.1. North America
        • 5.4.2. Europe
        • 5.4.3. Asia Pacific
        • 5.4.4. Latin America, Middle East and Africa

      6. North America Circulating Tumor Cell Testing Market Analysis (USD Billion), Insights and Forecast, 2020-2027

      • 6.1. Key Findings / Summary
      • 6.2. Market Analysis, Insights and Forecast – By Technology
        • 6.2.1. CTC Detection & Enrichment Method
        • 6.2.2. CTC Direct Detection Methods
        • 6.2.3. CTC Analysis
      • 6.3. Market Analysis, Insights and Forecast – By End Users
        • 6.3.1. Hospital & Clinics
        • 6.3.2. Research & Academic Institutes
        • 6.3.3. Diagnostic Centres
      • 6.4. Market Analysis, Insights and Forecast – By Country
        • 6.4.1. U.S.
        • 6.4.2. Canada

      7. Europe Circulating Tumor Cell Testing Market Analysis (USD Billion), Insights and Forecast, 2020-2027

      • 7.1. Key Findings / Summary
      • 7.2. Market Analysis, Insights and Forecast – By Technology
        • 7.2.1. CTC Detection & Enrichment Method
        • 7.2.2. CTC Direct Detection Methods
        • 7.2.3. CTC Analysis
      • 7.3. Market Analysis, Insights and Forecast – By End Users
        • 7.3.1. Hospital & Clinics
        • 7.3.2. Research & Academic Institutes
        • 7.3.3. Diagnostic Centres
      • 7.4. Market Analysis, Insights and Forecast – By Country
        • 7.4.1. UK
        • 7.4.2. Germany
        • 7.4.3. France
        • 7.4.4. Italy
        • 7.4.5. Spain
        • 7.4.6. Russia
        • 7.4.7. Rest of Europe

      8. Asia Pacific Circulating Tumor Cell Testing Market Analysis (USD Billion), Insights and Forecast, 2020-2027

      • 8.1. Key Findings / Summary
      • 8.2. Market Analysis, Insights and Forecast – By Technology
        • 8.2.1. CTC Detection & Enrichment Method
        • 8.2.2. CTC Direct Detection Methods
        • 8.2.3. CTC Analysis
      • 8.3. Market Analysis, Insights and Forecast – By End Users
        • 8.3.1. Hospital & Clinics
        • 8.3.2. Research & Academic Institutes
        • 8.3.3. Diagnostic Centres
      • 8.4. Market Analysis, Insights and Forecast – By Country
        • 8.4.1. China
        • 8.4.2. India
        • 8.4.3. Japan
        • 8.4.4. Australia
        • 8.4.5. South East Asia
        • 8.4.6. Rest of Asia Pacific

      9. Latin America, Middle East and Africa Circulating Tumor Cell Testing Market Analysis (USD Billion), Insights and Forecast, 2020-2027

      • 9.1. Key Findings / Summary
      • 9.2. Market Analysis, Insights and Forecast – By Technology
        • 9.2.1. CTC Detection & Enrichment Method
        • 9.2.2. CTC Direct Detection Methods
        • 9.2.3. CTC Analysis
      • 9.3. Market Analysis, Insights and Forecast – By End Users
        • 9.3.1. Hospital & Clinics
        • 9.3.2. Research & Academic Institutes
        • 9.3.3. Diagnostic Centres
      • 9.4. Market Analysis, Insights and Forecast – By Country
        • 9.4.1. Brazil
        • 9.4.2. Saudi Arabia
        • 9.4.3. UAE
        • 9.4.4. Rest of LAMEA

      10. Competitive Analysis

      • 10.1. Company Market Share Analysis, 2018
      • 10.2. Key Industry Developments
      • 10.3. Company Profile
      • 10.4. Clearbridge BioMedics
        • 10.4.1. Business Overview
        • 10.4.2. Segment 1 & Service Offering
        • 10.4.3. Overall Revenue
        • 10.4.4. Geographic Presence
        • 10.4.5. Recent Development
      *Similar details will be provided for the following companies
      • 10.5. Fluxion Biosciences
      • 10.6. Apocell
      • 10.7. Adnagen
      • 10.8. Cynvenio Biosystems
      • 10.9. Advanced Cell Diagnostics
      • 10.10. Biocept Inc.
      List of Figures

      Figure 1: Global Circulating Tumor Cell Testing Market Revenue Breakdown (USD Billion, %) by Region, 2019 & 2027
      Figure 2: Global Market Value Share (%), By Segment 1, 2019 & 2027
      Figure 3: Global Market Forecast (USD Billion), by Sub-Segment 1, 2016-2027
      Figure 4: Global Market Forecast (USD Billion), by Sub-Segment 2, 2016-2027
      Figure 5: Global Market Value Share (%), By Segment 2, 2019 & 2027
      Figure 6: Global Market Forecast (USD Billion), by Sub-Segment 1, 2016-2027
      Figure 7: Global Market Forecast (USD Billion), by Sub-Segment 2, 2016-2027
      Figure 8: Global Market Forecast (USD Billion), by Sub-Segment 3, 2016-2027
      Figure 9: Global Circulating Tumor Cell Testing Market Forecast (USD Billion), by Others, 2016-2027
      Figure 10: Global Market Value Share (%), By Segment 3, 2019 & 2027
      Figure 11: Global Market Forecast (USD Billion), by Sub-Segment 1, 2016-2027
      Figure 12: Global Market Forecast (USD Billion), by Sub-Segment 2, 2016-2027
      Figure 13: Global Market Forecast (USD Billion), by Sub-Segment 3, 2016-2027
      Figure 14: Global Market Forecast (USD Billion), by Others, 2016-2027
      Figure 15: Global Market Value (USD Billion), by Region, 2019 & 2027
      Figure 16: North America Circulating Tumor Cell Testing Market Value Share (%), By Segment 1, 2019 & 2027
      Figure 17: North America Market Forecast (USD Billion), by Sub-Segment 1, 2016-2027
      Figure 18: North America Market Forecast (USD Billion), by Sub-Segment 2, 2016-2027
      Figure 19: North America Market Value Share (%), By Segment 2, 2019 & 2027
      Figure 20: North America Market Forecast (USD Billion), by Sub-Segment 1, 2016-2027
      Figure 21: North America Market Forecast (USD Billion), by Sub-Segment 2, 2016-2027
      Figure 22: North America Market Forecast (USD Billion), by Sub-Segment 3, 2016-2027
      Figure 23: North America Market Forecast (USD Billion), by Others, 2016-2027
      Figure 24: North America Market Value Share (%), By Segment 3, 2019 & 2027
      Figure 25: North America Market Forecast (USD Billion), by Sub-Segment 1, 2016-2027
      Figure 26: North America Market Forecast (USD Billion), by Sub-Segment 2, 2016-2027
      Figure 27: North America Market Forecast (USD Billion), by Sub-Segment 3, 2016-2027
      Figure 28: North America Market Forecast (USD Billion), by Others, 2016-2027
      Figure 29: North America Market Forecast (USD Billion), by U.S., 2016-2027
      Figure 30: North America Market Forecast (USD Billion), by Canada, 2016-2027
      Figure 31: Latin America Circulating Tumor Cell Testing Market Value Share (%), By Segment 1, 2019 & 2027
      Figure 32: Latin America Market Forecast (USD Billion), by Sub-Segment 1, 2016-2027
      Figure 33: Latin America Market Forecast (USD Billion), by Sub-Segment 2, 2016-2027
      Figure 34: Latin America Market Value Share (%), By Segment 2, 2019 & 2027
      Figure 35: Latin America Market Forecast (USD Billion), by Sub-Segment 1, 2016-2027
      Figure 36: Latin America Market Forecast (USD Billion), by Sub-Segment 2, 2016-2027
      Figure 37: Latin America Market Forecast (USD Billion), by Sub-Segment 3, 2016-2027
      Figure 38: Latin America Market Forecast (USD Billion), by Others, 2016-2027
      Figure 39: Latin America Market Value Share (%), By Segment 3, 2019 & 2027
      Figure 40: Latin America Market Forecast (USD Billion), by Sub-Segment 1, 2016-2027
      Figure 41: Latin America Market Forecast (USD Billion), by Sub-Segment 2, 2016-2027
      Figure 42: Latin America Market Forecast (USD Billion), by Sub-Segment 3, 2016-2027
      Figure 43: Latin America Market Forecast (USD Billion), by Others, 2016-2027
      Figure 44: Latin America Market Forecast (USD Billion), by Brazil, 2016-2027
      Figure 45: Latin America Market Forecast (USD Billion), by Mexico, 2016-2027
      Figure 46: Latin America Market Forecast (USD Billion), by Rest of Latin America, 2016-2027
      Figure 47: Europe Circulating Tumor Cell Testing Market Value Share (%), By Segment 1, 2019 & 2027
      Figure 48: Europe Market Forecast (USD Billion), by Sub-Segment 1, 2016-2027
      Figure 49: Europe Market Forecast (USD Billion), by Sub-Segment 2, 2016-2027
      Figure 50: Europe Market Value Share (%), By Segment 2, 2019 & 2027
      Figure 51: Europe Market Forecast (USD Billion), by Sub-Segment 1, 2016-2027
      Figure 52: Europe Market Forecast (USD Billion), by Sub-Segment 2, 2016-2027
      Figure 53: Europe Market Forecast (USD Billion), by Sub-Segment 3, 2016-2027
      Figure 54: Europe Market Forecast (USD Billion), by Others, 2016-2027
      Figure 55: Europe Market Value Share (%), By Segment 3, 2019 & 2027
      Figure 56: Europe Market Forecast (USD Billion), by Sub-Segment 1, 2016-2027
      Figure 57: Europe Market Forecast (USD Billion), by Sub-Segment 2, 2016-2027
      Figure 58: Europe Market Forecast (USD Billion), by Sub-Segment 3, 2016-2027
      Figure 59: Europe Market Forecast (USD Billion), by Others, 2016-2027
      Figure 60: Europe Market Forecast (USD Billion), by U.K., 2016-2027
      Figure 61: Europe Market Forecast (USD Billion), by Germany, 2016-2027
      Figure 62: Europe Market Forecast (USD Billion), by France, 2016-2027
      Figure 63: Europe Market Forecast (USD Billion), by Italy, 2016-2027
      Figure 64: Europe Market Forecast (USD Billion), by Spain, 2016-2027
      Figure 65: Europe Market Forecast (USD Billion), by Russia, 2016-2027
      Figure 66: Europe Market Forecast (USD Billion), by Rest of Europe, 2016-2027
      Figure 67: Asia Pacific Circulating Tumor Cell Testing Market Value Share (%), By Segment 1, 2019 & 2027
      Figure 68: Asia Pacific Market Forecast (USD Billion), by Sub-Segment 1, 2016-2027
      Figure 69: Asia Pacific Market Forecast (USD Billion), by Sub-Segment 2, 2016-2027
      Figure 70: Asia Pacific Market Value Share (%), By Segment 2, 2019 & 2027
      Figure 71: Asia Pacific Market Forecast (USD Billion), by Sub-Segment 1, 2016-2027
      Figure 72: Asia Pacific Market Forecast (USD Billion), by Sub-Segment 2, 2016-2027
      Figure 73: Asia Pacific Market Forecast (USD Billion), by Sub-Segment 3, 2016-2027
      Figure 74: Asia Pacific Market Forecast (USD Billion), by Others, 2016-2027
      Figure 75: Asia Pacific Market Value Share (%), By Segment 3, 2019 & 2027
      Figure 76: Asia Pacific Market Forecast (USD Billion), by Sub-Segment 1, 2016-2027
      Figure 77: Asia Pacific Market Forecast (USD Billion), by Sub-Segment 2, 2016-2027
      Figure 78: Asia Pacific Market Forecast (USD Billion), by Sub-Segment 3, 2016-2027
      Figure 79: Asia Pacific Market Forecast (USD Billion), by Others, 2016-2027
      Figure 80: Asia Pacific Market Forecast (USD Billion), by China, 2016-2027
      Figure 81: Asia Pacific Market Forecast (USD Billion), by India, 2016-2027
      Figure 82: Asia Pacific Market Forecast (USD Billion), by Japan, 2016-2027
      Figure 83: Asia Pacific Market Forecast (USD Billion), by Australia, 2016-2027
      Figure 84: Asia Pacific Market Forecast (USD Billion), by Southeast Asia, 2016-2027
      Figure 85: Asia Pacific Market Forecast (USD Billion), by Rest of Asia Pacific, 2016-2027
      Figure 86: Middle East & Africa Circulating Tumor Cell Testing Market Value Share (%), By Segment 1, 2019 & 2027
      Figure 87: Middle East & Africa Market Forecast (USD Billion), by Sub-Segment 1, 2016-2027
      Figure 88: Middle East & Africa Market Forecast (USD Billion), by Sub-Segment 2, 2016-2027
      Figure 89: Middle East & Africa Market Value Share (%), By Segment 2, 2019 & 2027
      Figure 90: Middle East & Africa Market Forecast (USD Billion), by Sub-Segment 1, 2016-2027
      Figure 91: Middle East & Africa Market Forecast (USD Billion), by Sub-Segment 2, 2016-2027
      Figure 92: Middle East & Africa Market Forecast (USD Billion), by Sub-Segment 3, 2016-2027
      Figure 93: Middle East & Africa Market Forecast (USD Billion), by Others, 2016-2027
      Figure 94: Middle East & Africa Market Value Share (%), By Segment 3, 2019 & 2027
      Figure 95: Middle East & Africa Market Forecast (USD Billion), by Sub-Segment 1, 2016-2027
      Figure 96: Middle East & Africa Market Forecast (USD Billion), by Sub-Segment 2, 2016-2027
      Figure 97: Middle East & Africa Market Forecast (USD Billion), by Sub-Segment 3, 2016-2027
      Figure 98: Middle East & Africa Market Forecast (USD Billion), by Others, 2016-2027
      Figure 99: Middle East & Africa Market Forecast (USD Billion), by GCC, 2016-2027
      Figure 100: Middle East & Africa Market Forecast (USD Billion), by South Africa, 2016-2027
      Figure 101: Middle East & Africa Market Forecast (USD Billion), by Rest of Middle East & Africa, 2016-2027 
      List of Tables
      Table 1: Global Circulating Tumor Cell Testing Market Revenue (USD Billion) Forecast, by Segment 1, 2016-2027
      Table 2: Global Market Revenue (USD Billion) Forecast, by Segment 2, 2016-2027
      Table 3: Global Market Revenue (USD Billion) Forecast, by Segment 3, 2016-2027
      Table 4: Global Market Revenue (USD Billion) Forecast, by Region, 2016-2027
      Table 5: North America Circulating Tumor Cell Testing Market Revenue (USD Billion) Forecast, by Segment 1, 2016-2027
      Table 6: North America Market Revenue (USD Billion) Forecast, by Segment 2, 2016-2027
      Table 7: North America Market Revenue (USD Billion) Forecast, by Segment 3, 2016-2027
      Table 8: North America Market Revenue (USD Billion) Forecast, by Country, 2016-2027
      Table 9: Europe Circulating Tumor Cell Testing Market Revenue (USD Billion) Forecast, by Segment 1, 2016-2027
      Table 10: Europe Market Revenue (USD Billion) Forecast, by Segment 2, 2016-2027
      Table 11: Europe Market Revenue (USD Billion) Forecast, by Segment 3, 2016-2027
      Table 12: Europe Market Revenue (USD Billion) Forecast, by Country, 2016-2027
      Table 13: Latin America Circulating Tumor Cell Testing Market Revenue (USD Billion) Forecast, by Segment 1, 2016-2027
      Table 14: Latin America Market Revenue (USD Billion) Forecast, by Segment 2, 2016-2027
      Table 15: Latin America Market Revenue (USD Billion) Forecast, by Segment 3, 2016-2027
      Table 16: Latin America Market Revenue (USD Billion) Forecast, by Country, 2016-2027
      Table 17: Asia Pacific Circulating Tumor Cell Testing Market Revenue (USD Billion) Forecast, by Segment 1, 2016-2027
      Table 18: Asia Pacific Market Revenue (USD Billion) Forecast, by Segment 2, 2016-2027
      Table 19: Asia Pacific Market Revenue (USD Billion) Forecast, by Segment 3, 2016-2027
      Table 20: Asia Pacific Market Revenue (USD Billion) Forecast, by Country, 2016-2027
      Table 21: Middle East & Africa Circulating Tumor Cell Testing Market Revenue (USD Billion) Forecast, by Segment 1, 2016-2027
      Table 22: Middle East & Africa Market Revenue (USD Billion) Forecast, by Segment 2, 2016-2027
      Table 23: Middle East & Africa Market Revenue (USD Billion) Forecast, by Segment 3, 2016-2027
      Table 24: Middle East & Africa Market Revenue (USD Billion) Forecast, by Country, 2016-2027
      Research Process

      Data Library Research are conducted by industry experts who offer insight on industry structure, market segmentations technology assessment and competitive landscape (CL), and penetration, as well as on emerging trends. Their analysis is based on primary interviews (~ 80%) and secondary research (~ 20%) as well as years of professional expertise in their respective industries. Adding to this, by analysing historical trends and current market positions, our analysts predict where the market will be headed for the next five years. Furthermore, the varying trends of segment & categories geographically presented are also studied and the estimated based on the primary & secondary research.

      In this particular report from the supply side Data Library Research has conducted primary surveys (interviews) with the key level executives (VP, CEO’s, Marketing Director, Business Development Manager and SOFT) of the companies that active & prominent as well as the midsized organization

      FIGURE 1: DLR RESEARH PROCESS

      research-methodology1

      Primary Research

      Extensive primary research was conducted to gain a deeper insight of the market and industry performance. The analysis is based on both primary and secondary research as well as years of professional expertise in the respective industries.

      In addition to analysing current and historical trends, our analysts predict where the market is headed over the next five years.

      It varies by segment for these categories geographically presented in the list of market tables. Speaking about this particular report we have conducted primary surveys (interviews) with the key level executives (VP, CEO’s, Marketing Director, Business Development Manager and many more) of the major players active in the market.

      Secondary Research

      Secondary research was mainly used to collect and identify information useful for the extensive, technical, market-oriented, and Friend’s study of the Global Extra Neutral Alcohol. It was also used to obtain key information about major players, market classification and segmentation according to the industry trends, geographical markets, and developments related to the market and technology perspectives. For this study, analysts have gathered information from various credible sources, such as annual reports, sec filings, journals, white papers, SOFT presentations, and company web sites.

      Market Size Estimation

      Both, top-down and bottom-up approaches were used to estimate and validate the size of the Global market and to estimate the size of various other dependent submarkets in the overall Extra Neutral Alcohol. The key players in the market were identified through secondary research and their market contributions in the respective geographies were determined through primary and secondary research.

      Forecast Model

      research-methodology2