Global Computer-Aided Engineering (CAE) Market Opportunities and Forecast 2023-2030

  •   DLR580
  •   March, 2022
  •   Pages: 120
  •  Global
Computer-aided Engineering (CAE) Market Overview

Aviation, space, automation, and shipbuilding are just a few of the industries that use CAE. Because of the speedier processing provided by CAE, one can save time and reach goals more quickly. Computer-aided design (CAD) and computer-aided engineering (CAE) models are imported into CAM software, which operates machine tools such as computer numeric control (CNC). CAE provides better building operation techniques, higher site construction standards, and more advanced designs.

The number of partnerships and mergers and acquisitions between original CAE suppliers and resellers, as well as between resellers, has surged in recent years. As a result, a high number of value-added resellers are becoming more prevalent, which is predicted to boost the CAE market. CAE software offers a wide range of applications and can be used for a variety of activities, including analysis, validation, simulation, and engineering product manufacturing.

Despite the fact that CAE is utilized for analysis and troubleshooting, some critics believe that reliable results come late in the design cycle, which is predicted to limit the CAE market's growth.

Report Metric Details
Market size available for years 2023–2030
Base year considered 2023
Forecast period 2024–2030
Forecast unit Value (USD Million)
Segments covered CAE Tools, End Use, and Region.
Regions covered North America (the U.S. and Canada), Europe (UK, Germany, France, Italy, Spain, Russia, Rest of Europe), Asia-Pacific (China, India, Japan, Australia, South East Asia, Rest of Asia Pacific), Latin America and the Middle East and Africa (Brazil, Saudi Arabia, UAE, Rest of LAMEA)
Companies covered Dassault Systemes, Siemens Product Lifecycle Management Software Inc., CD-adapco, Altair Engineering, Inc., AspenTechnology, Inc., Mentor Graphics, Inc., MSC Software Corporation, Computational Engineering International Inc., ESI Group, Bentley Systems Incorporated, Exa Corporation.


Covid-19 Impact on Computer-aided Engineering (CAE) Market
 
Like many other industries, COVID-19 badly knocked the electronic and semiconductor industries. This unprecedented event has impacted nearly 230 countries in just a few weeks, resulting in the forced shutdown of manufacturing and transportation activities within and across the countries. This has directly affected the overall sector's growth. It is estimated that COVID-19 to leave more than USD 30 billion impacts on the electronics and semiconductor industry. The sector is majorly affected due to transport restrictions on major electronics and semiconductor raw material providers. However, the emerging need for semiconductors in several industries will offer rapid market recovery over the future period.
 
Computer-aided Engineering (CAE) Market Segment Overview
 

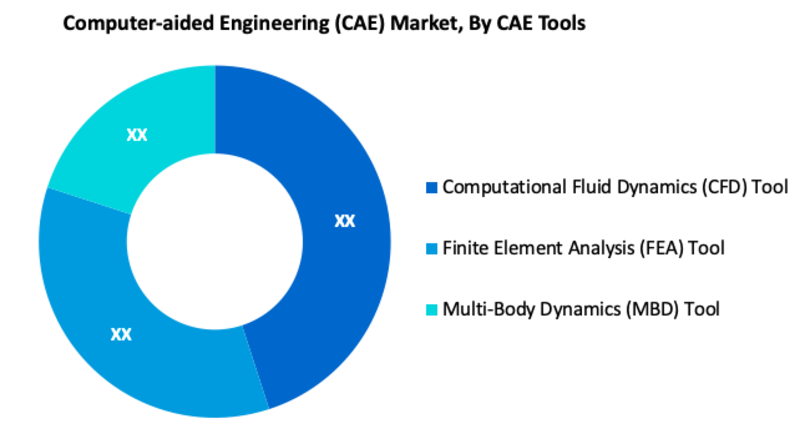
According to CAE Tools, Computational Fluid Dynamics (CFD) Tools is the most prominent segment in the global Computer-aided Engineering (CAE) Market.  Computational Fluid Dynamics (CFD) is the process of mathematically modeling a physical phenomenon involving fluid flow and solving it numerically using computational prowess.
 
With the rise of computers and ever-growing computational power, the field of Computational Fluid Dynamics became a commonly applied tool for generating solutions for fluid flows with or without solid interaction. In a CFD software analysis, the examination of fluid flow by its physical properties such as velocity, pressure, temperature, density, and viscosity is conducted. 
 
Computer-aided Engineering (CAE) Market, By CAE Tools
·       Computational Fluid Dynamics (CFD) Tool
·       Finite Element Analysis (FEA) Tool
·       Multi-Body Dynamics (MBD) Tool

Computer-aided Engineering (CAE) Market, By End Use
·       Electronics and Electrical
·       Defense
·       Aerospace
·       Automobile
·       Industrial Machinery

Computer-aided Engineering (CAE) Market Regional Overview

Based on the region, the global Computer-aided Engineering (CAE) market is classified into Asia Pacific, South America, North America, Middle East & Africa, and Europe. The Asia Pacific is one of the most prominent regions for the market. This is because of the growing adoption of CAE tools and the emergence of a large number of manufacturing industries in this region.
 
Computer-aided Engineering (CAE) Market, By Geography
 
·       North America (US & Canada)
·       Europe (UK, Germany, France, Italy, Spain, Russia & Rest of Europe)
·       Asia-Pacific (Japan, China, India, Australia, & South Korea, & Rest of Asia-Pacific)
·       LAMEA (Brazil, Saudi Arabia, UAE & Rest of LAMEA)
 
Computer-aided Engineering (CAE) Market, Key Players

·       Dassault Systemes
·       Siemens Product Lifecycle Management Software Inc.
·       CD-adapco
·       Altair Engineering, Inc.
·       AspenTechnology, Inc.
·       Mentor Graphics, Inc.
·       MSC Software Corporation
·       Computational Engineering International Inc.
·       ESI Group
·       Bentley Systems Incorporated
·       Exa Corporation

Frequently Asked Questions (FAQ) :

Q1. What are the driving factors for the global Computer-aided Engineering (CAE) market?

CAE software offers a wide range of applications and can be used for a variety of activities, including analysis, validation, simulation, and engineering product manufacturing. This key fact majorly supports the growth of the market.

Q2. What are the restraining factors for the global Computer-aided Engineering (CAE) market?

Some critics believe that reliable results come late in the design cycle, which is predicted to limit the CAE market's growth.

Q3. Which segment is projected to hold the largest share in the global Computer-aided Engineering (CAE) market?

Computational Fluid Dynamics (CFD) Tools segment is projected to hold the largest share in the global Computer-aided Engineering (CAE) market

Q4. Which region holds the largest share in the global Computer-aided Engineering (CAE) market?

Asia pacific holds the largest share in the global Computer-aided Engineering (CAE) market

Q5. Which are the prominent players in the global Computer-aided Engineering (CAE) market?

Dassault Systemes, Siemens Product Lifecycle Management Software Inc., CD-adapco, Altair Engineering, Inc., AspenTechnology, Inc., Mentor Graphics, Inc., MSC Software Corporation, Computational Engineering International Inc., ESI Group, Bentley Systems Incorporated, Exa Corporation. are some key players in the global Computer-aided Engineering (CAE) market
Computer-aided Engineering (CAE) Market Study Global Market Analysis, Insights and Forecast, 2020-2027

    1. Introduction

    • 1.1. Research Scope
    • 1.2. Market Segmentation
    • 1.3. Research Methodology
    • 1.4. Definitions and Assumptions

    2. Executive Summary

      3. Market Dynamics

      • 3.1. Market Drivers
      • 3.2. Market Restraints
      • 3.3. Market Opportunities

      4. Key Insights

      • 4.1. Key Emerging Trends – For Major Countries
      • 4.2. Latest Technological Advancement
      • 4.3. Regulatory Landscape
      • 4.4. Industry SWOT Analysis
      • 4.5. Porters Five Forces Analysis

      5. Global Computer-aided Engineering (CAE) Market Analysis (USD Billion), Insights and Forecast, 2020-2027

      • 5.1. Key Findings / Summary
      • 5.2. Market Analysis, Insights and Forecast – By CAE Tools
        • 5.2.1. Computational Fluid Dynamics (CFD) Tool
        • 5.2.2. Finite Element Analysis (FEA) Tool
        • 5.2.3. Multi-Body Dynamics (MBD) Tool
      • 5.3. Market Analysis, Insights and Forecast – By End Use
        • 5.3.1. Electronics and Electrical
        • 5.3.2. Defense
        • 5.3.3. Aerospace
        • 5.3.4. Automobile
        • 5.3.5. Industrial Machinery
      • 5.4. Market Analysis, Insights and Forecast – By Region
        • 5.4.1. North America
        • 5.4.2. Europe
        • 5.4.3. Asia Pacific
        • 5.4.4. Latin America, Middle East and Africa

      6. North America Computer-aided Engineering (CAE) Market Analysis (USD Billion), Insights and Forecast, 2020-2027

      • 6.1. Key Findings / Summary
      • 6.2. Market Analysis, Insights and Forecast – By CAE Tools
        • 6.2.1. Computational Fluid Dynamics (CFD) Tool
        • 6.2.2. Finite Element Analysis (FEA) Tool
        • 6.2.3. Multi-Body Dynamics (MBD) Tool
      • 6.3. Market Analysis, Insights and Forecast – By End Use
        • 6.3.1. Electronics and Electrical
        • 6.3.2. Defense
        • 6.3.3. Aerospace
        • 6.3.4. Automobile
        • 6.3.5. Industrial Machinery
      • 6.4. Market Analysis, Insights and Forecast – By Country
        • 6.4.1. U.S.
        • 6.4.2. Canada

      7. Europe Computer-aided Engineering (CAE) Market Analysis (USD Billion), Insights and Forecast, 2020-2027

      • 7.1. Key Findings / Summary
      • 7.2. Market Analysis, Insights and Forecast – By CAE Tools
        • 7.2.1. Computational Fluid Dynamics (CFD) Tool
        • 7.2.2. Finite Element Analysis (FEA) Tool
        • 7.2.3. Multi-Body Dynamics (MBD) Tool
      • 7.3. Market Analysis, Insights and Forecast – By End Use
        • 7.3.1. Electronics and Electrical
        • 7.3.2. Defense
        • 7.3.3. Aerospace
        • 7.3.4. Automobile
        • 7.3.5. Industrial Machinery
      • 7.4. Market Analysis, Insights and Forecast – By Country
        • 7.4.1. UK
        • 7.4.2. Germany
        • 7.4.3. France
        • 7.4.4. Italy
        • 7.4.5. Spain
        • 7.4.6. Russia
        • 7.4.7. Rest of Europe

      8. Asia Pacific Computer-aided Engineering (CAE) Market Analysis (USD Billion), Insights and Forecast, 2020-2027

      • 8.1. Key Findings / Summary
      • 8.2. Market Analysis, Insights and Forecast – By CAE Tools
        • 8.2.1. Computational Fluid Dynamics (CFD) Tool
        • 8.2.2. Finite Element Analysis (FEA) Tool
        • 8.2.3. Multi-Body Dynamics (MBD) Tool
      • 8.3. Market Analysis, Insights and Forecast – By End Use
        • 8.3.1. Electronics and Electrical
        • 8.3.2. Defense
        • 8.3.3. Aerospace
        • 8.3.4. Automobile
        • 8.3.5. Industrial Machinery
      • 8.4. Market Analysis, Insights and Forecast – By Country
        • 8.4.1. China
        • 8.4.2. India
        • 8.4.3. Japan
        • 8.4.4. Australia
        • 8.4.5. South East Asia
        • 8.4.6. Rest of Asia Pacific

      9. Latin America, Middle East and Africa Computer-aided Engineering (CAE) Market Analysis (USD Billion), Insights and Forecast, 2020-2027

      • 9.1. Key Findings / Summary
      • 9.2. Market Analysis, Insights and Forecast – By CAE Tools
        • 9.2.1. Computational Fluid Dynamics (CFD) Tool
        • 9.2.2. Finite Element Analysis (FEA) Tool
        • 9.2.3. Multi-Body Dynamics (MBD) Tool
      • 9.3. Market Analysis, Insights and Forecast – By End Use
        • 9.3.1. Electronics and Electrical
        • 9.3.2. Defense
        • 9.3.3. Aerospace
        • 9.3.4. Automobile
        • 9.3.5. Industrial Machinery
      • 9.4. Market Analysis, Insights and Forecast – By Country
        • 9.4.1. Brazil
        • 9.4.2. Saudi Arabia
        • 9.4.3. UAE
        • 9.4.4. Rest of LAMEA

      10. Competitive Analysis

      • 10.1. Company Market Share Analysis, 2018
      • 10.2. Key Industry Developments
      • 10.3. Company Profile
      • 10.4. Dassault Systemes
        • 10.4.1. Business Overview
        • 10.4.2. Segment 1 & Service Offering
        • 10.4.3. Overall Revenue
        • 10.4.4. Geographic Presence
        • 10.4.5. Recent Development
      *Similar details will be provided for the following companies
      • 10.5. Siemens Product Lifecycle Management Software Inc.
      • 10.6. CD-adapco
      • 10.7. Altair Engineering, Inc.
      • 10.8. AspenTechnology, Inc.
      • 10.9. Mentor Graphics, Inc.
      • 10.10. MSC Software Corporation
      • 10.11. Computational Engineering International Inc.
      • 10.12. ESI Group
      • 10.13. Bentley Systems Incorporated
      List of Figures

      Figure 1: Global Computer-Aided Engineering (CAE) Software Market Revenue Breakdown (USD Billion, %) by Region, 2019 & 2027
      Figure 2: Global Market Value Share (%), By Segment 1, 2019 & 2027
      Figure 3: Global Market Forecast (USD Billion), by Sub-Segment 1, 2016-2027
      Figure 4: Global Market Forecast (USD Billion), by Sub-Segment 2, 2016-2027
      Figure 5: Global Market Value Share (%), By Segment 2, 2019 & 2027
      Figure 6: Global Market Forecast (USD Billion), by Sub-Segment 1, 2016-2027
      Figure 7: Global Market Forecast (USD Billion), by Sub-Segment 2, 2016-2027
      Figure 8: Global Market Forecast (USD Billion), by Sub-Segment 3, 2016-2027
      Figure 9: Global Computer-Aided Engineering (CAE) Software Market Forecast (USD Billion), by Others, 2016-2027
      Figure 10: Global Market Value Share (%), By Segment 3, 2019 & 2027
      Figure 11: Global Market Forecast (USD Billion), by Sub-Segment 1, 2016-2027
      Figure 12: Global Market Forecast (USD Billion), by Sub-Segment 2, 2016-2027
      Figure 13: Global Market Forecast (USD Billion), by Sub-Segment 3, 2016-2027
      Figure 14: Global Market Forecast (USD Billion), by Others, 2016-2027
      Figure 15: Global Market Value (USD Billion), by Region, 2019 & 2027
      Figure 16: North America Computer-Aided Engineering (CAE) Software Market Value Share (%), By Segment 1, 2019 & 2027
      Figure 17: North America Market Forecast (USD Billion), by Sub-Segment 1, 2016-2027
      Figure 18: North America Market Forecast (USD Billion), by Sub-Segment 2, 2016-2027
      Figure 19: North America Market Value Share (%), By Segment 2, 2019 & 2027
      Figure 20: North America Market Forecast (USD Billion), by Sub-Segment 1, 2016-2027
      Figure 21: North America Market Forecast (USD Billion), by Sub-Segment 2, 2016-2027
      Figure 22: North America Market Forecast (USD Billion), by Sub-Segment 3, 2016-2027
      Figure 23: North America Market Forecast (USD Billion), by Others, 2016-2027
      Figure 24: North America Market Value Share (%), By Segment 3, 2019 & 2027
      Figure 25: North America Market Forecast (USD Billion), by Sub-Segment 1, 2016-2027
      Figure 26: North America Market Forecast (USD Billion), by Sub-Segment 2, 2016-2027
      Figure 27: North America Market Forecast (USD Billion), by Sub-Segment 3, 2016-2027
      Figure 28: North America Market Forecast (USD Billion), by Others, 2016-2027
      Figure 29: North America Market Forecast (USD Billion), by U.S., 2016-2027
      Figure 30: North America Market Forecast (USD Billion), by Canada, 2016-2027
      Figure 31: Latin America Computer-Aided Engineering (CAE) Software Market Value Share (%), By Segment 1, 2019 & 2027
      Figure 32: Latin America Market Forecast (USD Billion), by Sub-Segment 1, 2016-2027
      Figure 33: Latin America Market Forecast (USD Billion), by Sub-Segment 2, 2016-2027
      Figure 34: Latin America Market Value Share (%), By Segment 2, 2019 & 2027
      Figure 35: Latin America Market Forecast (USD Billion), by Sub-Segment 1, 2016-2027
      Figure 36: Latin America Market Forecast (USD Billion), by Sub-Segment 2, 2016-2027
      Figure 37: Latin America Market Forecast (USD Billion), by Sub-Segment 3, 2016-2027
      Figure 38: Latin America Market Forecast (USD Billion), by Others, 2016-2027
      Figure 39: Latin America Market Value Share (%), By Segment 3, 2019 & 2027
      Figure 40: Latin America Market Forecast (USD Billion), by Sub-Segment 1, 2016-2027
      Figure 41: Latin America Market Forecast (USD Billion), by Sub-Segment 2, 2016-2027
      Figure 42: Latin America Market Forecast (USD Billion), by Sub-Segment 3, 2016-2027
      Figure 43: Latin America Market Forecast (USD Billion), by Others, 2016-2027
      Figure 44: Latin America Market Forecast (USD Billion), by Brazil, 2016-2027
      Figure 45: Latin America Market Forecast (USD Billion), by Mexico, 2016-2027
      Figure 46: Latin America Market Forecast (USD Billion), by Rest of Latin America, 2016-2027
      Figure 47: Europe Computer-Aided Engineering (CAE) Software Market Value Share (%), By Segment 1, 2019 & 2027
      Figure 48: Europe Market Forecast (USD Billion), by Sub-Segment 1, 2016-2027
      Figure 49: Europe Market Forecast (USD Billion), by Sub-Segment 2, 2016-2027
      Figure 50: Europe Market Value Share (%), By Segment 2, 2019 & 2027
      Figure 51: Europe Market Forecast (USD Billion), by Sub-Segment 1, 2016-2027
      Figure 52: Europe Market Forecast (USD Billion), by Sub-Segment 2, 2016-2027
      Figure 53: Europe Market Forecast (USD Billion), by Sub-Segment 3, 2016-2027
      Figure 54: Europe Market Forecast (USD Billion), by Others, 2016-2027
      Figure 55: Europe Market Value Share (%), By Segment 3, 2019 & 2027
      Figure 56: Europe Market Forecast (USD Billion), by Sub-Segment 1, 2016-2027
      Figure 57: Europe Market Forecast (USD Billion), by Sub-Segment 2, 2016-2027
      Figure 58: Europe Market Forecast (USD Billion), by Sub-Segment 3, 2016-2027
      Figure 59: Europe Market Forecast (USD Billion), by Others, 2016-2027
      Figure 60: Europe Market Forecast (USD Billion), by U.K., 2016-2027
      Figure 61: Europe Market Forecast (USD Billion), by Germany, 2016-2027
      Figure 62: Europe Market Forecast (USD Billion), by France, 2016-2027
      Figure 63: Europe Market Forecast (USD Billion), by Italy, 2016-2027
      Figure 64: Europe Market Forecast (USD Billion), by Spain, 2016-2027
      Figure 65: Europe Market Forecast (USD Billion), by Russia, 2016-2027
      Figure 66: Europe Market Forecast (USD Billion), by Rest of Europe, 2016-2027
      Figure 67: Asia Pacific Computer-Aided Engineering (CAE) Software Market Value Share (%), By Segment 1, 2019 & 2027
      Figure 68: Asia Pacific Market Forecast (USD Billion), by Sub-Segment 1, 2016-2027
      Figure 69: Asia Pacific Market Forecast (USD Billion), by Sub-Segment 2, 2016-2027
      Figure 70: Asia Pacific Market Value Share (%), By Segment 2, 2019 & 2027
      Figure 71: Asia Pacific Market Forecast (USD Billion), by Sub-Segment 1, 2016-2027
      Figure 72: Asia Pacific Market Forecast (USD Billion), by Sub-Segment 2, 2016-2027
      Figure 73: Asia Pacific Market Forecast (USD Billion), by Sub-Segment 3, 2016-2027
      Figure 74: Asia Pacific Market Forecast (USD Billion), by Others, 2016-2027
      Figure 75: Asia Pacific Market Value Share (%), By Segment 3, 2019 & 2027
      Figure 76: Asia Pacific Market Forecast (USD Billion), by Sub-Segment 1, 2016-2027
      Figure 77: Asia Pacific Market Forecast (USD Billion), by Sub-Segment 2, 2016-2027
      Figure 78: Asia Pacific Market Forecast (USD Billion), by Sub-Segment 3, 2016-2027
      Figure 79: Asia Pacific Market Forecast (USD Billion), by Others, 2016-2027
      Figure 80: Asia Pacific Market Forecast (USD Billion), by China, 2016-2027
      Figure 81: Asia Pacific Market Forecast (USD Billion), by India, 2016-2027
      Figure 82: Asia Pacific Market Forecast (USD Billion), by Japan, 2016-2027
      Figure 83: Asia Pacific Market Forecast (USD Billion), by Australia, 2016-2027
      Figure 84: Asia Pacific Market Forecast (USD Billion), by Southeast Asia, 2016-2027
      Figure 85: Asia Pacific Market Forecast (USD Billion), by Rest of Asia Pacific, 2016-2027
      Figure 86: Middle East & Africa Computer-Aided Engineering (CAE) Software Market Value Share (%), By Segment 1, 2019 & 2027
      Figure 87: Middle East & Africa Market Forecast (USD Billion), by Sub-Segment 1, 2016-2027
      Figure 88: Middle East & Africa Market Forecast (USD Billion), by Sub-Segment 2, 2016-2027
      Figure 89: Middle East & Africa Market Value Share (%), By Segment 2, 2019 & 2027
      Figure 90: Middle East & Africa Market Forecast (USD Billion), by Sub-Segment 1, 2016-2027
      Figure 91: Middle East & Africa Market Forecast (USD Billion), by Sub-Segment 2, 2016-2027
      Figure 92: Middle East & Africa Market Forecast (USD Billion), by Sub-Segment 3, 2016-2027
      Figure 93: Middle East & Africa Market Forecast (USD Billion), by Others, 2016-2027
      Figure 94: Middle East & Africa Market Value Share (%), By Segment 3, 2019 & 2027
      Figure 95: Middle East & Africa Market Forecast (USD Billion), by Sub-Segment 1, 2016-2027
      Figure 96: Middle East & Africa Market Forecast (USD Billion), by Sub-Segment 2, 2016-2027
      Figure 97: Middle East & Africa Market Forecast (USD Billion), by Sub-Segment 3, 2016-2027
      Figure 98: Middle East & Africa Market Forecast (USD Billion), by Others, 2016-2027
      Figure 99: Middle East & Africa Market Forecast (USD Billion), by GCC, 2016-2027
      Figure 100: Middle East & Africa Market Forecast (USD Billion), by South Africa, 2016-2027
      Figure 101: Middle East & Africa Market Forecast (USD Billion), by Rest of Middle East & Africa, 2016-2027 
      List of Tables
      Table 1: Global Computer-Aided Engineering (CAE) Software Market Revenue (USD Billion) Forecast, by Segment 1, 2016-2027
      Table 2: Global Market Revenue (USD Billion) Forecast, by Segment 2, 2016-2027
      Table 3: Global Market Revenue (USD Billion) Forecast, by Segment 3, 2016-2027
      Table 4: Global Market Revenue (USD Billion) Forecast, by Region, 2016-2027
      Table 5: North America Computer-Aided Engineering (CAE) Software Market Revenue (USD Billion) Forecast, by Segment 1, 2016-2027
      Table 6: North America Market Revenue (USD Billion) Forecast, by Segment 2, 2016-2027
      Table 7: North America Market Revenue (USD Billion) Forecast, by Segment 3, 2016-2027
      Table 8: North America Market Revenue (USD Billion) Forecast, by Country, 2016-2027
      Table 9: Europe Computer-Aided Engineering (CAE) Software Market Revenue (USD Billion) Forecast, by Segment 1, 2016-2027
      Table 10: Europe Market Revenue (USD Billion) Forecast, by Segment 2, 2016-2027
      Table 11: Europe Market Revenue (USD Billion) Forecast, by Segment 3, 2016-2027
      Table 12: Europe Market Revenue (USD Billion) Forecast, by Country, 2016-2027
      Table 13: Latin America Computer-Aided Engineering (CAE) Software Market Revenue (USD Billion) Forecast, by Segment 1, 2016-2027
      Table 14: Latin America Market Revenue (USD Billion) Forecast, by Segment 2, 2016-2027
      Table 15: Latin America Market Revenue (USD Billion) Forecast, by Segment 3, 2016-2027
      Table 16: Latin America Market Revenue (USD Billion) Forecast, by Country, 2016-2027
      Table 17: Asia Pacific Computer-Aided Engineering (CAE) Software Market Revenue (USD Billion) Forecast, by Segment 1, 2016-2027
      Table 18: Asia Pacific Market Revenue (USD Billion) Forecast, by Segment 2, 2016-2027
      Table 19: Asia Pacific Market Revenue (USD Billion) Forecast, by Segment 3, 2016-2027
      Table 20: Asia Pacific Market Revenue (USD Billion) Forecast, by Country, 2016-2027
      Table 21: Middle East & Africa Computer-Aided Engineering (CAE) Software Market Revenue (USD Billion) Forecast, by Segment 1, 2016-2027
      Table 22: Middle East & Africa Market Revenue (USD Billion) Forecast, by Segment 2, 2016-2027
      Table 23: Middle East & Africa Market Revenue (USD Billion) Forecast, by Segment 3, 2016-2027
      Table 24: Middle East & Africa Market Revenue (USD Billion) Forecast, by Country, 2016-2027
      Research Process

      Data Library Research are conducted by industry experts who offer insight on industry structure, market segmentations technology assessment and competitive landscape (CL), and penetration, as well as on emerging trends. Their analysis is based on primary interviews (~ 80%) and secondary research (~ 20%) as well as years of professional expertise in their respective industries. Adding to this, by analysing historical trends and current market positions, our analysts predict where the market will be headed for the next five years. Furthermore, the varying trends of segment & categories geographically presented are also studied and the estimated based on the primary & secondary research.

      In this particular report from the supply side Data Library Research has conducted primary surveys (interviews) with the key level executives (VP, CEO’s, Marketing Director, Business Development Manager and SOFT) of the companies that active & prominent as well as the midsized organization

      FIGURE 1: DLR RESEARH PROCESS

      research-methodology1

      Primary Research

      Extensive primary research was conducted to gain a deeper insight of the market and industry performance. The analysis is based on both primary and secondary research as well as years of professional expertise in the respective industries.

      In addition to analysing current and historical trends, our analysts predict where the market is headed over the next five years.

      It varies by segment for these categories geographically presented in the list of market tables. Speaking about this particular report we have conducted primary surveys (interviews) with the key level executives (VP, CEO’s, Marketing Director, Business Development Manager and many more) of the major players active in the market.

      Secondary Research

      Secondary research was mainly used to collect and identify information useful for the extensive, technical, market-oriented, and Friend’s study of the Global Extra Neutral Alcohol. It was also used to obtain key information about major players, market classification and segmentation according to the industry trends, geographical markets, and developments related to the market and technology perspectives. For this study, analysts have gathered information from various credible sources, such as annual reports, sec filings, journals, white papers, SOFT presentations, and company web sites.

      Market Size Estimation

      Both, top-down and bottom-up approaches were used to estimate and validate the size of the Global market and to estimate the size of various other dependent submarkets in the overall Extra Neutral Alcohol. The key players in the market were identified through secondary research and their market contributions in the respective geographies were determined through primary and secondary research.

      Forecast Model

      research-methodology2