Global Connected Aircraft Market Opportunities and Forecast 2023-2030

  •   DLR1841
  •   August, 2022
  •   Pages: 120
  •  Global
Connected Aircraft Market Overview

The global Connected Aircraft market is expected to rise at a significant rate in the forecast period. Presently, the airline industry requires real-time weather data collection systems to assure flight safety in the face of changing weather conditions. The concept of connected aircraft can meet these requirements. As a result of the increased attention on flight safety, the global Connected Aircraft market is predicted to expand in the coming period.
 
Furthermore, during their flight, passengers expect high-speed internet access. Aviation sectors and operators are aiming to provide satellite-based connection options to passengers to suit their needs. During flight hours, this will ensure the fastest possible internet connections. As a result of passenger desire for internet connectivity, the Connected Aircraft market is likely to grow in the near future.

On the negative side, cybersecurity concerns by the airlines in developing countries is one of the factors restraining the growth of the Connected Aircraft market.

Report Metric Details
Market size available for years 2023–2030
Base year considered 2023
Forecast period 2024–2030
Forecast unit Value (USD Million)
Segments covered Type, Application, Connectivity, Frequency Band, and Region
Regions covered North America (the U.S. and Canada), Europe (UK, Germany, France, Italy, Spain, Russia, Rest of Europe), Asia-Pacific (China, India, Japan, Australia, South East Asia, Rest of Asia Pacific), Latin America and the Middle East and Africa (Brazil, Saudi Arabia, UAE, Rest of LAMEA)
Companies covered Gogo, Honeywell, Panasonic Avionics, Global Eagle Entertainment, Inmarsat.


Covid-19 Impact on Connected Aircraft Market

As the COVID-19 pandemic continuing its effect around the world, many defense and aerospace companies are facing its impact during this time around the world. For instance, commercial aviation companies in the U.S., France, Germany, and Canada are facing disruption in the production process and reduced demand as workforces staying at home, passengers stop traveling, and delay in delivery of new aircraft. Analysts expecting a drop from 3,000 to 4,000 aircraft during the pandemic period. On the defense side, contractors operating in the sector are in a better position, hence the impact of the pandemic is likely low in the short to mid-term. However, low demand due to budget constraints affecting the production as in aircraft manufacturing.

Connected Aircraft Market Segment Overview


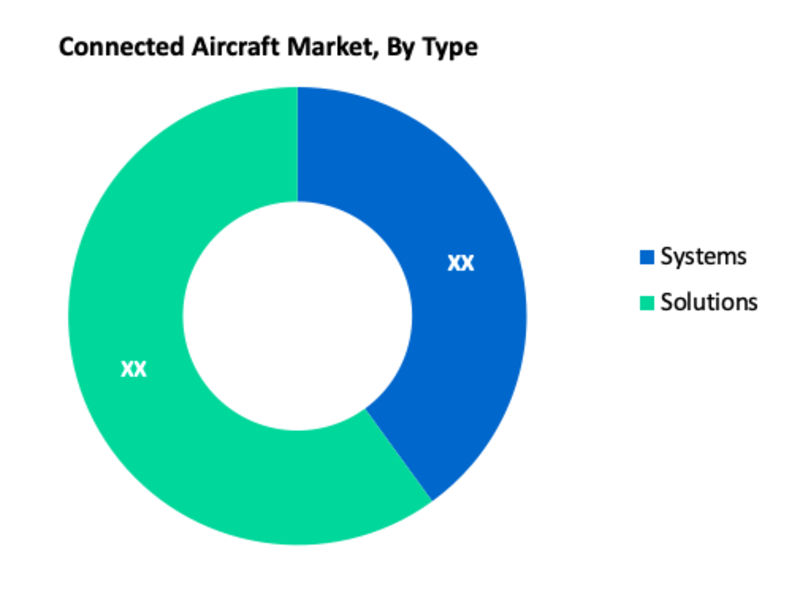
Based on type, the Solutions segment is estimated to lead the market and is projected to continue to lead during the forecast period. This growth can be attributed to the rising passenger traffic and increasing demand for inflight connectivity are driving the solutions segment. By Application, the Commercial segment is expected to grow at a higher rate, due to the increasing aircraft orders from the Asia Pacific and the Middle East countries. According to Connectivity, Inflight Connectivity is the largest segment in the market. The growing demand for inflight entertainment and passenger connectivity is driving the growth of the inflight connectivity segment.
 
Connected Aircraft Market, By Type
·       Systems
·       Solutions
 
Connected Aircraft Market, By Application
·       Commercial
·       Military
 
Connected Aircraft Market, By Connectivity
·       Inflight Connectivity
·       Air-to-Air Connectivity
·       Air-to-Ground Connectivity
 
Connected Aircraft Market, By Frequency Band
·       Ka-band
·       Ku-band
·       L-band
 
Connected Aircraft Market Regional Overview

Region-Wise, North America commanded a major share of the market and is predictable to maintain its supremacy over the forecast period. There are major commercial aircraft manufacturers and airlines in North America such as Boeing (US), American Airlines (US), United Airlines (US), and Bombardier (Canada), which make high demand for connected aircraft products.
 
Connected Aircraft Market, By Geography
 
·       North America (US & Canada)
·       Europe (UK, Germany, France, Italy, Spain, Russia & Rest of Europe)
·       Asia-Pacific (Japan, China, India, Australia, & South Korea, & Rest of Asia-Pacific)
·       LAMEA (Brazil, Saudi Arabia, UAE & Rest of LAMEA)

Connected Aircraft Market, Key Players

·       Gogo 
·       Honeywell 
·       Panasonic Avionics 
·       Global Eagle Entertainment 
·       Inmarsat

Frequently Asked Questions (FAQ) :

Q1. What are the driving factors for the Connected Aircraft market?

With the increased attention on flight safety, the global Connected Aircraft market is predicted to expand in the coming period.

Q2. What are the restraining factors for the Connected Aircraft market?

Cybersecurity concerns by the airlines in developing countries are one of the factors restraining the growth of the Connected Aircraft market.

Q3. Which Segments are covered in the Connected Aircraft market report?

Type, Application, Connectivity, Frequency Band, and Region these segments are covered in the Connected Aircraft market report.

Q4. Which segment is projected to hold the largest share in the Connected Aircraft Market. ?

Solutions segment is projected to hold the largest share in the Connected Aircraft Market.

Q5. Which region holds the largest share in the Connected Aircraft market?

North America held the largest share in the global Connected Aircraft market.
Connected Aircraft Market Study Global Market Analysis, Insights and Forecast, 2020-2027

    1. Introduction

    • 1.1. Research Scope
    • 1.2. Market Segmentation
    • 1.3. Research Methodology
    • 1.4. Definitions and Assumptions

    2. Executive Summary

      3. Market Dynamics

      • 3.1. Market Drivers
      • 3.2. Market Restraints
      • 3.3. Market Opportunities

      4. Key Insights

      • 4.1. Key Emerging Trends – For Major Countries
      • 4.2. Latest Technological Advancement
      • 4.3. Regulatory Landscape
      • 4.4. Industry SWOT Analysis
      • 4.5. Porters Five Forces Analysis

      5. Global Connected Aircraft Market Analysis (USD Billion), Insights and Forecast, 2020-2027

      • 5.1. Key Findings / Summary
      • 5.2. Market Analysis, Insights and Forecast – By Type
        • 5.2.1. Systems
        • 5.2.2. Solutions
      • 5.3. Market Analysis, Insights and Forecast – By Application
        • 5.3.1. Commercial
        • 5.3.2. Military
      • 5.4. Market Analysis, Insights and Forecast – By Connectivity
        • 5.4.1. Inflight Connectivity
        • 5.4.2. Air-to-Air Connectivity
        • 5.4.3. Air-to-Ground Connectivity
      • 5.5. Market Analysis, Insights and Forecast – By Frequency Band
        • 5.5.1. Ka-band
        • 5.5.2. Ku-band
        • 5.5.3. L-band
      • 5.6. Market Analysis, Insights and Forecast – By Region
        • 5.6.1. North America
        • 5.6.2. Europe
        • 5.6.3. Asia Pacific
        • 5.6.4. Latin America, Middle East and Africa

      6. North America Connected Aircraft Market Analysis (USD Billion), Insights and Forecast, 2020-2027

      • 6.1. Key Findings / Summary
      • 6.2. Market Analysis, Insights and Forecast – By Type
        • 6.2.1. Systems
        • 6.2.2. Solutions
      • 6.3. Market Analysis, Insights and Forecast – By Application
        • 6.3.1. Commercial
        • 6.3.2. Military
      • 6.4. Market Analysis, Insights and Forecast – By Connectivity
        • 6.4.1. Inflight Connectivity
        • 6.4.2. Air-to-Air Connectivity
        • 6.4.3. Air-to-Ground Connectivity
      • 6.5. Market Analysis, Insights and Forecast – By Frequency Band
        • 6.5.1. Ka-band
        • 6.5.2. Ku-band
        • 6.5.3. L-band
      • 6.6. Market Analysis, Insights and Forecast – By Country
        • 6.6.1. U.S.
        • 6.6.2. Canada

      7. Europe Connected Aircraft Market Analysis (USD Billion), Insights and Forecast, 2020-2027

      • 7.1. Key Findings / Summary
      • 7.2. Market Analysis, Insights and Forecast – By Type
        • 7.2.1. Systems
        • 7.2.2. Solutions
      • 7.3. Market Analysis, Insights and Forecast – By Application
        • 7.3.1. Commercial
        • 7.3.2. Military
      • 7.4. Market Analysis, Insights and Forecast – By Connectivity
        • 7.4.1. Inflight Connectivity
        • 7.4.2. Air-to-Air Connectivity
        • 7.4.3. Air-to-Ground Connectivity
      • 7.5. Market Analysis, Insights and Forecast – By Frequency Band
        • 7.5.1. Ka-band
        • 7.5.2. Ku-band
        • 7.5.3. L-band
      • 7.6. Market Analysis, Insights and Forecast – By Country
        • 7.6.1. UK
        • 7.6.2. Germany
        • 7.6.3. France
        • 7.6.4. Italy
        • 7.6.5. Spain
        • 7.6.6. Russia
        • 7.6.7. Rest of Europe

      8. Asia Pacific Connected Aircraft Market Analysis (USD Billion), Insights and Forecast, 2020-2027

      • 8.1. Key Findings / Summary
      • 8.2. Market Analysis, Insights and Forecast – By Type
        • 8.2.1. Systems
        • 8.2.2. Solutions
      • 8.3. Market Analysis, Insights and Forecast – By Application
        • 8.3.1. Commercial
        • 8.3.2. Military
      • 8.4. Market Analysis, Insights and Forecast – By Connectivity
        • 8.4.1. Inflight Connectivity
        • 8.4.2. Air-to-Air Connectivity
        • 8.4.3. Air-to-Ground Connectivity
      • 8.5. Market Analysis, Insights and Forecast – By Frequency Band
        • 8.5.1. Ka-band
        • 8.5.2. Ku-band
        • 8.5.3. L-band
      • 8.6. Market Analysis, Insights and Forecast – By Country
        • 8.6.1. China
        • 8.6.2. India
        • 8.6.3. Japan
        • 8.6.4. Australia
        • 8.6.5. South East Asia
        • 8.6.6. Rest of Asia Pacific

      9. Latin America, Middle East and Africa Connected Aircraft Market Analysis (USD Billion), Insights and Forecast, 2020-2027

      • 9.1. Key Findings / Summary
      • 9.2. Market Analysis, Insights and Forecast – By Type
        • 9.2.1. Systems
        • 9.2.2. Solutions
      • 9.3. Market Analysis, Insights and Forecast – By Application
        • 9.3.1. Commercial
        • 9.3.2. Military
      • 9.4. Market Analysis, Insights and Forecast – By Connectivity
        • 9.4.1. Inflight Connectivity
        • 9.4.2. Air-to-Air Connectivity
        • 9.4.3. Air-to-Ground Connectivity
      • 9.5. Market Analysis, Insights and Forecast – By Frequency Band
        • 9.5.1. Ka-band
        • 9.5.2. Ku-band
        • 9.5.3. L-band
      • 9.6. Market Analysis, Insights and Forecast – By Country
        • 9.6.1. Brazil
        • 9.6.2. Saudi Arabia
        • 9.6.3. UAE
        • 9.6.4. Rest of LAMEA

      10. Competitive Analysis

      • 10.1. Company Market Share Analysis, 2018
      • 10.2. Key Industry Developments
      • 10.3. Company Profile
      • 10.4. Gogo
        • 10.4.1. Business Overview
        • 10.4.2. Segment 1 & Service Offering
        • 10.4.3. Overall Revenue
        • 10.4.4. Geographic Presence
        • 10.4.5. Recent Development
      *Similar details will be provided for the following companies
      • 10.5. Honeywell
      • 10.6. Panasonic Avionics
      • 10.7. Global Eagle Entertainment
      List of Figures

      Figure 1: Global Connected Aircraft Market Revenue Breakdown (USD Billion, %) by Region, 2019 & 2027
      Figure 2: Global Market Value Share (%), By Segment 1, 2019 & 2027
      Figure 3: Global Market Forecast (USD Billion), by Sub-Segment 1, 2016-2027
      Figure 4: Global Market Forecast (USD Billion), by Sub-Segment 2, 2016-2027
      Figure 5: Global Market Value Share (%), By Segment 2, 2019 & 2027
      Figure 6: Global Market Forecast (USD Billion), by Sub-Segment 1, 2016-2027
      Figure 7: Global Market Forecast (USD Billion), by Sub-Segment 2, 2016-2027
      Figure 8: Global Market Forecast (USD Billion), by Sub-Segment 3, 2016-2027
      Figure 9: Global Connected Aircraft Market Forecast (USD Billion), by Others, 2016-2027
      Figure 10: Global Market Value Share (%), By Segment 3, 2019 & 2027
      Figure 11: Global Market Forecast (USD Billion), by Sub-Segment 1, 2016-2027
      Figure 12: Global Market Forecast (USD Billion), by Sub-Segment 2, 2016-2027
      Figure 13: Global Market Forecast (USD Billion), by Sub-Segment 3, 2016-2027
      Figure 14: Global Market Forecast (USD Billion), by Others, 2016-2027
      Figure 15: Global Market Value (USD Billion), by Region, 2019 & 2027
      Figure 16: North America Connected Aircraft Market Value Share (%), By Segment 1, 2019 & 2027
      Figure 17: North America Market Forecast (USD Billion), by Sub-Segment 1, 2016-2027
      Figure 18: North America Market Forecast (USD Billion), by Sub-Segment 2, 2016-2027
      Figure 19: North America Market Value Share (%), By Segment 2, 2019 & 2027
      Figure 20: North America Market Forecast (USD Billion), by Sub-Segment 1, 2016-2027
      Figure 21: North America Market Forecast (USD Billion), by Sub-Segment 2, 2016-2027
      Figure 22: North America Market Forecast (USD Billion), by Sub-Segment 3, 2016-2027
      Figure 23: North America Market Forecast (USD Billion), by Others, 2016-2027
      Figure 24: North America Market Value Share (%), By Segment 3, 2019 & 2027
      Figure 25: North America Market Forecast (USD Billion), by Sub-Segment 1, 2016-2027
      Figure 26: North America Market Forecast (USD Billion), by Sub-Segment 2, 2016-2027
      Figure 27: North America Market Forecast (USD Billion), by Sub-Segment 3, 2016-2027
      Figure 28: North America Market Forecast (USD Billion), by Others, 2016-2027
      Figure 29: North America Market Forecast (USD Billion), by U.S., 2016-2027
      Figure 30: North America Market Forecast (USD Billion), by Canada, 2016-2027
      Figure 31: Latin America Connected Aircraft Market Value Share (%), By Segment 1, 2019 & 2027
      Figure 32: Latin America Market Forecast (USD Billion), by Sub-Segment 1, 2016-2027
      Figure 33: Latin America Market Forecast (USD Billion), by Sub-Segment 2, 2016-2027
      Figure 34: Latin America Market Value Share (%), By Segment 2, 2019 & 2027
      Figure 35: Latin America Market Forecast (USD Billion), by Sub-Segment 1, 2016-2027
      Figure 36: Latin America Market Forecast (USD Billion), by Sub-Segment 2, 2016-2027
      Figure 37: Latin America Market Forecast (USD Billion), by Sub-Segment 3, 2016-2027
      Figure 38: Latin America Market Forecast (USD Billion), by Others, 2016-2027
      Figure 39: Latin America Market Value Share (%), By Segment 3, 2019 & 2027
      Figure 40: Latin America Market Forecast (USD Billion), by Sub-Segment 1, 2016-2027
      Figure 41: Latin America Market Forecast (USD Billion), by Sub-Segment 2, 2016-2027
      Figure 42: Latin America Market Forecast (USD Billion), by Sub-Segment 3, 2016-2027
      Figure 43: Latin America Market Forecast (USD Billion), by Others, 2016-2027
      Figure 44: Latin America Market Forecast (USD Billion), by Brazil, 2016-2027
      Figure 45: Latin America Market Forecast (USD Billion), by Mexico, 2016-2027
      Figure 46: Latin America Market Forecast (USD Billion), by Rest of Latin America, 2016-2027
      Figure 47: Europe Connected Aircraft Market Value Share (%), By Segment 1, 2019 & 2027
      Figure 48: Europe Market Forecast (USD Billion), by Sub-Segment 1, 2016-2027
      Figure 49: Europe Market Forecast (USD Billion), by Sub-Segment 2, 2016-2027
      Figure 50: Europe Market Value Share (%), By Segment 2, 2019 & 2027
      Figure 51: Europe Market Forecast (USD Billion), by Sub-Segment 1, 2016-2027
      Figure 52: Europe Market Forecast (USD Billion), by Sub-Segment 2, 2016-2027
      Figure 53: Europe Market Forecast (USD Billion), by Sub-Segment 3, 2016-2027
      Figure 54: Europe Market Forecast (USD Billion), by Others, 2016-2027
      Figure 55: Europe Market Value Share (%), By Segment 3, 2019 & 2027
      Figure 56: Europe Market Forecast (USD Billion), by Sub-Segment 1, 2016-2027
      Figure 57: Europe Market Forecast (USD Billion), by Sub-Segment 2, 2016-2027
      Figure 58: Europe Market Forecast (USD Billion), by Sub-Segment 3, 2016-2027
      Figure 59: Europe Market Forecast (USD Billion), by Others, 2016-2027
      Figure 60: Europe Market Forecast (USD Billion), by U.K., 2016-2027
      Figure 61: Europe Market Forecast (USD Billion), by Germany, 2016-2027
      Figure 62: Europe Market Forecast (USD Billion), by France, 2016-2027
      Figure 63: Europe Market Forecast (USD Billion), by Italy, 2016-2027
      Figure 64: Europe Market Forecast (USD Billion), by Spain, 2016-2027
      Figure 65: Europe Market Forecast (USD Billion), by Russia, 2016-2027
      Figure 66: Europe Market Forecast (USD Billion), by Rest of Europe, 2016-2027
      Figure 67: Asia Pacific Connected Aircraft Market Value Share (%), By Segment 1, 2019 & 2027
      Figure 68: Asia Pacific Market Forecast (USD Billion), by Sub-Segment 1, 2016-2027
      Figure 69: Asia Pacific Market Forecast (USD Billion), by Sub-Segment 2, 2016-2027
      Figure 70: Asia Pacific Market Value Share (%), By Segment 2, 2019 & 2027
      Figure 71: Asia Pacific Market Forecast (USD Billion), by Sub-Segment 1, 2016-2027
      Figure 72: Asia Pacific Market Forecast (USD Billion), by Sub-Segment 2, 2016-2027
      Figure 73: Asia Pacific Market Forecast (USD Billion), by Sub-Segment 3, 2016-2027
      Figure 74: Asia Pacific Market Forecast (USD Billion), by Others, 2016-2027
      Figure 75: Asia Pacific Market Value Share (%), By Segment 3, 2019 & 2027
      Figure 76: Asia Pacific Market Forecast (USD Billion), by Sub-Segment 1, 2016-2027
      Figure 77: Asia Pacific Market Forecast (USD Billion), by Sub-Segment 2, 2016-2027
      Figure 78: Asia Pacific Market Forecast (USD Billion), by Sub-Segment 3, 2016-2027
      Figure 79: Asia Pacific Market Forecast (USD Billion), by Others, 2016-2027
      Figure 80: Asia Pacific Market Forecast (USD Billion), by China, 2016-2027
      Figure 81: Asia Pacific Market Forecast (USD Billion), by India, 2016-2027
      Figure 82: Asia Pacific Market Forecast (USD Billion), by Japan, 2016-2027
      Figure 83: Asia Pacific Market Forecast (USD Billion), by Australia, 2016-2027
      Figure 84: Asia Pacific Market Forecast (USD Billion), by Southeast Asia, 2016-2027
      Figure 85: Asia Pacific Market Forecast (USD Billion), by Rest of Asia Pacific, 2016-2027
      Figure 86: Middle East & Africa Connected Aircraft Market Value Share (%), By Segment 1, 2019 & 2027
      Figure 87: Middle East & Africa Market Forecast (USD Billion), by Sub-Segment 1, 2016-2027
      Figure 88: Middle East & Africa Market Forecast (USD Billion), by Sub-Segment 2, 2016-2027
      Figure 89: Middle East & Africa Market Value Share (%), By Segment 2, 2019 & 2027
      Figure 90: Middle East & Africa Market Forecast (USD Billion), by Sub-Segment 1, 2016-2027
      Figure 91: Middle East & Africa Market Forecast (USD Billion), by Sub-Segment 2, 2016-2027
      Figure 92: Middle East & Africa Market Forecast (USD Billion), by Sub-Segment 3, 2016-2027
      Figure 93: Middle East & Africa Market Forecast (USD Billion), by Others, 2016-2027
      Figure 94: Middle East & Africa Market Value Share (%), By Segment 3, 2019 & 2027
      Figure 95: Middle East & Africa Market Forecast (USD Billion), by Sub-Segment 1, 2016-2027
      Figure 96: Middle East & Africa Market Forecast (USD Billion), by Sub-Segment 2, 2016-2027
      Figure 97: Middle East & Africa Market Forecast (USD Billion), by Sub-Segment 3, 2016-2027
      Figure 98: Middle East & Africa Market Forecast (USD Billion), by Others, 2016-2027
      Figure 99: Middle East & Africa Market Forecast (USD Billion), by GCC, 2016-2027
      Figure 100: Middle East & Africa Market Forecast (USD Billion), by South Africa, 2016-2027
      Figure 101: Middle East & Africa Market Forecast (USD Billion), by Rest of Middle East & Africa, 2016-2027 
      List of Tables
      Table 1: Global Connected Aircraft Market Revenue (USD Billion) Forecast, by Segment 1, 2016-2027
      Table 2: Global Market Revenue (USD Billion) Forecast, by Segment 2, 2016-2027
      Table 3: Global Market Revenue (USD Billion) Forecast, by Segment 3, 2016-2027
      Table 4: Global Market Revenue (USD Billion) Forecast, by Region, 2016-2027
      Table 5: North America Connected Aircraft Market Revenue (USD Billion) Forecast, by Segment 1, 2016-2027
      Table 6: North America Market Revenue (USD Billion) Forecast, by Segment 2, 2016-2027
      Table 7: North America Market Revenue (USD Billion) Forecast, by Segment 3, 2016-2027
      Table 8: North America Market Revenue (USD Billion) Forecast, by Country, 2016-2027
      Table 9: Europe Connected Aircraft Market Revenue (USD Billion) Forecast, by Segment 1, 2016-2027
      Table 10: Europe Market Revenue (USD Billion) Forecast, by Segment 2, 2016-2027
      Table 11: Europe Market Revenue (USD Billion) Forecast, by Segment 3, 2016-2027
      Table 12: Europe Market Revenue (USD Billion) Forecast, by Country, 2016-2027
      Table 13: Latin America Connected Aircraft Market Revenue (USD Billion) Forecast, by Segment 1, 2016-2027
      Table 14: Latin America Market Revenue (USD Billion) Forecast, by Segment 2, 2016-2027
      Table 15: Latin America Market Revenue (USD Billion) Forecast, by Segment 3, 2016-2027
      Table 16: Latin America Market Revenue (USD Billion) Forecast, by Country, 2016-2027
      Table 17: Asia Pacific Connected Aircraft Market Revenue (USD Billion) Forecast, by Segment 1, 2016-2027
      Table 18: Asia Pacific Market Revenue (USD Billion) Forecast, by Segment 2, 2016-2027
      Table 19: Asia Pacific Market Revenue (USD Billion) Forecast, by Segment 3, 2016-2027
      Table 20: Asia Pacific Market Revenue (USD Billion) Forecast, by Country, 2016-2027
      Table 21: Middle East & Africa Connected Aircraft Market Revenue (USD Billion) Forecast, by Segment 1, 2016-2027
      Table 22: Middle East & Africa Market Revenue (USD Billion) Forecast, by Segment 2, 2016-2027
      Table 23: Middle East & Africa Market Revenue (USD Billion) Forecast, by Segment 3, 2016-2027
      Table 24: Middle East & Africa Market Revenue (USD Billion) Forecast, by Country, 2016-2027
      Research Process

      Data Library Research are conducted by industry experts who offer insight on industry structure, market segmentations technology assessment and competitive landscape (CL), and penetration, as well as on emerging trends. Their analysis is based on primary interviews (~ 80%) and secondary research (~ 20%) as well as years of professional expertise in their respective industries. Adding to this, by analysing historical trends and current market positions, our analysts predict where the market will be headed for the next five years. Furthermore, the varying trends of segment & categories geographically presented are also studied and the estimated based on the primary & secondary research.

      In this particular report from the supply side Data Library Research has conducted primary surveys (interviews) with the key level executives (VP, CEO’s, Marketing Director, Business Development Manager and SOFT) of the companies that active & prominent as well as the midsized organization

      FIGURE 1: DLR RESEARH PROCESS

      research-methodology1

      Primary Research

      Extensive primary research was conducted to gain a deeper insight of the market and industry performance. The analysis is based on both primary and secondary research as well as years of professional expertise in the respective industries.

      In addition to analysing current and historical trends, our analysts predict where the market is headed over the next five years.

      It varies by segment for these categories geographically presented in the list of market tables. Speaking about this particular report we have conducted primary surveys (interviews) with the key level executives (VP, CEO’s, Marketing Director, Business Development Manager and many more) of the major players active in the market.

      Secondary Research

      Secondary research was mainly used to collect and identify information useful for the extensive, technical, market-oriented, and Friend’s study of the Global Extra Neutral Alcohol. It was also used to obtain key information about major players, market classification and segmentation according to the industry trends, geographical markets, and developments related to the market and technology perspectives. For this study, analysts have gathered information from various credible sources, such as annual reports, sec filings, journals, white papers, SOFT presentations, and company web sites.

      Market Size Estimation

      Both, top-down and bottom-up approaches were used to estimate and validate the size of the Global market and to estimate the size of various other dependent submarkets in the overall Extra Neutral Alcohol. The key players in the market were identified through secondary research and their market contributions in the respective geographies were determined through primary and secondary research.

      Forecast Model

      research-methodology2