


A data center is a facility used by an enterprise to accommodate computer systems, servers, network systems, and other associated components to support a company’s IT infrastructural requirements. This mostly includes storing, processing, and serving huge amounts of crucial data, which ranges from small servers to strong large industrial scale equipment and dedicated client architecture. The global Data Center Construction market is expected to rise at a considerable rate in the forthcoming years.
The data centre construction market is predicted to develop as demand for energy-efficient data centres rises as companies seek to reduce their carbon footprint and incorporate more renewable assets into their operations. As a result, data centres are attempting to become more environmentally friendly, resulting in an increase in the usage of electricity supplied by solar and wind power for data centres. Furthermore, to accommodate ever increasing amount of data, companies are forced to maintain numerous data centers, which are usually located at distant places. This is a key factor boosting the growth of the data center construction market.
Furthermore, because of the considerable increase in internet users and increased transactions in recent years, the data centre industry is seeing tremendous growth. The growing demand for cloud-based services and data storage facilities by businesses all over the world is propelling the data centre construction industry forward. Additionally, the ever-increasing data traffic is driving up demand for data storage, necessitating ongoing data centre growth and repair. Furthermore, firms are looking to expand their data centres globally in order to fulfill the increased demand from businesses. These aspects escalate the growth of the global Data Center Construction market.
On the downside, some of the key restraints for the growth of the data center construction market are the lack of necessary resources and the increasing popularity of containerized data centers.
| Report Metric | Details |
| Market size available for years | 2023–2030 |
| Base year considered | 2023 |
| Forecast period | 2024–2030 |
| Forecast unit | Value (USD Million) |
| Segments covered | IT Infrastructure, Power Distribution & Cooling Infrastructure, Tier Type, End-use, and Region |
| Regions covered | North America (the U.S. and Canada), Europe (UK, Germany, France, Italy, Spain, Russia, Rest of Europe), Asia-Pacific (China, India, Japan, Australia, South East Asia, Rest of Asia Pacific), Latin America and the Middle East and Africa (Brazil, Saudi Arabia, UAE, Rest of LAMEA) |
| Companies covered | Corgan Associates, Inc., Holder Construction, Turner Construction, DPR Construction, Structure Tone, Mortenson Construction, Gilbane Inc., Balfour Beatty US, Hensel Phelps, Hoffman Construction, HITT Contracting, Fluor Corporation, IMC Construction, Pepper Construction and FORTIS Construction Inc. |
Covid-19 Impact on Data Center Construction Market
Like many other industries, COVID-19 badly knocked the electronic and semiconductor industries. This unprecedented event has impacted nearly 230 countries in just a few weeks, resulting in the forced shutdown of manufacturing and transportation activities within and across the countries. This has directly affected the overall sector's growth. It is estimated that COVID-19 to leave more than USD 30 billion impacts on the electronics and semiconductor industry. The sector is majorly affected due to transport restrictions on major electronics and semiconductor raw material providers. However, the emerging need for semiconductors in several industries will offer rapid market recovery over the future period.
Data Center Construction Market Segment Overview
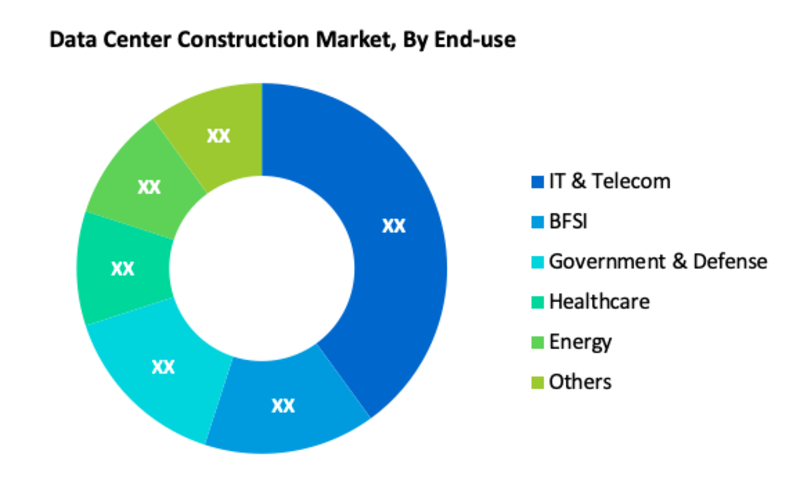
Based on End-use, the IT & Telecom segment dominated the global Data Center Construction market and accounted for the highest share in 2023 as a result of the proliferation of smartphones and the increase in the number of active internet users worldwide. Additionally, the continued rollout of 5G networks also allowed the segment to dominate the market in 2023 and the trend is anticipated to continue in the coming period.
Data Center Construction Market, By IT Infrastructure
· Networking Equipment
· Server
· Storage
Data Center Construction Market, By Power Distribution & Cooling Infrastructure
· Power Distribution
· Cooling
Data Center Construction Market, By Tier Type
· Tier 1
· Tier 2
· Tier 3
Data Center Construction Market, By End-use
· IT & Telecom
· BFSI
· Government & Defense
· Healthcare
· Energy
· Others
Data Center Construction Market Regional Overview
Region-wise, North America dominated the Data Center Construction market and accounted for the major revenue share in 2023, followed by the Asia Pacific. The high revenue share of North America can be attributed to the biggest investments in hyperscale projects. In addition to this, the U.S. is a developed economy with the presence of established, sophisticated network infrastructure. It is also home to leading cloud service providers, such as Amazon.com, Google, Inc., and Facebook. These companies are investing hugely in the construction of mega facilities for additional data storage and processing capabilities, thus opening several opportunities for market growth. Similarly, in the Asia Pacific, the market for data center construction is anticipated to register the fastest growth in the forecast period, with China and India contributing significantly to the regional data center construction market.
Data Center Construction Market, By Geography
· North America (US & Canada)
· Europe (UK, Germany, France, Italy, Spain, Russia & Rest of Europe)
· Asia-Pacific (Japan, China, India, Australia, & South Korea, & Rest of Asia-Pacific)
· LAMEA (Brazil, Saudi Arabia, UAE & Rest of LAMEA)
Data Center Construction Market Competitor overview
Some key developments and strategies adopted by manufacturers in Data Center Construction are highlighted below.
· In October 2021, Russian ICT firm Liberum Navitas has announced a project to build a network of 15 data centers across the country. The company said it has launched a large federal investment project to create an all-Russian network of data centers united by a single fiber-optic communication line. The company is aiming to deliver the facilities within two years.
Data Center Construction Market, Key Players
· Corgan Associates, Inc.
· Holder Construction
· Turner Construction
· DPR Construction
· Structure Tone
· Mortenson Construction
· Gilbane Inc.
· Balfour Beatty US
· Hensel Phelps
· Hoffman Construction
· HITT Contracting
· Fluor Corporation
· IMC Construction
· Pepper Construction
· FORTIS Construction Inc.
Frequently Asked Questions (FAQ) :
Q1. What are the driving factors for the Data Center Construction market?
Q2. What are the restraining factors for the Data Center Construction market?
Q3. Which Segments are covered in the Data Center Construction market report?
Q4. Which segment is projected to hold the largest share in the Data Center Construction Market. ?
Q5. Which are the prominent players in the Data Center Construction Market?
1. Introduction
- 1.1. Research Scope
- 1.2. Market Segmentation
- 1.3. Research Methodology
- 1.4. Definitions and Assumptions
2. Executive Summary
3. Market Dynamics
- 3.1. Market Drivers
- 3.2. Market Restraints
- 3.3. Market Opportunities
4. Key Insights
- 4.1. Key Emerging Trends – For Major Countries
- 4.2. Latest Technological Advancement
- 4.3. Regulatory Landscape
- 4.4. Industry SWOT Analysis
- 4.5. Porters Five Forces Analysis
5. Global Data Center Construction Market Analysis (USD Billion), Insights and Forecast, 2020-2027
- 5.1. Key Findings / Summary
- 5.2. Market Analysis, Insights and Forecast – By IT Infrastructure
- 5.2.1. Networking Equipment
- 5.2.2. Server
- 5.2.3. Storage
- 5.3. Market Analysis, Insights and Forecast – By Power Distribution & Cooling Infrastructure
- 5.3.1. Power Distribution
- 5.3.2. Cooling
- 5.4. Market Analysis, Insights and Forecast – By Tier Type
- 5.4.1. Tier 1
- 5.4.2. Tier 2
- 5.4.3. Tier 3
- 5.5. Market Analysis, Insights and Forecast – By End-use
- 5.5.1. IT & Telecom
- 5.5.2. BFSI
- 5.5.3. Government & Defense
- 5.5.4. Healthcare
- 5.5.5. Energy
- 5.5.6. Others
- 5.6. Market Analysis, Insights and Forecast – By Region
- 5.6.1. North America
- 5.6.2. Europe
- 5.6.3. Asia Pacific
- 5.6.4. Latin America, Middle East and Africa
6. North America Data Center Construction Market Analysis (USD Billion), Insights and Forecast, 2020-2027
- 6.1. Key Findings / Summary
- 6.2. Market Analysis, Insights and Forecast – By IT Infrastructure
- 6.2.1. Networking Equipment
- 6.2.2. Server
- 6.2.3. Storage
- 6.3. Market Analysis, Insights and Forecast – By Power Distribution & Cooling Infrastructure
- 6.3.1. Power Distribution
- 6.3.2. Cooling
- 6.4. Market Analysis, Insights and Forecast – By Tier Type
- 6.4.1. Tier 1
- 6.4.2. Tier 2
- 6.4.3. Tier 3
- 6.5. Market Analysis, Insights and Forecast – By End-use
- 6.5.1. IT & Telecom
- 6.5.2. BFSI
- 6.5.3. Government & Defense
- 6.5.4. Healthcare
- 6.5.5. Energy
- 6.5.6. Others
- 6.6. Market Analysis, Insights and Forecast – By Country
- 6.6.1. U.S.
- 6.6.2. Canada
7. Europe Data Center Construction Market Analysis (USD Billion), Insights and Forecast, 2020-2027
- 7.1. Key Findings / Summary
- 7.2. Market Analysis, Insights and Forecast – By IT Infrastructure
- 7.2.1. Networking Equipment
- 7.2.2. Server
- 7.2.3. Storage
- 7.3. Market Analysis, Insights and Forecast – By Power Distribution & Cooling Infrastructure
- 7.3.1. Power Distribution
- 7.3.2. Cooling
- 7.4. Market Analysis, Insights and Forecast – By Tier Type
- 7.4.1. Tier 1
- 7.4.2. Tier 2
- 7.4.3. Tier 3
- 7.5. Market Analysis, Insights and Forecast – By End-use
- 7.5.1. IT & Telecom
- 7.5.2. BFSI
- 7.5.3. Government & Defense
- 7.5.4. Healthcare
- 7.5.5. Energy
- 7.5.6. Others
- 7.6. Market Analysis, Insights and Forecast – By Country
- 7.6.1. UK
- 7.6.2. Germany
- 7.6.3. France
- 7.6.4. Italy
- 7.6.5. Spain
- 7.6.6. Russia
- 7.6.7. Rest of Europe
8. Asia Pacific Data Center Construction Market Analysis (USD Billion), Insights and Forecast, 2020-2027
- 8.1. Key Findings / Summary
- 8.2. Market Analysis, Insights and Forecast – By IT Infrastructure
- 8.2.1. Networking Equipment
- 8.2.2. Server
- 8.2.3. Storage
- 8.3. Market Analysis, Insights and Forecast – By Power Distribution & Cooling Infrastructure
- 8.3.1. Power Distribution
- 8.3.2. Cooling
- 8.4. Market Analysis, Insights and Forecast – By Tier Type
- 8.4.1. Tier 1
- 8.4.2. Tier 2
- 8.4.3. Tier 3
- 8.5. Market Analysis, Insights and Forecast – By End-use
- 8.5.1. IT & Telecom
- 8.5.2. BFSI
- 8.5.3. Government & Defense
- 8.5.4. Healthcare
- 8.5.5. Energy
- 8.5.6. Others
- 8.6. Market Analysis, Insights and Forecast – By Country
- 8.6.1. China
- 8.6.2. India
- 8.6.3. Japan
- 8.6.4. Australia
- 8.6.5. South East Asia
- 8.6.6. Rest of Asia Pacific
9. Latin America, Middle East and Africa Data Center Construction Market Analysis (USD Billion), Insights and Forecast, 2020-2027
- 9.1. Key Findings / Summary
- 9.2. Market Analysis, Insights and Forecast – By IT Infrastructure
- 9.2.1. Networking Equipment
- 9.2.2. Server
- 9.2.3. Storage
- 9.3. Market Analysis, Insights and Forecast – By Power Distribution & Cooling Infrastructure
- 9.3.1. Power Distribution
- 9.3.2. Cooling
- 9.4. Market Analysis, Insights and Forecast – By Tier Type
- 9.4.1. Tier 1
- 9.4.2. Tier 2
- 9.4.3. Tier 3
- 9.5. Market Analysis, Insights and Forecast – By End-use
- 9.5.1. IT & Telecom
- 9.5.2. BFSI
- 9.5.3. Government & Defense
- 9.5.4. Healthcare
- 9.5.5. Energy
- 9.5.6. Others
- 9.6. Market Analysis, Insights and Forecast – By Country
- 9.6.1. Brazil
- 9.6.2. Saudi Arabia
- 9.6.3. UAE
- 9.6.4. Rest of LAMEA
10. Competitive Analysis
- 10.1. Company Market Share Analysis, 2018
- 10.2. Key Industry Developments
- 10.3. Company Profile
- 10.4. Corgan Associates, Inc.
- 10.4.1. Business Overview
- 10.4.2. Segment 1 & Service Offering
- 10.4.3. Overall Revenue
- 10.4.4. Geographic Presence
- 10.4.5. Recent Development
- 10.5. Holder Construction
- 10.6. Turner Construction
- 10.7. DPR Construction
- 10.8. Structure Tone
- 10.9. Mortenson Construction
- 10.10. Gilbane Inc.
- 10.11. Balfour Beatty US
- 10.12. Hensel Phelps
- 10.13. Hoffman Construction
- 10.14. HITT Contracting
- 10.15. Fluor Corporation
- 10.16. IMC Construction
- 10.17. Pepper Construction
Data Library Research are conducted by industry experts who offer insight on industry structure, market segmentations technology assessment and competitive landscape (CL), and penetration, as well as on emerging trends. Their analysis is based on primary interviews (~ 80%) and secondary research (~ 20%) as well as years of professional expertise in their respective industries. Adding to this, by analysing historical trends and current market positions, our analysts predict where the market will be headed for the next five years. Furthermore, the varying trends of segment & categories geographically presented are also studied and the estimated based on the primary & secondary research.
In this particular report from the supply side Data Library Research has conducted primary surveys (interviews) with the key level executives (VP, CEO’s, Marketing Director, Business Development Manager and SOFT) of the companies that active & prominent as well as the midsized organization
FIGURE 1: DLR RESEARH PROCESS

Extensive primary research was conducted to gain a deeper insight of the market and industry performance. The analysis is based on both primary and secondary research as well as years of professional expertise in the respective industries.
In addition to analysing current and historical trends, our analysts predict where the market is headed over the next five years.
It varies by segment for these categories geographically presented in the list of market tables. Speaking about this particular report we have conducted primary surveys (interviews) with the key level executives (VP, CEO’s, Marketing Director, Business Development Manager and many more) of the major players active in the market.
Secondary ResearchSecondary research was mainly used to collect and identify information useful for the extensive, technical, market-oriented, and Friend’s study of the Global Extra Neutral Alcohol. It was also used to obtain key information about major players, market classification and segmentation according to the industry trends, geographical markets, and developments related to the market and technology perspectives. For this study, analysts have gathered information from various credible sources, such as annual reports, sec filings, journals, white papers, SOFT presentations, and company web sites.
Market Size EstimationBoth, top-down and bottom-up approaches were used to estimate and validate the size of the Global market and to estimate the size of various other dependent submarkets in the overall Extra Neutral Alcohol. The key players in the market were identified through secondary research and their market contributions in the respective geographies were determined through primary and secondary research.
Forecast Model
