Global High Energy Biscuits Market Opportunities and Forecast 2023-2030

  •   DLR434
  •   July, 2022
  •   Pages: 120
  •  Global
High Energy Biscuits Market Overview

In recent times, healthy biscuits are in large demand owing to the occurrence of health-related consciousness amongst people globally. The global High Energy Biscuits market is anticipated to grow at a considerable rate in the forthcoming years. 
 
High Energy Biscuits (HEB) are biscuits high in energy and protein and supplemented with a premix of vitamins and minerals. HEB is intended for general food distribution, school feeding, and use in emergencies. Because of their high energy-to-weight ratio, they are procured by the World Food Programme, the food aid branch of the United Nations, for feeding disaster victims worldwide. This ready-to-eat food is used to cover urgent needs in the acute phase of an emergency during which the population is not able to cook due to a lack of access to basic facilities such as clean water, cooking equipment, etc. Their use is also extended to a complement food ration to provide vitamins and minerals in regions/populations where diet is subject to nutritional deficiencies. HEB can also be used to prevent micronutrient deficiency in young and school-age children.  These are some crucial factors related to the High Energy Biscuits, which are contributing more to the market development progressively.

Report Metric Details
Market size available for years 2023–2030
Base year considered 2023
Forecast period 2024–2030
Forecast unit Value (USD Million)
Segments covered Product, Distribution Channel, and Region
Regions covered North America (the U.S. and Canada), Europe (UK, Germany, France, Italy, Spain, Russia, Rest of Europe), Asia-Pacific (China, India, Japan, Australia, South East Asia, Rest of Asia Pacific), Latin America and the Middle East and Africa (Brazil, Saudi Arabia, UAE, Rest of LAMEA)
Companies covered Kraft Foods, Mars Incorporated, Nestle, Danone Group, Britannia Industries, Lotus Bakeries

Covid-19 Impact on High Energy Biscuits Market

A pandemic such as COVID-19 has not only affected the smooth operations of food supply chains but also resulted in food insecurity conditions in several nations. Manufacturers working in the sector are facing challenges in regards to operations, supply chain, training, safety, emergency responses, awareness, incident management, recreating business models, digitalization, and other unanticipated impacts. Alcohol, a major component in the beverage industry is facing a devastating effect of a pandemic. Around 13% to 15% of the craft beer sector in the world is in the process of shutting up shop, and the wine industry is in severe distress. Besides, shortage of raw materials caused to shut down of many small to medium food processing companies around the world

High Energy Biscuits Market Segment Overview


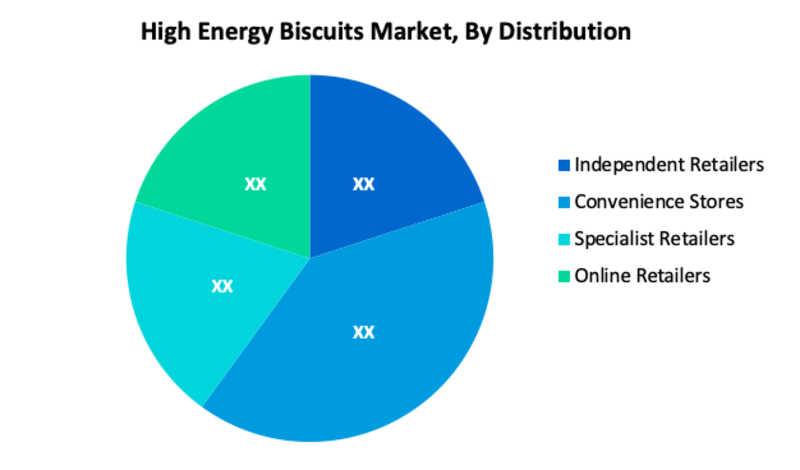
According to Distribution Channel, Convenience Stores is the largest segment in the global High Energy Biscuits market. A convenience store is a small retail business that stocks a range of everyday items such as coffee, groceries, snack foods, confectionery, soft drinks, over-the-counter drugs, toiletries, newspapers, and magazines.

Furthermore, other major aspects such as people are consuming junk food more owing to the changing lifestyle, maintaining a healthy diet and lose weight, and growing awareness about health are major aspects that continuously support the growth of the global High Energy Biscuits market. Moreover, the high nutritional value is benefiting the consumers to maintain a healthy life and have a regulative digestive system. This key reason further raising the demand for High Energy Biscuits, eventually, boosts the growth market.
 
High Energy Biscuits Market, By Product
·       450~1000 kilocalories per 100 grams
·       Above 1000 kilocalories per 100 grams
 
High Energy Biscuits Market, By Distribution Channel
·       Independent Retailers
·       Convenience Stores
·       Specialist Retailers
·       Online Retailers

High Energy Biscuits Market Regional Overview

In terms of geography, the High Energy Biscuits is popular in all countries over the world. Regions like North America, Europe, Asia- Pacific, Latin America, Middle East, and Africa have a large demand for High Energy Biscuits amongst consumers. The Asia Pacific and the Middle East and Africa and Latin America are getting aware of the consumption of these healthy biscuits and learning to maintain a healthy lifestyle. Likewise, North America and Europe region also showing strong preference towards the High Energy Biscuits, which in turn, is propelling the growth of the market in these regions.
 
High Energy Biscuits Market, By Geography
 
·       North America (US & Canada)
·       Europe (UK, Germany, France, Italy, Spain, Russia & Rest of Europe)
·       Asia-Pacific (Japan, China, India, Australia, & South Korea, & Rest of Asia-Pacific)
·       LAMEA (Brazil, Saudi Arabia, UAE & Rest of LAMEA)
 
High Energy Biscuits Market, Key Players

·       Kraft Foods
·       Mars, Incorporated
·       Nestle
·       Danone Group
·       Britannia Industries
·       Lotus Bakeries

Frequently Asked Questions (FAQ) :

Q1. Which segment is projected to hold the largest share in the High Energy Biscuits Market. ?

The Convenience Stores segment is projected to hold the largest share in the High Energy Biscuits Market.

Q2. What are the driving factors for the High Energy Biscuits market?

High Energy Biscuits are intended for general food distribution, school feeding, and use in emergencies, these are significant factors that boost the growth of the High Energy Biscuits market.

Q3. Which Segments are covered in the High Energy Biscuits market report?

Product, Distribution Channel, and Region, these segments are covered in the High Energy Biscuits market report.

Q4. Which are sub-segments of the Product segment in the High Energy Biscuits market?

The 450~1000 kilocalories per 100 grams and the Above 1000 kilocalories per 100 grams are two sub-segments of the Product segment in the High Energy Biscuits market.

Q5. Which are the prominent players offering High Energy Biscuits?

Kraft Foods, Mars Incorporated, Nestle, Danone Group, Britannia Industries, Lotus Bakeries are some of the key players offering High Energy Biscuits.
High Energy Biscuits Market Study Global Market Analysis, Insights and Forecast, 2020-2027

    1. Introduction

    • 1.1. Research Scope
    • 1.2. Market Segmentation
    • 1.3. Research Methodology
    • 1.4. Definitions and Assumptions

    2. Executive Summary

      3. Market Dynamics

      • 3.1. Market Drivers
      • 3.2. Market Restraints
      • 3.3. Market Opportunities

      4. Key Insights

      • 4.1. Key Emerging Trends – For Major Countries
      • 4.2. Latest Technological Advancement
      • 4.3. Regulatory Landscape
      • 4.4. Industry SWOT Analysis
      • 4.5. Porters Five Forces Analysis

      5. Global High Energy Biscuits Market Analysis (USD Billion), Insights and Forecast, 2020-2027

      • 5.1. Key Findings / Summary
      • 5.2. Market Analysis, Insights and Forecast – By Product
        • 5.2.1. 450~1000 kilocalories per 100 grams
        • 5.2.2. Above 1000 kilocalories per 100 grams
      • 5.3. Market Analysis, Insights and Forecast – By Distribution Channel
        • 5.3.1. Independent Retailers
        • 5.3.2. Convenience Stores
        • 5.3.3. Specialist Retailers
        • 5.3.4. Online Retailers
      • 5.4. Market Analysis, Insights and Forecast – By Region
        • 5.4.1. North America
        • 5.4.2. Europe
        • 5.4.3. Asia Pacific
        • 5.4.4. Latin America, Middle East and Africa

      6. North America High Energy Biscuits Market Analysis (USD Billion), Insights and Forecast, 2020-2027

      • 6.1. Key Findings / Summary
      • 6.2. Market Analysis, Insights and Forecast – By Product
        • 6.2.1. 450~1000 kilocalories per 100 grams
        • 6.2.2. Above 1000 kilocalories per 100 grams
      • 6.3. Market Analysis, Insights and Forecast – By Distribution Channel
        • 6.3.1. Independent Retailers
        • 6.3.2. Convenience Stores
        • 6.3.3. Specialist Retailers
        • 6.3.4. Online Retailers
      • 6.4. Market Analysis, Insights and Forecast – By Country
        • 6.4.1. U.S.
        • 6.4.2. Canada

      7. Europe High Energy Biscuits Market Analysis (USD Billion), Insights and Forecast, 2020-2027

      • 7.1. Key Findings / Summary
      • 7.2. Market Analysis, Insights and Forecast – By Product
        • 7.2.1. 450~1000 kilocalories per 100 grams
        • 7.2.2. Above 1000 kilocalories per 100 grams
      • 7.3. Market Analysis, Insights and Forecast – By Distribution Channel
        • 7.3.1. Independent Retailers
        • 7.3.2. Convenience Stores
        • 7.3.3. Specialist Retailers
        • 7.3.4. Online Retailers
      • 7.4. Market Analysis, Insights and Forecast – By Country
        • 7.4.1. UK
        • 7.4.2. Germany
        • 7.4.3. France
        • 7.4.4. Italy
        • 7.4.5. Spain
        • 7.4.6. Russia
        • 7.4.7. Rest of Europe

      8. Asia Pacific High Energy Biscuits Market Analysis (USD Billion), Insights and Forecast, 2020-2027

      • 8.1. Key Findings / Summary
      • 8.2. Market Analysis, Insights and Forecast – By Product
        • 8.2.1. 450~1000 kilocalories per 100 grams
        • 8.2.2. Above 1000 kilocalories per 100 grams
      • 8.3. Market Analysis, Insights and Forecast – By Distribution Channel
        • 8.3.1. Independent Retailers
        • 8.3.2. Convenience Stores
        • 8.3.3. Specialist Retailers
        • 8.3.4. Online Retailers
      • 8.4. Market Analysis, Insights and Forecast – By Country
        • 8.4.1. China
        • 8.4.2. India
        • 8.4.3. Japan
        • 8.4.4. Australia
        • 8.4.5. South East Asia
        • 8.4.6. Rest of Asia Pacific

      9. Latin America, Middle East and Africa High Energy Biscuits Market Analysis (USD Billion), Insights and Forecast, 2020-2027

      • 9.1. Key Findings / Summary
      • 9.2. Market Analysis, Insights and Forecast – By Product
        • 9.2.1. 450~1000 kilocalories per 100 grams
        • 9.2.2. Above 1000 kilocalories per 100 grams
      • 9.3. Market Analysis, Insights and Forecast – By Distribution Channel
        • 9.3.1. Independent Retailers
        • 9.3.2. Convenience Stores
        • 9.3.3. Specialist Retailers
        • 9.3.4. Online Retailers
      • 9.4. Market Analysis, Insights and Forecast – By Country
        • 9.4.1. Brazil
        • 9.4.2. Saudi Arabia
        • 9.4.3. UAE
        • 9.4.4. Rest of LAMEA

      10. Competitive Analysis

      • 10.1. Company Market Share Analysis, 2018
      • 10.2. Key Industry Developments
      • 10.3. Company Profile
      • 10.4. Kraft Foods
        • 10.4.1. Business Overview
        • 10.4.2. Segment 1 & Service Offering
        • 10.4.3. Overall Revenue
        • 10.4.4. Geographic Presence
        • 10.4.5. Recent Development
      *Similar details will be provided for the following companies
      • 10.5. Mars, Incorporated
      • 10.6. Nestle
      • 10.7. Danone Group
      • 10.8. Britannia Industries
      List of Figures

      Figure 1: Global High Energy Biscuits Market Revenue Breakdown (USD Billion, %) by Region, 2019 & 2027
      Figure 2: Global Market Value Share (%), By Segment 1, 2019 & 2027
      Figure 3: Global Market Forecast (USD Billion), by Sub-Segment 1, 2016-2027
      Figure 4: Global Market Forecast (USD Billion), by Sub-Segment 2, 2016-2027
      Figure 5: Global Market Value Share (%), By Segment 2, 2019 & 2027
      Figure 6: Global Market Forecast (USD Billion), by Sub-Segment 1, 2016-2027
      Figure 7: Global Market Forecast (USD Billion), by Sub-Segment 2, 2016-2027
      Figure 8: Global Market Forecast (USD Billion), by Sub-Segment 3, 2016-2027
      Figure 9: Global High Energy Biscuits Market Forecast (USD Billion), by Others, 2016-2027
      Figure 10: Global Market Value Share (%), By Segment 3, 2019 & 2027
      Figure 11: Global Market Forecast (USD Billion), by Sub-Segment 1, 2016-2027
      Figure 12: Global Market Forecast (USD Billion), by Sub-Segment 2, 2016-2027
      Figure 13: Global Market Forecast (USD Billion), by Sub-Segment 3, 2016-2027
      Figure 14: Global Market Forecast (USD Billion), by Others, 2016-2027
      Figure 15: Global Market Value (USD Billion), by Region, 2019 & 2027
      Figure 16: North America High Energy Biscuits Market Value Share (%), By Segment 1, 2019 & 2027
      Figure 17: North America Market Forecast (USD Billion), by Sub-Segment 1, 2016-2027
      Figure 18: North America Market Forecast (USD Billion), by Sub-Segment 2, 2016-2027
      Figure 19: North America Market Value Share (%), By Segment 2, 2019 & 2027
      Figure 20: North America Market Forecast (USD Billion), by Sub-Segment 1, 2016-2027
      Figure 21: North America Market Forecast (USD Billion), by Sub-Segment 2, 2016-2027
      Figure 22: North America Market Forecast (USD Billion), by Sub-Segment 3, 2016-2027
      Figure 23: North America Market Forecast (USD Billion), by Others, 2016-2027
      Figure 24: North America Market Value Share (%), By Segment 3, 2019 & 2027
      Figure 25: North America Market Forecast (USD Billion), by Sub-Segment 1, 2016-2027
      Figure 26: North America Market Forecast (USD Billion), by Sub-Segment 2, 2016-2027
      Figure 27: North America Market Forecast (USD Billion), by Sub-Segment 3, 2016-2027
      Figure 28: North America Market Forecast (USD Billion), by Others, 2016-2027
      Figure 29: North America Market Forecast (USD Billion), by U.S., 2016-2027
      Figure 30: North America Market Forecast (USD Billion), by Canada, 2016-2027
      Figure 31: Latin America High Energy Biscuits Market Value Share (%), By Segment 1, 2019 & 2027
      Figure 32: Latin America Market Forecast (USD Billion), by Sub-Segment 1, 2016-2027
      Figure 33: Latin America Market Forecast (USD Billion), by Sub-Segment 2, 2016-2027
      Figure 34: Latin America Market Value Share (%), By Segment 2, 2019 & 2027
      Figure 35: Latin America Market Forecast (USD Billion), by Sub-Segment 1, 2016-2027
      Figure 36: Latin America Market Forecast (USD Billion), by Sub-Segment 2, 2016-2027
      Figure 37: Latin America Market Forecast (USD Billion), by Sub-Segment 3, 2016-2027
      Figure 38: Latin America Market Forecast (USD Billion), by Others, 2016-2027
      Figure 39: Latin America Market Value Share (%), By Segment 3, 2019 & 2027
      Figure 40: Latin America Market Forecast (USD Billion), by Sub-Segment 1, 2016-2027
      Figure 41: Latin America Market Forecast (USD Billion), by Sub-Segment 2, 2016-2027
      Figure 42: Latin America Market Forecast (USD Billion), by Sub-Segment 3, 2016-2027
      Figure 43: Latin America Market Forecast (USD Billion), by Others, 2016-2027
      Figure 44: Latin America Market Forecast (USD Billion), by Brazil, 2016-2027
      Figure 45: Latin America Market Forecast (USD Billion), by Mexico, 2016-2027
      Figure 46: Latin America Market Forecast (USD Billion), by Rest of Latin America, 2016-2027
      Figure 47: Europe High Energy Biscuits Market Value Share (%), By Segment 1, 2019 & 2027
      Figure 48: Europe Market Forecast (USD Billion), by Sub-Segment 1, 2016-2027
      Figure 49: Europe Market Forecast (USD Billion), by Sub-Segment 2, 2016-2027
      Figure 50: Europe Market Value Share (%), By Segment 2, 2019 & 2027
      Figure 51: Europe Market Forecast (USD Billion), by Sub-Segment 1, 2016-2027
      Figure 52: Europe Market Forecast (USD Billion), by Sub-Segment 2, 2016-2027
      Figure 53: Europe Market Forecast (USD Billion), by Sub-Segment 3, 2016-2027
      Figure 54: Europe Market Forecast (USD Billion), by Others, 2016-2027
      Figure 55: Europe Market Value Share (%), By Segment 3, 2019 & 2027
      Figure 56: Europe Market Forecast (USD Billion), by Sub-Segment 1, 2016-2027
      Figure 57: Europe Market Forecast (USD Billion), by Sub-Segment 2, 2016-2027
      Figure 58: Europe Market Forecast (USD Billion), by Sub-Segment 3, 2016-2027
      Figure 59: Europe Market Forecast (USD Billion), by Others, 2016-2027
      Figure 60: Europe Market Forecast (USD Billion), by U.K., 2016-2027
      Figure 61: Europe Market Forecast (USD Billion), by Germany, 2016-2027
      Figure 62: Europe Market Forecast (USD Billion), by France, 2016-2027
      Figure 63: Europe Market Forecast (USD Billion), by Italy, 2016-2027
      Figure 64: Europe Market Forecast (USD Billion), by Spain, 2016-2027
      Figure 65: Europe Market Forecast (USD Billion), by Russia, 2016-2027
      Figure 66: Europe Market Forecast (USD Billion), by Rest of Europe, 2016-2027
      Figure 67: Asia Pacific High Energy Biscuits Market Value Share (%), By Segment 1, 2019 & 2027
      Figure 68: Asia Pacific Market Forecast (USD Billion), by Sub-Segment 1, 2016-2027
      Figure 69: Asia Pacific Market Forecast (USD Billion), by Sub-Segment 2, 2016-2027
      Figure 70: Asia Pacific Market Value Share (%), By Segment 2, 2019 & 2027
      Figure 71: Asia Pacific Market Forecast (USD Billion), by Sub-Segment 1, 2016-2027
      Figure 72: Asia Pacific Market Forecast (USD Billion), by Sub-Segment 2, 2016-2027
      Figure 73: Asia Pacific Market Forecast (USD Billion), by Sub-Segment 3, 2016-2027
      Figure 74: Asia Pacific Market Forecast (USD Billion), by Others, 2016-2027
      Figure 75: Asia Pacific Market Value Share (%), By Segment 3, 2019 & 2027
      Figure 76: Asia Pacific Market Forecast (USD Billion), by Sub-Segment 1, 2016-2027
      Figure 77: Asia Pacific Market Forecast (USD Billion), by Sub-Segment 2, 2016-2027
      Figure 78: Asia Pacific Market Forecast (USD Billion), by Sub-Segment 3, 2016-2027
      Figure 79: Asia Pacific Market Forecast (USD Billion), by Others, 2016-2027
      Figure 80: Asia Pacific Market Forecast (USD Billion), by China, 2016-2027
      Figure 81: Asia Pacific Market Forecast (USD Billion), by India, 2016-2027
      Figure 82: Asia Pacific Market Forecast (USD Billion), by Japan, 2016-2027
      Figure 83: Asia Pacific Market Forecast (USD Billion), by Australia, 2016-2027
      Figure 84: Asia Pacific Market Forecast (USD Billion), by Southeast Asia, 2016-2027
      Figure 85: Asia Pacific Market Forecast (USD Billion), by Rest of Asia Pacific, 2016-2027
      Figure 86: Middle East & Africa High Energy Biscuits Market Value Share (%), By Segment 1, 2019 & 2027
      Figure 87: Middle East & Africa Market Forecast (USD Billion), by Sub-Segment 1, 2016-2027
      Figure 88: Middle East & Africa Market Forecast (USD Billion), by Sub-Segment 2, 2016-2027
      Figure 89: Middle East & Africa Market Value Share (%), By Segment 2, 2019 & 2027
      Figure 90: Middle East & Africa Market Forecast (USD Billion), by Sub-Segment 1, 2016-2027
      Figure 91: Middle East & Africa Market Forecast (USD Billion), by Sub-Segment 2, 2016-2027
      Figure 92: Middle East & Africa Market Forecast (USD Billion), by Sub-Segment 3, 2016-2027
      Figure 93: Middle East & Africa Market Forecast (USD Billion), by Others, 2016-2027
      Figure 94: Middle East & Africa Market Value Share (%), By Segment 3, 2019 & 2027
      Figure 95: Middle East & Africa Market Forecast (USD Billion), by Sub-Segment 1, 2016-2027
      Figure 96: Middle East & Africa Market Forecast (USD Billion), by Sub-Segment 2, 2016-2027
      Figure 97: Middle East & Africa Market Forecast (USD Billion), by Sub-Segment 3, 2016-2027
      Figure 98: Middle East & Africa Market Forecast (USD Billion), by Others, 2016-2027
      Figure 99: Middle East & Africa Market Forecast (USD Billion), by GCC, 2016-2027
      Figure 100: Middle East & Africa Market Forecast (USD Billion), by South Africa, 2016-2027
      Figure 101: Middle East & Africa Market Forecast (USD Billion), by Rest of Middle East & Africa, 2016-2027 
      List of Tables
      Table 1: Global High Energy Biscuits Market Revenue (USD Billion) Forecast, by Segment 1, 2016-2027
      Table 2: Global Market Revenue (USD Billion) Forecast, by Segment 2, 2016-2027
      Table 3: Global Market Revenue (USD Billion) Forecast, by Segment 3, 2016-2027
      Table 4: Global Market Revenue (USD Billion) Forecast, by Region, 2016-2027
      Table 5: North America High Energy Biscuits Market Revenue (USD Billion) Forecast, by Segment 1, 2016-2027
      Table 6: North America Market Revenue (USD Billion) Forecast, by Segment 2, 2016-2027
      Table 7: North America Market Revenue (USD Billion) Forecast, by Segment 3, 2016-2027
      Table 8: North America Market Revenue (USD Billion) Forecast, by Country, 2016-2027
      Table 9: Europe High Energy Biscuits Market Revenue (USD Billion) Forecast, by Segment 1, 2016-2027
      Table 10: Europe Market Revenue (USD Billion) Forecast, by Segment 2, 2016-2027
      Table 11: Europe Market Revenue (USD Billion) Forecast, by Segment 3, 2016-2027
      Table 12: Europe Market Revenue (USD Billion) Forecast, by Country, 2016-2027
      Table 13: Latin America High Energy Biscuits Market Revenue (USD Billion) Forecast, by Segment 1, 2016-2027
      Table 14: Latin America Market Revenue (USD Billion) Forecast, by Segment 2, 2016-2027
      Table 15: Latin America Market Revenue (USD Billion) Forecast, by Segment 3, 2016-2027
      Table 16: Latin America Market Revenue (USD Billion) Forecast, by Country, 2016-2027
      Table 17: Asia Pacific High Energy Biscuits Market Revenue (USD Billion) Forecast, by Segment 1, 2016-2027
      Table 18: Asia Pacific Market Revenue (USD Billion) Forecast, by Segment 2, 2016-2027
      Table 19: Asia Pacific Market Revenue (USD Billion) Forecast, by Segment 3, 2016-2027
      Table 20: Asia Pacific Market Revenue (USD Billion) Forecast, by Country, 2016-2027
      Table 21: Middle East & Africa High Energy Biscuits Market Revenue (USD Billion) Forecast, by Segment 1, 2016-2027
      Table 22: Middle East & Africa Market Revenue (USD Billion) Forecast, by Segment 2, 2016-2027
      Table 23: Middle East & Africa Market Revenue (USD Billion) Forecast, by Segment 3, 2016-2027
      Table 24: Middle East & Africa Market Revenue (USD Billion) Forecast, by Country, 2016-2027
      Research Process

      Data Library Research are conducted by industry experts who offer insight on industry structure, market segmentations technology assessment and competitive landscape (CL), and penetration, as well as on emerging trends. Their analysis is based on primary interviews (~ 80%) and secondary research (~ 20%) as well as years of professional expertise in their respective industries. Adding to this, by analysing historical trends and current market positions, our analysts predict where the market will be headed for the next five years. Furthermore, the varying trends of segment & categories geographically presented are also studied and the estimated based on the primary & secondary research.

      In this particular report from the supply side Data Library Research has conducted primary surveys (interviews) with the key level executives (VP, CEO’s, Marketing Director, Business Development Manager and SOFT) of the companies that active & prominent as well as the midsized organization

      FIGURE 1: DLR RESEARH PROCESS

      research-methodology1

      Primary Research

      Extensive primary research was conducted to gain a deeper insight of the market and industry performance. The analysis is based on both primary and secondary research as well as years of professional expertise in the respective industries.

      In addition to analysing current and historical trends, our analysts predict where the market is headed over the next five years.

      It varies by segment for these categories geographically presented in the list of market tables. Speaking about this particular report we have conducted primary surveys (interviews) with the key level executives (VP, CEO’s, Marketing Director, Business Development Manager and many more) of the major players active in the market.

      Secondary Research

      Secondary research was mainly used to collect and identify information useful for the extensive, technical, market-oriented, and Friend’s study of the Global Extra Neutral Alcohol. It was also used to obtain key information about major players, market classification and segmentation according to the industry trends, geographical markets, and developments related to the market and technology perspectives. For this study, analysts have gathered information from various credible sources, such as annual reports, sec filings, journals, white papers, SOFT presentations, and company web sites.

      Market Size Estimation

      Both, top-down and bottom-up approaches were used to estimate and validate the size of the Global market and to estimate the size of various other dependent submarkets in the overall Extra Neutral Alcohol. The key players in the market were identified through secondary research and their market contributions in the respective geographies were determined through primary and secondary research.

      Forecast Model

      research-methodology2