Global Hydrogen and Fuel Cells Market Opportunities and Forecast 2023-2030

  •   DLR426
  •   July, 2022
  •   Pages: 120
  •  Global
Hydrogen Fuel Cells Market Overview

The global Hydrogen Fuel Cells market has been expanding at a stellar pace in recent times due to the infrastructural developments in the field of hydrogen production. The growing adoption of electric and hybrid vehicles has also increased the demand for hydrogen fuel cells, worldwide, reflecting positively on the growth of the global Hydrogen Fuel Cells market.

Furthermore, an increase in the number of funding from the government and other organizations for the development and commercialization of the refueling infrastructure, globally, is anticipated to intensifies the growth of the global hydrogen fuel cells market over the forthcoming years. In addition to this, governments particularly in developed countries have encouraged the use of clean and green energy, this key fact further supports market development.  Again, the rising concern about environmental pollution across the globe is another factor enhancing the demand for hydrogen fuel cells. Thus, the awareness level concerning hydrogen cells has increased, which helping to boost the growth of the global Hydrogen Fuel Cells market steadily.   
                    
On the contrary, a lack of infrastructure for fuel cells, the high cost of switching the technology, and reduced hydrogen refilling stations, and the high initial cost related to the adoption of this technology, are some factors that restrict the growth of the global Hydrogen Fuel Cells market.

Report Metric Details
Market size available for years 2023–2030
Base year considered 2023
Forecast period 2024–2030
Forecast unit Value (USD Million)
Segments covered Type, Application, and Region
Regions covered North America (the U.S. and Canada), Europe (UK, Germany, France, Italy, Spain, Russia, Rest of Europe), Asia-Pacific (China, India, Japan, Australia, South East Asia, Rest of Asia Pacific), Latin America and the Middle East and Africa (Brazil, Saudi Arabia, UAE, Rest of LAMEA)
Companies covered SFC Energy AG, Plug Power Inc., Panasonic Corporation, AFC Energy PLC, Hydrogenics, Nedstack Fuel Cells Technology B.V., ClearEdge Power, and Toshiba Corporation.


Covid-19 Impact on Hydrogen Fuel Cells Market

As around one-third of the global population is staying indoors owing to nationwide lockdown, stay-at-home orders, and restrictions on movement, the energy demand has sharply dipped. By the end of 2020, approximately, a decline in 5% of the energy demand was been recorded. Also, waning in corresponding gas and oil demands of 4% and 9%, respectively were registered in 2020. Currently, the energy market is at a historic low with surplus supplies. However, the situation is expected to ease up with a lift in lockdown restrictions and end-use industries start operating with great efficiencies.

Hydrogen Fuel Cells Market Segment Overview


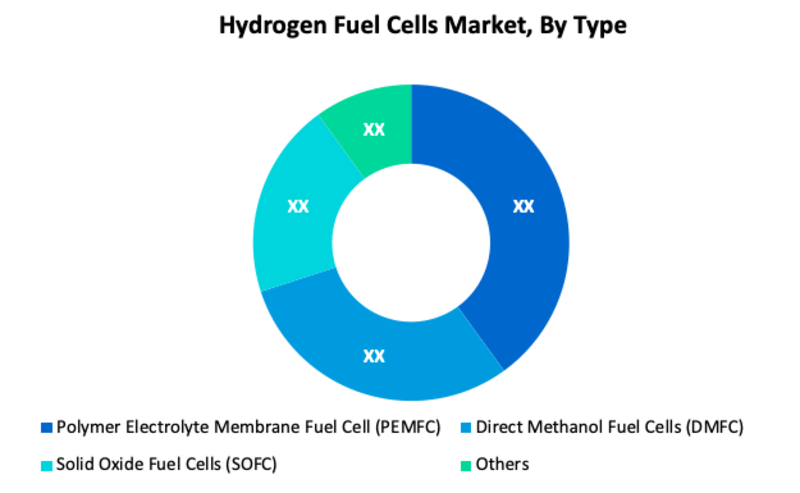
Based on the Type, the Polymer Electrolyte Membrane Fuel Cell (PEMFC) is the most prominent segment in the global Hydrogen Fuel Cells market.  Polymer electrolyte membrane fuel cells (PEMFC) are regarded as a viable fuel cell technology alternative with extensive applications, such as stationary power plants and portable power sources. Additionally, PEMFC technology is one of a portfolio of alternative methods for delivering energy that currently is under aggressive development by academic, governmental, and industrial organizations. Furthermore, the Direct Methanol Fuel Cells (DMFC) is another key segment in the market. Direct methanol fuel cell (DMFC) is considered as a promising power source for the next-generation portable electronics, owing to its characteristics such as a high energy density, green emission, convenient refueling of liquid fuel, and ambient operation conditions

Hydrogen Fuel Cells Market, By Type
·       Polymer Electrolyte Membrane Fuel Cell (PEMFC)
·       Direct Methanol Fuel Cells (DMFC)
·       Solid Oxide Fuel Cells (SOFC)
·       Others (Alkaline Fuel Cells, Phosphoric Acid Fuel Cells)
 
Hydrogen Fuel Cells Market, By Application
·       Portable
·       Stationary
·       Transport

Hydrogen Fuel Cells Market Regional Overview

In terms of region, North America is anticipated to lead the global Hydrogen Fuel Cells market over the forecast period. The growing awareness about the several benefits that it offers is boosting its demand in North America. Europe is another major region for the global Hydrogen Fuel Cells market.  Similarly, the market in the Asia Pacific is expected to expand at a significant CAGR in the coming years. The increasing use of hydrogen fuel cells in South Korea and Japan in hybrid cars and strict environmental rules are behind the growth of this market. In addition, subsidies on the purchase of hybrid vehicles are one of the crucial factors that propel the growth of the market in these regions.
 
Hydrogen Fuel Cells Market, By Geography
 
·       North America (US & Canada)
·       Europe (UK, Germany, France, Italy, Spain, Russia & Rest of Europe)
·       Asia-Pacific (Japan, China, India, Australia, & South Korea, & Rest of Asia-Pacific)
·       LAMEA (Brazil, Saudi Arabia, UAE & Rest of LAMEA)
 
Hydrogen Fuel Cells Market Competitor overview

Some key developments and strategies adopted by manufacturers in Hydrogen Fuel Cells are highlighted below.

·       In September  2021,  Bloom Energy announced the commercial availability of its Hydrogen Energy Servers — 100 percent hydrogen-powered fuel cells that deliver on-site, 24/7, zero-carbon electricity — all in a simple, modular, and flexible design.

·       In September 2021,  TECO 2030 has been granted up to 5.4m Norwegian kroner ($628,000) in indirect government support to develop its first semi-automated production line for hydrogen fuel cells at its new fuel cell factory and innovation center in northern Norway.

Hydrogen Fuel Cells Market, Key Players

·       SFC Energy AG
·       Plug Power Inc.
·       Panasonic Corporation
·       AFC Energy PLC
·       Hydrogenics
·       Nedstack Fuel Cells Technology B.V.
·       ClearEdge Power
·       Toshiba Corporation

Frequently Asked Questions (FAQ) :

Q1. What are the driving factors for the Hydrogen Fuel Cells market?

The infrastructural developments in the field of hydrogen production, the growing adoption of electric and hybrid vehicles, and encouragement of the use of clean and green energy are significant factors that boost the growth of the Hydrogen Fuel Cells market.

Q2. What are the restraining factors for the Hydrogen Fuel Cells market?

- A lack of infrastructure for fuel cells, high cost of switching the technology, and reduced hydrogen refilling stations, and the high initial cost related to the adoption of this technology, these are the major factor that restrains the growth of the global Hydrogen Fuel Cells market.

Q3. Which segment is projected to hold the largest share in the Hydrogen Fuel Cells Market?

The Polymer Electrolyte Membrane Fuel Cell (PEMFC) segment is projected to hold the largest share in the Hydrogen Fuel Cells Market.

Q4. Which Segments are covered in the Hydrogen Fuel Cells market report?

Type, Application, and Region, these segments are covered in the Hydrogen Fuel Cells market report.

Q5. Which are the prominent players offering Hydrogen Fuel Cells?

SFC Energy AG, Plug Power Inc., Panasonic Corporation, AFC Energy PLC, Hydrogenics, Nedstack Fuel Cells Technology B.V., ClearEdge Power, and Toshiba Corporation. are some of the key players offering Hydrogen Fuel Cells.
Hydrogen Fuel Cells Market Study Global Market Analysis, Insights and Forecast, 2020-2027

    1. Introduction

    • 1.1. Research Scope
    • 1.2. Market Segmentation
    • 1.3. Research Methodology
    • 1.4. Definitions and Assumptions

    2. Executive Summary

      3. Market Dynamics

      • 3.1. Market Drivers
      • 3.2. Market Restraints
      • 3.3. Market Opportunities

      4. Key Insights

      • 4.1. Key Emerging Trends – For Major Countries
      • 4.2. Latest Technological Advancement
      • 4.3. Regulatory Landscape
      • 4.4. Industry SWOT Analysis
      • 4.5. Porters Five Forces Analysis

      5. Global Hydrogen Fuel Cells Market Analysis (USD Billion), Insights and Forecast, 2020-2027

      • 5.1. Key Findings / Summary
      • 5.2. Market Analysis, Insights and Forecast – By Type
        • 5.2.1. Polymer Electrolyte Membrane Fuel Cell (PEMFC)
        • 5.2.2. Direct Methanol Fuel Cells (DMFC)
        • 5.2.3. Solid Oxide Fuel Cells (SOFC)
        • 5.2.4. Others (Alkaline Fuel Cells, Phosphoric Acid Fuel Cells)
      • 5.3. Market Analysis, Insights and Forecast – By Application
        • 5.3.1. Portable
        • 5.3.2. Stationary
        • 5.3.3. Transport
      • 5.4. Market Analysis, Insights and Forecast – By Region
        • 5.4.1. North America
        • 5.4.2. Europe
        • 5.4.3. Asia Pacific
        • 5.4.4. Latin America, Middle East and Africa

      6. North America Hydrogen Fuel Cells Market Analysis (USD Billion), Insights and Forecast, 2020-2027

      • 6.1. Key Findings / Summary
      • 6.2. Market Analysis, Insights and Forecast – By Type
        • 6.2.1. Polymer Electrolyte Membrane Fuel Cell (PEMFC)
        • 6.2.2. Direct Methanol Fuel Cells (DMFC)
        • 6.2.3. Solid Oxide Fuel Cells (SOFC)
        • 6.2.4. Others (Alkaline Fuel Cells, Phosphoric Acid Fuel Cells)
      • 6.3. Market Analysis, Insights and Forecast – By Application
        • 6.3.1. Portable
        • 6.3.2. Stationary
        • 6.3.3. Transport
      • 6.4. Market Analysis, Insights and Forecast – By Country
        • 6.4.1. U.S.
        • 6.4.2. Canada

      7. Europe Hydrogen Fuel Cells Market Analysis (USD Billion), Insights and Forecast, 2020-2027

      • 7.1. Key Findings / Summary
      • 7.2. Market Analysis, Insights and Forecast – By Type
        • 7.2.1. Polymer Electrolyte Membrane Fuel Cell (PEMFC)
        • 7.2.2. Direct Methanol Fuel Cells (DMFC)
        • 7.2.3. Solid Oxide Fuel Cells (SOFC)
        • 7.2.4. Others (Alkaline Fuel Cells, Phosphoric Acid Fuel Cells)
      • 7.3. Market Analysis, Insights and Forecast – By Application
        • 7.3.1. Portable
        • 7.3.2. Stationary
        • 7.3.3. Transport
      • 7.4. Market Analysis, Insights and Forecast – By Country
        • 7.4.1. UK
        • 7.4.2. Germany
        • 7.4.3. France
        • 7.4.4. Italy
        • 7.4.5. Spain
        • 7.4.6. Russia
        • 7.4.7. Rest of Europe

      8. Asia Pacific Hydrogen Fuel Cells Market Analysis (USD Billion), Insights and Forecast, 2020-2027

      • 8.1. Key Findings / Summary
      • 8.2. Market Analysis, Insights and Forecast – By Type
        • 8.2.1. Polymer Electrolyte Membrane Fuel Cell (PEMFC)
        • 8.2.2. Direct Methanol Fuel Cells (DMFC)
        • 8.2.3. Solid Oxide Fuel Cells (SOFC)
        • 8.2.4. Others (Alkaline Fuel Cells, Phosphoric Acid Fuel Cells)
      • 8.3. Market Analysis, Insights and Forecast – By Application
        • 8.3.1. Portable
        • 8.3.2. Stationary
        • 8.3.3. Transport
      • 8.4. Market Analysis, Insights and Forecast – By Country
        • 8.4.1. China
        • 8.4.2. India
        • 8.4.3. Japan
        • 8.4.4. Australia
        • 8.4.5. South East Asia
        • 8.4.6. Rest of Asia Pacific

      9. Latin America, Middle East and Africa Hydrogen Fuel Cells Market Analysis (USD Billion), Insights and Forecast, 2020-2027

      • 9.1. Key Findings / Summary
      • 9.2. Market Analysis, Insights and Forecast – By Type
        • 9.2.1. Polymer Electrolyte Membrane Fuel Cell (PEMFC)
        • 9.2.2. Direct Methanol Fuel Cells (DMFC)
        • 9.2.3. Solid Oxide Fuel Cells (SOFC)
        • 9.2.4. Others (Alkaline Fuel Cells, Phosphoric Acid Fuel Cells)
      • 9.3. Market Analysis, Insights and Forecast – By Application
        • 9.3.1. Portable
        • 9.3.2. Stationary
        • 9.3.3. Transport
      • 9.4. Market Analysis, Insights and Forecast – By Country
        • 9.4.1. Brazil
        • 9.4.2. Saudi Arabia
        • 9.4.3. UAE
        • 9.4.4. Rest of LAMEA

      10. Competitive Analysis

      • 10.1. Company Market Share Analysis, 2018
      • 10.2. Key Industry Developments
      • 10.3. Company Profile
      • 10.4. SFC Energy AG
        • 10.4.1. Business Overview
        • 10.4.2. Segment 1 & Service Offering
        • 10.4.3. Overall Revenue
        • 10.4.4. Geographic Presence
        • 10.4.5. Recent Development
      *Similar details will be provided for the following companies
      • 10.5. Plug Power Inc.
      • 10.6. Panasonic Corporation
      • 10.7. AFC Energy PLC
      • 10.8. Hydrogenics
      • 10.9. Nedstack Fuel Cells Technology B.V.
      • 10.10. ClearEdge Power
      List of Figures

      Figure 1: Global Hydrogen and Fuel Cells Market Revenue Breakdown (USD Billion, %) by Region, 2019 & 2027
      Figure 2: Global Market Value Share (%), By Segment 1, 2019 & 2027
      Figure 3: Global Market Forecast (USD Billion), by Sub-Segment 1, 2016-2027
      Figure 4: Global Market Forecast (USD Billion), by Sub-Segment 2, 2016-2027
      Figure 5: Global Market Value Share (%), By Segment 2, 2019 & 2027
      Figure 6: Global Market Forecast (USD Billion), by Sub-Segment 1, 2016-2027
      Figure 7: Global Market Forecast (USD Billion), by Sub-Segment 2, 2016-2027
      Figure 8: Global Market Forecast (USD Billion), by Sub-Segment 3, 2016-2027
      Figure 9: Global Hydrogen and Fuel Cells Market Forecast (USD Billion), by Others, 2016-2027
      Figure 10: Global Market Value Share (%), By Segment 3, 2019 & 2027
      Figure 11: Global Market Forecast (USD Billion), by Sub-Segment 1, 2016-2027
      Figure 12: Global Market Forecast (USD Billion), by Sub-Segment 2, 2016-2027
      Figure 13: Global Market Forecast (USD Billion), by Sub-Segment 3, 2016-2027
      Figure 14: Global Market Forecast (USD Billion), by Others, 2016-2027
      Figure 15: Global Market Value (USD Billion), by Region, 2019 & 2027
      Figure 16: North America Hydrogen and Fuel Cells Market Value Share (%), By Segment 1, 2019 & 2027
      Figure 17: North America Market Forecast (USD Billion), by Sub-Segment 1, 2016-2027
      Figure 18: North America Market Forecast (USD Billion), by Sub-Segment 2, 2016-2027
      Figure 19: North America Market Value Share (%), By Segment 2, 2019 & 2027
      Figure 20: North America Market Forecast (USD Billion), by Sub-Segment 1, 2016-2027
      Figure 21: North America Market Forecast (USD Billion), by Sub-Segment 2, 2016-2027
      Figure 22: North America Market Forecast (USD Billion), by Sub-Segment 3, 2016-2027
      Figure 23: North America Market Forecast (USD Billion), by Others, 2016-2027
      Figure 24: North America Market Value Share (%), By Segment 3, 2019 & 2027
      Figure 25: North America Market Forecast (USD Billion), by Sub-Segment 1, 2016-2027
      Figure 26: North America Market Forecast (USD Billion), by Sub-Segment 2, 2016-2027
      Figure 27: North America Market Forecast (USD Billion), by Sub-Segment 3, 2016-2027
      Figure 28: North America Market Forecast (USD Billion), by Others, 2016-2027
      Figure 29: North America Market Forecast (USD Billion), by U.S., 2016-2027
      Figure 30: North America Market Forecast (USD Billion), by Canada, 2016-2027
      Figure 31: Latin America Hydrogen and Fuel Cells Market Value Share (%), By Segment 1, 2019 & 2027
      Figure 32: Latin America Market Forecast (USD Billion), by Sub-Segment 1, 2016-2027
      Figure 33: Latin America Market Forecast (USD Billion), by Sub-Segment 2, 2016-2027
      Figure 34: Latin America Market Value Share (%), By Segment 2, 2019 & 2027
      Figure 35: Latin America Market Forecast (USD Billion), by Sub-Segment 1, 2016-2027
      Figure 36: Latin America Market Forecast (USD Billion), by Sub-Segment 2, 2016-2027
      Figure 37: Latin America Market Forecast (USD Billion), by Sub-Segment 3, 2016-2027
      Figure 38: Latin America Market Forecast (USD Billion), by Others, 2016-2027
      Figure 39: Latin America Market Value Share (%), By Segment 3, 2019 & 2027
      Figure 40: Latin America Market Forecast (USD Billion), by Sub-Segment 1, 2016-2027
      Figure 41: Latin America Market Forecast (USD Billion), by Sub-Segment 2, 2016-2027
      Figure 42: Latin America Market Forecast (USD Billion), by Sub-Segment 3, 2016-2027
      Figure 43: Latin America Market Forecast (USD Billion), by Others, 2016-2027
      Figure 44: Latin America Market Forecast (USD Billion), by Brazil, 2016-2027
      Figure 45: Latin America Market Forecast (USD Billion), by Mexico, 2016-2027
      Figure 46: Latin America Market Forecast (USD Billion), by Rest of Latin America, 2016-2027
      Figure 47: Europe Hydrogen and Fuel Cells Market Value Share (%), By Segment 1, 2019 & 2027
      Figure 48: Europe Market Forecast (USD Billion), by Sub-Segment 1, 2016-2027
      Figure 49: Europe Market Forecast (USD Billion), by Sub-Segment 2, 2016-2027
      Figure 50: Europe Market Value Share (%), By Segment 2, 2019 & 2027
      Figure 51: Europe Market Forecast (USD Billion), by Sub-Segment 1, 2016-2027
      Figure 52: Europe Market Forecast (USD Billion), by Sub-Segment 2, 2016-2027
      Figure 53: Europe Market Forecast (USD Billion), by Sub-Segment 3, 2016-2027
      Figure 54: Europe Market Forecast (USD Billion), by Others, 2016-2027
      Figure 55: Europe Market Value Share (%), By Segment 3, 2019 & 2027
      Figure 56: Europe Market Forecast (USD Billion), by Sub-Segment 1, 2016-2027
      Figure 57: Europe Market Forecast (USD Billion), by Sub-Segment 2, 2016-2027
      Figure 58: Europe Market Forecast (USD Billion), by Sub-Segment 3, 2016-2027
      Figure 59: Europe Market Forecast (USD Billion), by Others, 2016-2027
      Figure 60: Europe Market Forecast (USD Billion), by U.K., 2016-2027
      Figure 61: Europe Market Forecast (USD Billion), by Germany, 2016-2027
      Figure 62: Europe Market Forecast (USD Billion), by France, 2016-2027
      Figure 63: Europe Market Forecast (USD Billion), by Italy, 2016-2027
      Figure 64: Europe Market Forecast (USD Billion), by Spain, 2016-2027
      Figure 65: Europe Market Forecast (USD Billion), by Russia, 2016-2027
      Figure 66: Europe Market Forecast (USD Billion), by Rest of Europe, 2016-2027
      Figure 67: Asia Pacific Hydrogen and Fuel Cells Market Value Share (%), By Segment 1, 2019 & 2027
      Figure 68: Asia Pacific Market Forecast (USD Billion), by Sub-Segment 1, 2016-2027
      Figure 69: Asia Pacific Market Forecast (USD Billion), by Sub-Segment 2, 2016-2027
      Figure 70: Asia Pacific Market Value Share (%), By Segment 2, 2019 & 2027
      Figure 71: Asia Pacific Market Forecast (USD Billion), by Sub-Segment 1, 2016-2027
      Figure 72: Asia Pacific Market Forecast (USD Billion), by Sub-Segment 2, 2016-2027
      Figure 73: Asia Pacific Market Forecast (USD Billion), by Sub-Segment 3, 2016-2027
      Figure 74: Asia Pacific Market Forecast (USD Billion), by Others, 2016-2027
      Figure 75: Asia Pacific Market Value Share (%), By Segment 3, 2019 & 2027
      Figure 76: Asia Pacific Market Forecast (USD Billion), by Sub-Segment 1, 2016-2027
      Figure 77: Asia Pacific Market Forecast (USD Billion), by Sub-Segment 2, 2016-2027
      Figure 78: Asia Pacific Market Forecast (USD Billion), by Sub-Segment 3, 2016-2027
      Figure 79: Asia Pacific Market Forecast (USD Billion), by Others, 2016-2027
      Figure 80: Asia Pacific Market Forecast (USD Billion), by China, 2016-2027
      Figure 81: Asia Pacific Market Forecast (USD Billion), by India, 2016-2027
      Figure 82: Asia Pacific Market Forecast (USD Billion), by Japan, 2016-2027
      Figure 83: Asia Pacific Market Forecast (USD Billion), by Australia, 2016-2027
      Figure 84: Asia Pacific Market Forecast (USD Billion), by Southeast Asia, 2016-2027
      Figure 85: Asia Pacific Market Forecast (USD Billion), by Rest of Asia Pacific, 2016-2027
      Figure 86: Middle East & Africa Hydrogen and Fuel Cells Market Value Share (%), By Segment 1, 2019 & 2027
      Figure 87: Middle East & Africa Market Forecast (USD Billion), by Sub-Segment 1, 2016-2027
      Figure 88: Middle East & Africa Market Forecast (USD Billion), by Sub-Segment 2, 2016-2027
      Figure 89: Middle East & Africa Market Value Share (%), By Segment 2, 2019 & 2027
      Figure 90: Middle East & Africa Market Forecast (USD Billion), by Sub-Segment 1, 2016-2027
      Figure 91: Middle East & Africa Market Forecast (USD Billion), by Sub-Segment 2, 2016-2027
      Figure 92: Middle East & Africa Market Forecast (USD Billion), by Sub-Segment 3, 2016-2027
      Figure 93: Middle East & Africa Market Forecast (USD Billion), by Others, 2016-2027
      Figure 94: Middle East & Africa Market Value Share (%), By Segment 3, 2019 & 2027
      Figure 95: Middle East & Africa Market Forecast (USD Billion), by Sub-Segment 1, 2016-2027
      Figure 96: Middle East & Africa Market Forecast (USD Billion), by Sub-Segment 2, 2016-2027
      Figure 97: Middle East & Africa Market Forecast (USD Billion), by Sub-Segment 3, 2016-2027
      Figure 98: Middle East & Africa Market Forecast (USD Billion), by Others, 2016-2027
      Figure 99: Middle East & Africa Market Forecast (USD Billion), by GCC, 2016-2027
      Figure 100: Middle East & Africa Market Forecast (USD Billion), by South Africa, 2016-2027
      Figure 101: Middle East & Africa Market Forecast (USD Billion), by Rest of Middle East & Africa, 2016-2027 
      List of Tables
      Table 1: Global Hydrogen and Fuel Cells Market Revenue (USD Billion) Forecast, by Segment 1, 2016-2027
      Table 2: Global Market Revenue (USD Billion) Forecast, by Segment 2, 2016-2027
      Table 3: Global Market Revenue (USD Billion) Forecast, by Segment 3, 2016-2027
      Table 4: Global Market Revenue (USD Billion) Forecast, by Region, 2016-2027
      Table 5: North America Hydrogen and Fuel Cells Market Revenue (USD Billion) Forecast, by Segment 1, 2016-2027
      Table 6: North America Market Revenue (USD Billion) Forecast, by Segment 2, 2016-2027
      Table 7: North America Market Revenue (USD Billion) Forecast, by Segment 3, 2016-2027
      Table 8: North America Market Revenue (USD Billion) Forecast, by Country, 2016-2027
      Table 9: Europe Hydrogen and Fuel Cells Market Revenue (USD Billion) Forecast, by Segment 1, 2016-2027
      Table 10: Europe Market Revenue (USD Billion) Forecast, by Segment 2, 2016-2027
      Table 11: Europe Market Revenue (USD Billion) Forecast, by Segment 3, 2016-2027
      Table 12: Europe Market Revenue (USD Billion) Forecast, by Country, 2016-2027
      Table 13: Latin America Hydrogen and Fuel Cells Market Revenue (USD Billion) Forecast, by Segment 1, 2016-2027
      Table 14: Latin America Market Revenue (USD Billion) Forecast, by Segment 2, 2016-2027
      Table 15: Latin America Market Revenue (USD Billion) Forecast, by Segment 3, 2016-2027
      Table 16: Latin America Market Revenue (USD Billion) Forecast, by Country, 2016-2027
      Table 17: Asia Pacific Hydrogen and Fuel Cells Market Revenue (USD Billion) Forecast, by Segment 1, 2016-2027
      Table 18: Asia Pacific Market Revenue (USD Billion) Forecast, by Segment 2, 2016-2027
      Table 19: Asia Pacific Market Revenue (USD Billion) Forecast, by Segment 3, 2016-2027
      Table 20: Asia Pacific Market Revenue (USD Billion) Forecast, by Country, 2016-2027
      Table 21: Middle East & Africa Hydrogen and Fuel Cells Market Revenue (USD Billion) Forecast, by Segment 1, 2016-2027
      Table 22: Middle East & Africa Market Revenue (USD Billion) Forecast, by Segment 2, 2016-2027
      Table 23: Middle East & Africa Market Revenue (USD Billion) Forecast, by Segment 3, 2016-2027
      Table 24: Middle East & Africa Market Revenue (USD Billion) Forecast, by Country, 2016-2027
      Research Process

      Data Library Research are conducted by industry experts who offer insight on industry structure, market segmentations technology assessment and competitive landscape (CL), and penetration, as well as on emerging trends. Their analysis is based on primary interviews (~ 80%) and secondary research (~ 20%) as well as years of professional expertise in their respective industries. Adding to this, by analysing historical trends and current market positions, our analysts predict where the market will be headed for the next five years. Furthermore, the varying trends of segment & categories geographically presented are also studied and the estimated based on the primary & secondary research.

      In this particular report from the supply side Data Library Research has conducted primary surveys (interviews) with the key level executives (VP, CEO’s, Marketing Director, Business Development Manager and SOFT) of the companies that active & prominent as well as the midsized organization

      FIGURE 1: DLR RESEARH PROCESS

      research-methodology1

      Primary Research

      Extensive primary research was conducted to gain a deeper insight of the market and industry performance. The analysis is based on both primary and secondary research as well as years of professional expertise in the respective industries.

      In addition to analysing current and historical trends, our analysts predict where the market is headed over the next five years.

      It varies by segment for these categories geographically presented in the list of market tables. Speaking about this particular report we have conducted primary surveys (interviews) with the key level executives (VP, CEO’s, Marketing Director, Business Development Manager and many more) of the major players active in the market.

      Secondary Research

      Secondary research was mainly used to collect and identify information useful for the extensive, technical, market-oriented, and Friend’s study of the Global Extra Neutral Alcohol. It was also used to obtain key information about major players, market classification and segmentation according to the industry trends, geographical markets, and developments related to the market and technology perspectives. For this study, analysts have gathered information from various credible sources, such as annual reports, sec filings, journals, white papers, SOFT presentations, and company web sites.

      Market Size Estimation

      Both, top-down and bottom-up approaches were used to estimate and validate the size of the Global market and to estimate the size of various other dependent submarkets in the overall Extra Neutral Alcohol. The key players in the market were identified through secondary research and their market contributions in the respective geographies were determined through primary and secondary research.

      Forecast Model

      research-methodology2