Global Hydrogen Market Opportunities and Forecast 2023-2030

  •   DLR2537
  •   September, 2023
  •   Pages: 120
  •  Global
Hydrogen Market Overview

The size of the global Hydrogen Market was estimated at USD 196.23 billion in 2021, and it is anticipated to increase at a CAGR of 5.9% from 2023 to 2030.

Hydrogen is the chemical element with the symbol H and it is the lightest element.  Hydrogen comes with several uses. The global Hydrogen market is projected to grow at a considerable rate in the forecast period. In the chemical sector, hydrogen is used in the making of ammonia, which is use as an ingredient of agricultural fertilizer. It is also used in the making of methanol and cyclohexane, which act as intermediates in the production process of pharmaceuticals and plastics. Additionally, this chemical is also used in the process of removal of sulfur from fuels at the time of oil refining. Hence, such diverse uses of this chemical are anticipated to boost the growth of the global Hydrogen market over the forthcoming years.

Additionally, hydrogen is viewed as a very flexible element that use across numerous applications, such as transportation of fuel, chemical, and industrial processes. Hydrogen is also used as a heating fuel for the generation of power, cooking, and heating purposes. The versatile nature of hydrogen and its capability to facilitate services across several sectors, such as industrial, electricity, commercial, and transportation. These prime factors escalate the growth of the global Hydrogen market during the forecast period.

Report Metric Details
Market size available for years 2023–2030
Base year considered 2023
Forecast period 2024–2030
Forecast unit Value (USD Million)
Segments covered Production Process, Distribution Method, End User, and Region
Regions covered North America (the U.S. and Canada), Europe (UK, Germany, France, Italy, Spain, Russia, Rest of Europe), Asia-Pacific (China, India, Japan, Australia, South East Asia, Rest of Asia Pacific), Latin America and the Middle East and Africa (Brazil, Saudi Arabia, UAE, Rest of LAMEA)
Companies covered The Linde Group, Teledyne Technologies Inc., Air Liquide S.A., Messer Group GmbH, Showa Denko K.K., Taiyo Nippon Sanso Corporation.


Covid-19 Impact on Hydrogen Market

The ongoing COVID-19 pandemic conditions have severely affected every sector around the world. Whereas, the chemicals and materials sectors were moderately affected during the pandemic. This is primarily due to the uncut demand for chemicals for healthcare, life science, and cleaning agents. However, other elements of chemical and material sectors such as paints, industrial oil, construction materials are facing diminution in demand. Strict lockdown resulted in a nearly 50-60% reduction in supply for raw materials, which directly affected the manufacturing process. Further, halt on many end-use industries directly affected the chemical demand all around the world.

Hydrogen Market Segment Overview


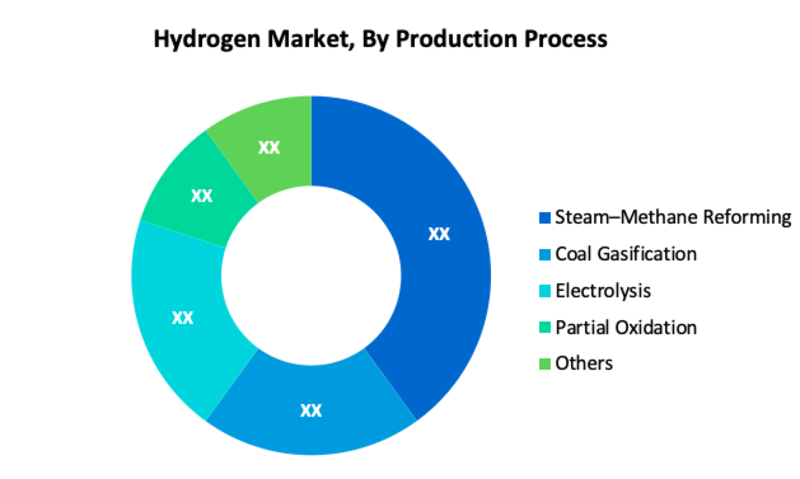
In terms of Production Process, the Steam–Methane Reforming segment held the largest share in the global Hydrogen market.  This is because the production of hydrogen through this process is cheaper than others. Additionally, a well-maintained supply chain and easy availability of the feedstock also support the growth of this segment. Based on, Distribution Method, the On-Site Generation is the largest segment in the market. On-site generation is a less intricate method of transporting the gas to end-users. Also, it is cost-effective than the tanker and cylinder methods, when used for a longer time. Furthermore, it allows companies to smoothen their operations by minimizing the risks related to the supply chain.
 
Hydrogen Market, By Production Process
·       Steam–Methane Reforming
·       Coal Gasification
·       Electrolysis
·       Partial Oxidation
·       Others (Renewable Liquid Reforming, Fermentation, Methanol Reforming, and Ammonia Cracking)
 
Hydrogen Market, By Distribution Method
·       On-Site Generation
·       Cylinder
·       Tanker

Hydrogen Market, By End User
  • Chemical
    • Ammonia
    • Methanol
    • Polymer
    • Resin
  • Refineries
  • Metal Processing
  • Others (Transport, Aviation, and Marine)

Hydrogen Regional Overview

Geographically, North America is projected to be a prominent region for the global Hydrogen market in the forecast period. Increased awareness about the environment along with the benefits of using hydrogen is expected to propel the growth of the market in this region.  Likewise, the market in the Asia Pacific is anticipated to witness significant growth in the coming years. This is due to the large demand for vehicles running on hydrogen-based fuel in countries like Japan. Additionally, manufacturers of automotive are planning to come up with auto fuel stations in the Asia Pacific, which is expected to generate various growth opportunities for the hydrogen market in this region.

Hydrogen Market, By Geography

·       North America (US & Canada)
·       Europe (UK, Germany, France, Italy, Spain, Russia & Rest of Europe)
·       Asia-Pacific (Japan, China, India, Australia, & South Korea, & Rest of Asia-Pacific)
·       LAMEA (Brazil, Saudi Arabia, UAE & Rest of LAMEA)
 
Hydrogen Market Competitor overview

Some key developments and strategies adopted by manufacturers in Hydrogen are highlighted below.

·       In October 2021, Spanish oil and gas giant Repsol has produced its first batch of hydrogen utilizing biomethane as the feedstock. Repsol confirmed it had produced 10 tonnes of renewable hydrogen at its Cartagena Industrial Complex, in the Murcia region of south-east Spain. The hydrogen produced from the process will be used to manufacture fuels such as gasoline, diesel, or kerosene for aviation.

Hydrogen Market, Key Players

·       The Linde Group
·       Teledyne Technologies Inc.
·       Air Liquide S.A.
·       Messer Group GmbH
·       Showa Denko K.K.
·       Taiyo Nippon Sanso Corporation

Frequently Asked Questions (FAQ) :

Q1. What is the total CAGR expected to be recorded for the Hydrogen market during the forecast period?

The Hydrogen market is expected to record a CAGR of ~ 5.9 % during the forecast period.

Q2. What are the driving factors for the Hydrogen market?

The versatile nature of hydrogen and its capability to facilitate services across several sectors, such as industrial, electricity, commercial, and transportation. Further, hydrogen is used in the making of ammonia, which use as an ingredient of agricultural fertilizer, these are some significant factors that boost the growth of the Hydrogen market.

Q3. Which Segments are covered in the Hydrogen market report?

Production Process, Distribution Method, End User, and Region, these segments are covered in the Hydrogen market report.

Q4. Which segment is projected to hold the largest share in the Hydrogen Market?

The Steam–Methane Reforming segment is projected to hold the largest share in the Hydrogen Market.

Q5. Which are the prominent players in the Hydrogen Market?

The Linde Group, Teledyne Technologies Inc., Air Liquide S.A., Messer Group GmbH, Showa Denko K.K., Taiyo Nippon Sanso Corporation are some key players in the Hydrogen Market.
Hydrogen Market Study Global Market Analysis, Insights and Forecast, 2023-2030

    1. Introduction

    • 1.1. Research Scope
    • 1.2. Market Segmentation
    • 1.3. Research Methodology
    • 1.4. Definitions and Assumptions

    2. Executive Summary

      3. Market Dynamics

      • 3.1. Market Drivers
      • 3.2. Market Restraints
      • 3.3. Market Opportunities

      4. Key Insights

      • 4.1. Key Emerging Trends – For Major Countries
      • 4.2. Latest Technological Advancement
      • 4.3. Regulatory Landscape
      • 4.4. Industry SWOT Analysis
      • 4.5. Porters Five Forces Analysis

      5. Global Hydrogen Market Analysis (USD Billion), Insights and Forecast, 2023-2030

      • 5.1. Key Findings / Summary
      • 5.2. Market Analysis, Insights and Forecast – By Production Process
        • 5.2.1. Steam–Methane Reforming
        • 5.2.2. Coal Gasification
        • 5.2.3. Electrolysis
        • 5.2.4. Partial Oxidation
        • 5.2.5. Others (Renewable Liquid Reforming, Fermentation, Methanol Reforming, and Ammonia Cracking)
      • 5.3. Market Analysis, Insights and Forecast – By Distribution Method
        • 5.3.1. On-Site Generation
        • 5.3.2. Cylinder
        • 5.3.3. Tanker
      • 5.4. Market Analysis, Insights and Forecast – By End User
        • 5.4.1. Chemical
          • 5.4.1.1. Ammonia
          • 5.4.1.2. Methanol
          • 5.4.1.3. Polymer
          • 5.4.1.4. Resin
        • 5.4.2. Refineries
        • 5.4.3. Metal Processing
        • 5.4.4. Others (Transport, Aviation, and Marine)
      • 5.5. Market Analysis, Insights and Forecast – By Region
        • 5.5.1. North America
        • 5.5.2. Europe
        • 5.5.3. Asia Pacific
        • 5.5.4. Latin America, Middle East and Africa

      6. North America Hydrogen Market Analysis (USD Billion), Insights and Forecast, 2023-2030

      • 6.1. Key Findings / Summary
      • 6.2. Market Analysis, Insights and Forecast – By Production Process
        • 6.2.1. Steam–Methane Reforming
        • 6.2.2. Coal Gasification
        • 6.2.3. Electrolysis
        • 6.2.4. Partial Oxidation
        • 6.2.5. Others (Renewable Liquid Reforming, Fermentation, Methanol Reforming, and Ammonia Cracking)
      • 6.3. Market Analysis, Insights and Forecast – By Distribution Method
        • 6.3.1. On-Site Generation
        • 6.3.2. Cylinder
        • 6.3.3. Tanker
      • 6.4. Market Analysis, Insights and Forecast – By End User
        • 6.4.1. Chemical
          • 6.4.1.1. Ammonia
          • 6.4.1.2. Methanol
          • 6.4.1.3. Polymer
          • 6.4.1.4. Resin
        • 6.4.2. Refineries
        • 6.4.3. Metal Processing
        • 6.4.4. Others (Transport, Aviation, and Marine)
      • 6.5. Market Analysis, Insights and Forecast – By Country
        • 6.5.1. U.S.
        • 6.5.2. Canada

      7. Europe Hydrogen Market Analysis (USD Billion), Insights and Forecast, 2023-2030

      • 7.1. Key Findings / Summary
      • 7.2. Market Analysis, Insights and Forecast – By Production Process
        • 7.2.1. Steam–Methane Reforming
        • 7.2.2. Coal Gasification
        • 7.2.3. Electrolysis
        • 7.2.4. Partial Oxidation
        • 7.2.5. Others (Renewable Liquid Reforming, Fermentation, Methanol Reforming, and Ammonia Cracking)
      • 7.3. Market Analysis, Insights and Forecast – By Distribution Method
        • 7.3.1. On-Site Generation
        • 7.3.2. Cylinder
        • 7.3.3. Tanker
      • 7.4. Market Analysis, Insights and Forecast – By End User
        • 7.4.1. Chemical
          • 7.4.1.1. Ammonia
          • 7.4.1.2. Methanol
          • 7.4.1.3. Polymer
          • 7.4.1.4. Resin
        • 7.4.2. Refineries
        • 7.4.3. Metal Processing
        • 7.4.4. Others (Transport, Aviation, and Marine)
      • 7.5. Market Analysis, Insights and Forecast – By Country
        • 7.5.1. UK
        • 7.5.2. Germany
        • 7.5.3. France
        • 7.5.4. Italy
        • 7.5.5. Spain
        • 7.5.6. Russia
        • 7.5.7. Rest of Europe

      8. Asia Pacific Hydrogen Market Analysis (USD Billion), Insights and Forecast, 2023-2030

      • 8.1. Key Findings / Summary
      • 8.2. Market Analysis, Insights and Forecast – By Production Process
        • 8.2.1. Steam–Methane Reforming
        • 8.2.2. Coal Gasification
        • 8.2.3. Electrolysis
        • 8.2.4. Partial Oxidation
        • 8.2.5. Others (Renewable Liquid Reforming, Fermentation, Methanol Reforming, and Ammonia Cracking)
      • 8.3. Market Analysis, Insights and Forecast – By Distribution Method
        • 8.3.1. On-Site Generation
        • 8.3.2. Cylinder
        • 8.3.3. Tanker
      • 8.4. Market Analysis, Insights and Forecast – By End User
        • 8.4.1. Chemical
          • 8.4.1.1. Ammonia
          • 8.4.1.2. Methanol
          • 8.4.1.3. Polymer
          • 8.4.1.4. Resin
        • 8.4.2. Refineries
        • 8.4.3. Metal Processing
        • 8.4.4. Others (Transport, Aviation, and Marine)
      • 8.5. Market Analysis, Insights and Forecast – By Country
        • 8.5.1. China
        • 8.5.2. India
        • 8.5.3. Japan
        • 8.5.4. Australia
        • 8.5.5. South East Asia
        • 8.5.6. Rest of Asia Pacific

      9. Latin America, Middle East and Africa Hydrogen Market Analysis (USD Billion), Insights and Forecast, 2023-2030

      • 9.1. Key Findings / Summary
      • 9.2. Market Analysis, Insights and Forecast – By Production Process
        • 9.2.1. Steam–Methane Reforming
        • 9.2.2. Coal Gasification
        • 9.2.3. Electrolysis
        • 9.2.4. Partial Oxidation
        • 9.2.5. Others (Renewable Liquid Reforming, Fermentation, Methanol Reforming, and Ammonia Cracking)
      • 9.3. Market Analysis, Insights and Forecast – By Distribution Method
        • 9.3.1. On-Site Generation
        • 9.3.2. Cylinder
        • 9.3.3. Tanker
      • 9.4. Market Analysis, Insights and Forecast – By End User
        • 9.4.1. Chemical
          • 9.4.1.1. Ammonia
          • 9.4.1.2. Methanol
          • 9.4.1.3. Polymer
          • 9.4.1.4. Resin
        • 9.4.2. Refineries
        • 9.4.3. Metal Processing
        • 9.4.4. Others (Transport, Aviation, and Marine)
      • 9.5. Market Analysis, Insights and Forecast – By Country
        • 9.5.1. Brazil
        • 9.5.2. Saudi Arabia
        • 9.5.3. UAE
        • 9.5.4. Rest of LAMEA

      10. Competitive Analysis

      • 10.1. Company Market Share Analysis, 2021
      • 10.2. Key Industry Developments
      • 10.3. Company Profile
      • 10.4. The Linde Group
        • 10.4.1. Business Overview
        • 10.4.2. Segment 1 & Service Offering
        • 10.4.3. Overall Revenue
        • 10.4.4. Geographic Presence
        • 10.4.5. Recent Development
      *Similar details will be provided for the following companies
      • 10.5. Teledyne Technologies Inc.
      • 10.6. Air Liquide S.A.
      • 10.7. Messer Group GmbH
      • 10.8. Showa Denko K.K.
      List of Figures

      Figure 1: Global Hydrogen Market Revenue Breakdown (USD Billion, %) by Region, 2023 & 2030
      Figure 2: Global Hydrogen Market Value Share (%), By Segment 1, 2023 & 2030
      Figure 3: Global Hydrogen Market Forecast (USD Billion), by Sub-Segment 1, 2021-2030
      Figure 4: Global Hydrogen Market Forecast (USD Billion), by Sub-Segment 2, 2021-2030
      Figure 5: Global Hydrogen Market Value Share (%), By Segment 2, 2023 & 2030
      Figure 6: Global Hydrogen Market Forecast (USD Billion), by Sub-Segment 1, 2021-2030
      Figure 7: Global Hydrogen Market Forecast (USD Billion), by Sub-Segment 2, 2021-2030
      Figure 8: Global Hydrogen Market Forecast (USD Billion), by Sub-Segment 3, 2021-2030
      Figure 9: Global Hydrogen Market Forecast (USD Billion), by Others, 2021-2030
      Figure 10: Global Hydrogen Market Value Share (%), By Segment 3, 2023 & 2030
      Figure 11: Global Hydrogen Market Forecast (USD Billion), by Sub-Segment 1, 2021-2030
      Figure 12: Global Hydrogen Market Forecast (USD Billion), by Sub-Segment 2, 2021-2030
      Figure 13: Global Hydrogen Market Forecast (USD Billion), by Sub-Segment 3, 2021-2030
      Figure 14: Global Hydrogen Market Forecast (USD Billion), by Others, 2021-2030
      Figure 15: Global Hydrogen Market Value (USD Billion), by Region, 2023 & 2030
      Figure 16: North America Hydrogen Market Value Share (%), By Segment 1, 2023 & 2030
      Figure 17: North America Hydrogen Market Forecast (USD Billion), by Sub-Segment 1, 2021-2030
      Figure 18: North America Hydrogen Market Forecast (USD Billion), by Sub-Segment 2, 2021-2030
      Figure 19: North America Hydrogen Market Value Share (%), By Segment 2, 2023 & 2030
      Figure 20: North America Hydrogen Market Forecast (USD Billion), by Sub-Segment 1, 2021-2030
      Figure 21: North America Hydrogen Market Forecast (USD Billion), by Sub-Segment 2, 2021-2030
      Figure 22: North America Hydrogen Market Forecast (USD Billion), by Sub-Segment 3, 2021-2030
      Figure 23: North America Hydrogen Market Forecast (USD Billion), by Others, 2021-2030
      Figure 24: North America Hydrogen Market Value Share (%), By Segment 3, 2023 & 2030
      Figure 25: North America Hydrogen Market Forecast (USD Billion), by Sub-Segment 1, 2021-2030
      Figure 26: North America Hydrogen Market Forecast (USD Billion), by Sub-Segment 2, 2021-2030
      Figure 27: North America Hydrogen Market Forecast (USD Billion), by Sub-Segment 3, 2021-2030
      Figure 28: North America Hydrogen Market Forecast (USD Billion), by Others, 2021-2030
      Figure 29: North America Hydrogen Market Forecast (USD Billion), by U.S., 2021-2030
      Figure 30: North America Hydrogen Market Forecast (USD Billion), by Canada, 2021-2030
      Figure 31: Latin America Hydrogen Market Value Share (%), By Segment 1, 2023 & 2030
      Figure 32: Latin America Hydrogen Market Forecast (USD Billion), by Sub-Segment 1, 2021-2030
      Figure 33: Latin America Hydrogen Market Forecast (USD Billion), by Sub-Segment 2, 2021-2030
      Figure 34: Latin America Hydrogen Market Value Share (%), By Segment 2, 2023 & 2030
      Figure 35: Latin America Hydrogen Market Forecast (USD Billion), by Sub-Segment 1, 2021-2030
      Figure 36: Latin America Hydrogen Market Forecast (USD Billion), by Sub-Segment 2, 2021-2030
      Figure 37: Latin America Hydrogen Market Forecast (USD Billion), by Sub-Segment 3, 2021-2030
      Figure 38: Latin America Hydrogen Market Forecast (USD Billion), by Others, 2021-2030
      Figure 39: Latin America Hydrogen Market Value Share (%), By Segment 3, 2023 & 2030
      Figure 40: Latin America Hydrogen Market Forecast (USD Billion), by Sub-Segment 1, 2021-2030
      Figure 41: Latin America Hydrogen Market Forecast (USD Billion), by Sub-Segment 2, 2021-2030
      Figure 42: Latin America Hydrogen Market Forecast (USD Billion), by Sub-Segment 3, 2021-2030
      Figure 43: Latin America Hydrogen Market Forecast (USD Billion), by Others, 2021-2030
      Figure 44: Latin America Hydrogen Market Forecast (USD Billion), by Brazil, 2021-2030
      Figure 45: Latin America Hydrogen Market Forecast (USD Billion), by Mexico, 2021-2030
      Figure 46: Latin America Hydrogen Market Forecast (USD Billion), by Rest of Latin America, 2021-2030
      Figure 47: Europe Hydrogen Market Value Share (%), By Segment 1, 2023 & 2030
      Figure 48: Europe Hydrogen Market Forecast (USD Billion), by Sub-Segment 1, 2021-2030
      Figure 49: Europe Hydrogen Market Forecast (USD Billion), by Sub-Segment 2, 2021-2030
      Figure 50: Europe Hydrogen Market Value Share (%), By Segment 2, 2023 & 2030
      Figure 51: Europe Hydrogen Market Forecast (USD Billion), by Sub-Segment 1, 2021-2030
      Figure 52: Europe Hydrogen Market Forecast (USD Billion), by Sub-Segment 2, 2021-2030
      Figure 53: Europe Hydrogen Market Forecast (USD Billion), by Sub-Segment 3, 2021-2030
      Figure 54: Europe Hydrogen Market Forecast (USD Billion), by Others, 2021-2030
      Figure 55: Europe Hydrogen Market Value Share (%), By Segment 3, 2023 & 2030
      Figure 56: Europe Hydrogen Market Forecast (USD Billion), by Sub-Segment 1, 2021-2030
      Figure 57: Europe Hydrogen Market Forecast (USD Billion), by Sub-Segment 2, 2021-2030
      Figure 58: Europe Hydrogen Market Forecast (USD Billion), by Sub-Segment 3, 2021-2030
      Figure 59: Europe Hydrogen Market Forecast (USD Billion), by Others, 2021-2030
      Figure 60: Europe Hydrogen Market Forecast (USD Billion), by U.K., 2021-2030
      Figure 61: Europe Hydrogen Market Forecast (USD Billion), by Germany, 2021-2030
      Figure 62: Europe Hydrogen Market Forecast (USD Billion), by France, 2021-2030
      Figure 63: Europe Hydrogen Market Forecast (USD Billion), by Italy, 2021-2030
      Figure 64: Europe Hydrogen Market Forecast (USD Billion), by Spain, 2021-2030
      Figure 65: Europe Hydrogen Market Forecast (USD Billion), by Russia, 2021-2030
      Figure 66: Europe Hydrogen Market Forecast (USD Billion), by Rest of Europe, 2021-2030
      Figure 67: Asia Pacific Hydrogen Market Value Share (%), By Segment 1, 2023 & 2030
      Figure 68: Asia Pacific Hydrogen Market Forecast (USD Billion), by Sub-Segment 1, 2021-2030
      Figure 69: Asia Pacific Hydrogen Market Forecast (USD Billion), by Sub-Segment 2, 2021-2030
      Figure 70: Asia Pacific Hydrogen Market Value Share (%), By Segment 2, 2023 & 2030
      Figure 71: Asia Pacific Hydrogen Market Forecast (USD Billion), by Sub-Segment 1, 2021-2030
      Figure 72: Asia Pacific Hydrogen Market Forecast (USD Billion), by Sub-Segment 2, 2021-2030
      Figure 73: Asia Pacific Hydrogen Market Forecast (USD Billion), by Sub-Segment 3, 2021-2030
      Figure 74: Asia Pacific Hydrogen Market Forecast (USD Billion), by Others, 2021-2030
      Figure 75: Asia Pacific Hydrogen Market Value Share (%), By Segment 3, 2023 & 2030
      Figure 76: Asia Pacific Hydrogen Market Forecast (USD Billion), by Sub-Segment 1, 2021-2030
      Figure 77: Asia Pacific Hydrogen Market Forecast (USD Billion), by Sub-Segment 2, 2021-2030
      Figure 78: Asia Pacific Hydrogen Market Forecast (USD Billion), by Sub-Segment 3, 2021-2030
      Figure 79: Asia Pacific Hydrogen Market Forecast (USD Billion), by Others, 2021-2030
      Figure 80: Asia Pacific Hydrogen Market Forecast (USD Billion), by China, 2021-2030
      Figure 81: Asia Pacific Hydrogen Market Forecast (USD Billion), by India, 2021-2030
      Figure 82: Asia Pacific Hydrogen Market Forecast (USD Billion), by Japan, 2021-2030
      Figure 83: Asia Pacific Hydrogen Market Forecast (USD Billion), by Australia, 2021-2030
      Figure 84: Asia Pacific Hydrogen Market Forecast (USD Billion), by Southeast Asia, 2021-2030
      Figure 85: Asia Pacific Hydrogen Market Forecast (USD Billion), by Rest of Asia Pacific, 2021-2030
      Figure 86: Middle East & Africa Hydrogen Market Value Share (%), By Segment 1, 2023 & 2030
      Figure 87: Middle East & Africa Hydrogen Market Forecast (USD Billion), by Sub-Segment 1, 2021-2030
      Figure 88: Middle East & Africa Hydrogen Market Forecast (USD Billion), by Sub-Segment 2, 2021-2030
      Figure 89: Middle East & Africa Hydrogen Market Value Share (%), By Segment 2, 2023 & 2030
      Figure 90: Middle East & Africa Hydrogen Market Forecast (USD Billion), by Sub-Segment 1, 2021-2030
      Figure 91: Middle East & Africa Hydrogen Market Forecast (USD Billion), by Sub-Segment 2, 2021-2030
      Figure 92: Middle East & Africa Hydrogen Market Forecast (USD Billion), by Sub-Segment 3, 2021-2030
      Figure 93: Middle East & Africa Hydrogen Market Forecast (USD Billion), by Others, 2021-2030
      Figure 94: Middle East & Africa Hydrogen Market Value Share (%), By Segment 3, 2023 & 2030
      Figure 95: Middle East & Africa Hydrogen Market Forecast (USD Billion), by Sub-Segment 1, 2021-2030
      Figure 96: Middle East & Africa Hydrogen Market Forecast (USD Billion), by Sub-Segment 2, 2021-2030
      Figure 97: Middle East & Africa Hydrogen Market Forecast (USD Billion), by Sub-Segment 3, 2021-2030
      Figure 98: Middle East & Africa Hydrogen Market Forecast (USD Billion), by Others, 2021-2030
      Figure 99: Middle East & Africa Hydrogen Market Forecast (USD Billion), by GCC, 2021-2030
      Figure 100: Middle East & Africa Hydrogen Market Forecast (USD Billion), by South Africa, 2021-2030
      Figure 101: Middle East & Africa Hydrogen Market Forecast (USD Billion), by Rest of Middle East & Africa, 2021-2030 
      List of Tables
      Table 1: Global Hydrogen Market Revenue (USD Billion) Forecast, by Segment 1, 2021-2030
      Table 2: Global Hydrogen Market Revenue (USD Billion) Forecast, by Segment 2, 2021-2030
      Table 3: Global Hydrogen Market Revenue (USD Billion) Forecast, by Segment 3, 2021-2030
      Table 4: Global Hydrogen Market Revenue (USD Billion) Forecast, by Region, 2021-2030
      Table 5: North America Hydrogen Market Revenue (USD Billion) Forecast, by Segment 1, 2021-2030
      Table 6: North America Hydrogen Market Revenue (USD Billion) Forecast, by Segment 2, 2021-2030
      Table 7: North America Hydrogen Market Revenue (USD Billion) Forecast, by Segment 3, 2021-2030
      Table 8: North America Hydrogen Market Revenue (USD Billion) Forecast, by Country, 2021-2030
      Table 9: Europe Hydrogen Market Revenue (USD Billion) Forecast, by Segment 1, 2021-2030
      Table 10: Europe Hydrogen Market Revenue (USD Billion) Forecast, by Segment 2, 2021-2030
      Table 11: Europe Hydrogen Market Revenue (USD Billion) Forecast, by Segment 3, 2021-2030
      Table 12: Europe Hydrogen Market Revenue (USD Billion) Forecast, by Country, 2021-2030
      Table 13: Latin America Hydrogen Market Revenue (USD Billion) Forecast, by Segment 1, 2021-2030
      Table 14: Latin America Hydrogen Market Revenue (USD Billion) Forecast, by Segment 2, 2021-2030
      Table 15: Latin America Hydrogen Market Revenue (USD Billion) Forecast, by Segment 3, 2021-2030
      Table 16: Latin America Hydrogen Market Revenue (USD Billion) Forecast, by Country, 2021-2030
      Table 17: Asia Pacific Hydrogen Market Revenue (USD Billion) Forecast, by Segment 1, 2021-2030
      Table 18: Asia Pacific Hydrogen Market Revenue (USD Billion) Forecast, by Segment 2, 2021-2030
      Table 19: Asia Pacific Hydrogen Market Revenue (USD Billion) Forecast, by Segment 3, 2021-2030
      Table 20: Asia Pacific Hydrogen Market Revenue (USD Billion) Forecast, by Country, 2021-2030
      Table 21: Middle East & Africa Hydrogen Market Revenue (USD Billion) Forecast, by Segment 1, 2021-2030
      Table 22: Middle East & Africa Hydrogen Market Revenue (USD Billion) Forecast, by Segment 2, 2021-2030
      Table 23: Middle East & Africa Hydrogen Market Revenue (USD Billion) Forecast, by Segment 3, 2021-2030
      Table 24: Middle East & Africa Hydrogen Market Revenue (USD Billion) Forecast, by Country, 2021-2030
      Research Process

      Data Library Research are conducted by industry experts who offer insight on industry structure, market segmentations technology assessment and competitive landscape (CL), and penetration, as well as on emerging trends. Their analysis is based on primary interviews (~ 80%) and secondary research (~ 20%) as well as years of professional expertise in their respective industries. Adding to this, by analysing historical trends and current market positions, our analysts predict where the market will be headed for the next five years. Furthermore, the varying trends of segment & categories geographically presented are also studied and the estimated based on the primary & secondary research.

      In this particular report from the supply side Data Library Research has conducted primary surveys (interviews) with the key level executives (VP, CEO’s, Marketing Director, Business Development Manager and SOFT) of the companies that active & prominent as well as the midsized organization

      FIGURE 1: DLR RESEARH PROCESS

      research-methodology1

      Primary Research

      Extensive primary research was conducted to gain a deeper insight of the market and industry performance. The analysis is based on both primary and secondary research as well as years of professional expertise in the respective industries.

      In addition to analysing current and historical trends, our analysts predict where the market is headed over the next five years.

      It varies by segment for these categories geographically presented in the list of market tables. Speaking about this particular report we have conducted primary surveys (interviews) with the key level executives (VP, CEO’s, Marketing Director, Business Development Manager and many more) of the major players active in the market.

      Secondary Research

      Secondary research was mainly used to collect and identify information useful for the extensive, technical, market-oriented, and Friend’s study of the Global Extra Neutral Alcohol. It was also used to obtain key information about major players, market classification and segmentation according to the industry trends, geographical markets, and developments related to the market and technology perspectives. For this study, analysts have gathered information from various credible sources, such as annual reports, sec filings, journals, white papers, SOFT presentations, and company web sites.

      Market Size Estimation

      Both, top-down and bottom-up approaches were used to estimate and validate the size of the Global market and to estimate the size of various other dependent submarkets in the overall Extra Neutral Alcohol. The key players in the market were identified through secondary research and their market contributions in the respective geographies were determined through primary and secondary research.

      Forecast Model

      research-methodology2