Global Marine Navigation System Market Opportunities and Forecast 2023-2030

  •   DLR1866
  •   August, 2022
  •   Pages: 120
  •  Global
Marine Navigation System Market Overview

Naval vessels use the maritime navigation system to find their way around. Marine navigation systems are used for a variety of purposes, including fishing, leisure boats, cargo ships, and marine vessels. GPS has become an essential part of marine navigation systems. The demand for integrated maritime navigation systems is increasing due to the bigger focus on cost-effectiveness. The global Marine Navigation System market is expected to rise at a considerable rate in the forthcoming years.
 
The primary reasons projected to fuel the growth of the marine navigation system market are an increase in seaborne trade, an increase in naval budgets, and an increase in cruise tourism. The marine navigation system market is very competitive, and to establish a solid client base, several companies in the industry are focusing on giving more precise solutions. The increased focus on marine security is projected to open up lucrative business prospects for market participants looking to build a strong client base and increase revenue.

Report Metric Details
Market size available for years 2023–2030
Base year considered 2023
Forecast period 2024–2030
Forecast unit Value (USD Million)
Segments covered Type, Application, End-Use, and Region
Regions covered North America (the U.S. and Canada), Europe (UK, Germany, France, Italy, Spain, Russia, Rest of Europe), Asia-Pacific (China, India, Japan, Australia, South East Asia, Rest of Asia Pacific), Latin America and the Middle East and Africa (Brazil, Saudi Arabia, UAE, Rest of LAMEA)
Companies covered Elcome International LLC, FLIR Systems, Garmin Ltd., Icom America Inc, Kongsberg Maritime, Navico, Northrop Grumman Sperry Marine B.V., Raytheon Anschütz, Satcom Global, Wärtsilä.


Covid-19 Impact on Marine Navigation System Market

As the COVID-19 pandemic continuing its effect around the world, many defense and aerospace companies are facing its impact during this time around the world. For instance, commercial aviation companies in the U.S., France, Germany, and Canada are facing disruption in the production process and reduced demand as workforces staying at home, passengers stop traveling, and delay in delivery of new aircraft. Analysts expecting a drop from 3,000 to 4,000 aircraft during the pandemic period. On the defense side, contractors operating in the sector are in a better position, hence the impact of the pandemic is likely low in the short to mid-term. However, low demand due to budget constraints affecting the production as in aircraft manufacturing.

Marine Navigation System Market Segment Overview


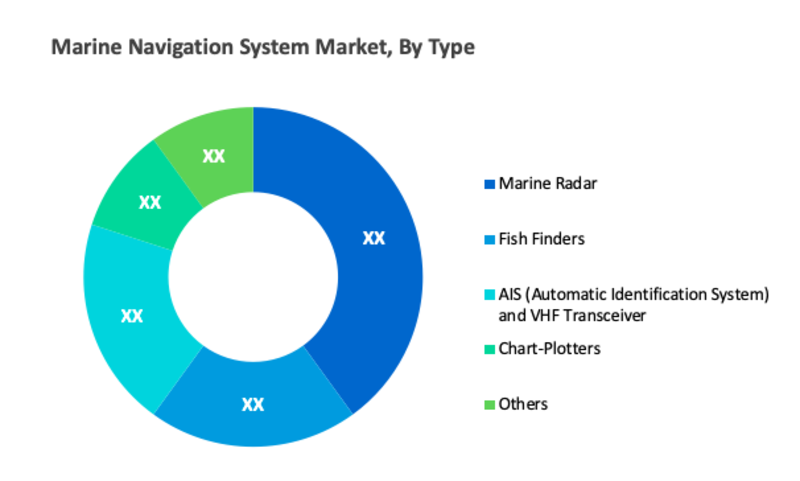
According to Type, the Marine Radar is one of the largest segments in the global Marine Navigation System market.  Marine radars are X band or S-band radars installed on ships that detect other ships and land barriers and offer bearing and distance information for collision avoidance and navigation at sea. They are electronic navigation equipment that sweeps a narrow beam of microwaves over the water surface surrounding the ship to the horizon, identifying targets via microwaves reflected from them, and providing a picture of the ship's surroundings on a display screen.

Marine Navigation System Market, By Type
·       Marine Radar
·       Fish Finders
·       AIS (Automatic Identification System) and VHF Transceiver
·       Chart-Plotters
·       Others
 
Marine Navigation System Market, By Application
·       Ship
·       Remotely Operated Underwater Vehicle
·       Autonomous Underwater Vehicle
·       Others

Marine Navigation System Market, By End-Use
·       Defense 
·       Commercial

Marine Navigation System Regional Overview

In terms of region, North America and Europe are the most prominent regions for the Marine Navigation System market. The strong manufacturing capabilities and demand for marine vessels directly influence the substantial demand for the marine navigation system. This key fact boosts the growth of the market in these regions.  Likewise, the market in the Asia Pacific is anticipated to expand at a rapid pace in the coming years. In addition to this, the government of China and the China Association of the National Shipbuilding Industry are poised to promote the initiatives about the R&D spending to upgrade the industry and building marina navigation systems. These factors are expected to propel the growth of the market in this region.

Marine Navigation System Market, By Geography

·       North America (US & Canada)
·       Europe (UK, Germany, France, Italy, Spain, Russia & Rest of Europe)
·       Asia-Pacific (Japan, China, India, Australia, & South Korea, & Rest of Asia-Pacific)
·       LAMEA (Brazil, Saudi Arabia, UAE & Rest of LAMEA)
 
Marine Navigation System Market, Key Players

·       Elcome International LLC
·       FLIR Systems
·       Garmin Ltd.
·       Icom America Inc
·       Kongsberg Maritime
·       Navico
·       Northrop Grumman Sperry Marine B.V.
·       Raytheon Anschütz
·       Satcom Global
·       Wärtsilä

Frequently Asked Questions (FAQ) :

Q1. What are the driving factors for the Marine Navigation System market?

An increase in seaborne trade, an increase in naval budgets, and an increase in cruise tourism are some most prominent reasons that are boosting the growth of the Marine Navigation System market.

Q2. Which Segments are covered in the Marine Navigation System market report?

Type, Application, End-Use, and Region, these segments are covered in the Marine Navigation System market report.

Q3. Which segment is projected to hold the largest share in the Marine Navigation System Market?

The Marine Radar segment is projected to hold the largest share in the Marine Navigation System Market.

Q4. Which region holds the largest share in the Marine Navigation System market?

North America and Europe are the most prominent regions for the Marine Navigation System market.

Q5. Which are the prominent players in the Marine Navigation System Market?

Elcome International LLC, FLIR Systems, Garmin Ltd., Icom America Inc, Kongsberg Maritime, Navico, Northrop Grumman Sperry Marine B.V., Raytheon Anschütz, Satcom Global, Wärtsilä. are some key players in the Marine Navigation System Market.
Marine Navigation System Market Study Global Market Analysis, Insights and Forecast, 2020-2027

    1. Introduction

    • 1.1. Research Scope
    • 1.2. Market Segmentation
    • 1.3. Research Methodology
    • 1.4. Definitions and Assumptions

    2. Executive Summary

      3. Market Dynamics

      • 3.1. Market Drivers
      • 3.2. Market Restraints
      • 3.3. Market Opportunities

      4. Key Insights

      • 4.1. Key Emerging Trends – For Major Countries
      • 4.2. Latest Technological Advancement
      • 4.3. Regulatory Landscape
      • 4.4. Industry SWOT Analysis
      • 4.5. Porters Five Forces Analysis

      5. Global Marine Navigation System Market Analysis (USD Billion), Insights and Forecast, 2020-2027

      • 5.1. Key Findings / Summary
      • 5.2. Market Analysis, Insights and Forecast – By Type
        • 5.2.1. Marine Radar
        • 5.2.2. Fish Finders
        • 5.2.3. AIS (Automatic Identification System) and VHF Transceiver
        • 5.2.4. Chart-Plotters
        • 5.2.5. Others
      • 5.3. Market Analysis, Insights and Forecast – By Application
        • 5.3.1. Ship
        • 5.3.2. Remotely Operated Underwater Vehicle
        • 5.3.3. Autonomous Underwater Vehicle
        • 5.3.4. Others
      • 5.4. Market Analysis, Insights and Forecast – By End-Use
        • 5.4.1. Defense
        • 5.4.2. Commercial
      • 5.5. Market Analysis, Insights and Forecast – By Region
        • 5.5.1. North America
        • 5.5.2. Europe
        • 5.5.3. Asia Pacific
        • 5.5.4. Latin America, Middle East and Africa

      6. North America Marine Navigation System Market Analysis (USD Billion), Insights and Forecast, 2020-2027

      • 6.1. Key Findings / Summary
      • 6.2. Market Analysis, Insights and Forecast – By Type
        • 6.2.1. Marine Radar
        • 6.2.2. Fish Finders
        • 6.2.3. AIS (Automatic Identification System) and VHF Transceiver
        • 6.2.4. Chart-Plotters
        • 6.2.5. Others
      • 6.3. Market Analysis, Insights and Forecast – By Application
        • 6.3.1. Ship
        • 6.3.2. Remotely Operated Underwater Vehicle
        • 6.3.3. Autonomous Underwater Vehicle
        • 6.3.4. Others
      • 6.4. Market Analysis, Insights and Forecast – By End-Use
        • 6.4.1. Defense
        • 6.4.2. Commercial
      • 6.5. Market Analysis, Insights and Forecast – By Country
        • 6.5.1. U.S.
        • 6.5.2. Canada

      7. Europe Marine Navigation System Market Analysis (USD Billion), Insights and Forecast, 2020-2027

      • 7.1. Key Findings / Summary
      • 7.2. Market Analysis, Insights and Forecast – By Type
        • 7.2.1. Marine Radar
        • 7.2.2. Fish Finders
        • 7.2.3. AIS (Automatic Identification System) and VHF Transceiver
        • 7.2.4. Chart-Plotters
        • 7.2.5. Others
      • 7.3. Market Analysis, Insights and Forecast – By Application
        • 7.3.1. Ship
        • 7.3.2. Remotely Operated Underwater Vehicle
        • 7.3.3. Autonomous Underwater Vehicle
        • 7.3.4. Others
      • 7.4. Market Analysis, Insights and Forecast – By End-Use
        • 7.4.1. Defense
        • 7.4.2. Commercial
      • 7.5. Market Analysis, Insights and Forecast – By Country
        • 7.5.1. UK
        • 7.5.2. Germany
        • 7.5.3. France
        • 7.5.4. Italy
        • 7.5.5. Spain
        • 7.5.6. Russia
        • 7.5.7. Rest of Europe

      8. Asia Pacific Marine Navigation System Market Analysis (USD Billion), Insights and Forecast, 2020-2027

      • 8.1. Key Findings / Summary
      • 8.2. Market Analysis, Insights and Forecast – By Type
        • 8.2.1. Marine Radar
        • 8.2.2. Fish Finders
        • 8.2.3. AIS (Automatic Identification System) and VHF Transceiver
        • 8.2.4. Chart-Plotters
        • 8.2.5. Others
      • 8.3. Market Analysis, Insights and Forecast – By Application
        • 8.3.1. Ship
        • 8.3.2. Remotely Operated Underwater Vehicle
        • 8.3.3. Autonomous Underwater Vehicle
        • 8.3.4. Others
      • 8.4. Market Analysis, Insights and Forecast – By End-Use
        • 8.4.1. Defense
        • 8.4.2. Commercial
      • 8.5. Market Analysis, Insights and Forecast – By Country
        • 8.5.1. China
        • 8.5.2. India
        • 8.5.3. Japan
        • 8.5.4. Australia
        • 8.5.5. South East Asia
        • 8.5.6. Rest of Asia Pacific

      9. Latin America, Middle East and Africa Marine Navigation System Market Analysis (USD Billion), Insights and Forecast, 2020-2027

      • 9.1. Key Findings / Summary
      • 9.2. Market Analysis, Insights and Forecast – By Type
        • 9.2.1. Marine Radar
        • 9.2.2. Fish Finders
        • 9.2.3. AIS (Automatic Identification System) and VHF Transceiver
        • 9.2.4. Chart-Plotters
        • 9.2.5. Others
      • 9.3. Market Analysis, Insights and Forecast – By Application
        • 9.3.1. Ship
        • 9.3.2. Remotely Operated Underwater Vehicle
        • 9.3.3. Autonomous Underwater Vehicle
        • 9.3.4. Others
      • 9.4. Market Analysis, Insights and Forecast – By End-Use
        • 9.4.1. Defense
        • 9.4.2. Commercial
      • 9.5. Market Analysis, Insights and Forecast – By Country
        • 9.5.1. Brazil
        • 9.5.2. Saudi Arabia
        • 9.5.3. UAE
        • 9.5.4. Rest of LAMEA

      10. Competitive Analysis

      • 10.1. Company Market Share Analysis, 2018
      • 10.2. Key Industry Developments
      • 10.3. Company Profile
      • 10.4. Elcome International LLC
        • 10.4.1. Business Overview
        • 10.4.2. Segment 1 & Service Offering
        • 10.4.3. Overall Revenue
        • 10.4.4. Geographic Presence
        • 10.4.5. Recent Development
      *Similar details will be provided for the following companies
      • 10.5. FLIR Systems
      • 10.6. Garmin Ltd.
      • 10.7. Icom America Inc
      • 10.8. Kongsberg Maritime
      • 10.9. Navico
      • 10.10. Northrop Grumman Sperry Marine B.V.
      • 10.11. Raytheon Anschütz
      • 10.12. Satcom Global
      List of Figures

      Figure 1: Global Marine Navigation System Market Revenue Breakdown (USD Billion, %) by Region, 2019 & 2027
      Figure 2: Global Market Value Share (%), By Segment 1, 2019 & 2027
      Figure 3: Global Market Forecast (USD Billion), by Sub-Segment 1, 2016-2027
      Figure 4: Global Market Forecast (USD Billion), by Sub-Segment 2, 2016-2027
      Figure 5: Global Market Value Share (%), By Segment 2, 2019 & 2027
      Figure 6: Global Market Forecast (USD Billion), by Sub-Segment 1, 2016-2027
      Figure 7: Global Market Forecast (USD Billion), by Sub-Segment 2, 2016-2027
      Figure 8: Global Market Forecast (USD Billion), by Sub-Segment 3, 2016-2027
      Figure 9: Global Marine Navigation System Market Forecast (USD Billion), by Others, 2016-2027
      Figure 10: Global Market Value Share (%), By Segment 3, 2019 & 2027
      Figure 11: Global Market Forecast (USD Billion), by Sub-Segment 1, 2016-2027
      Figure 12: Global Market Forecast (USD Billion), by Sub-Segment 2, 2016-2027
      Figure 13: Global Market Forecast (USD Billion), by Sub-Segment 3, 2016-2027
      Figure 14: Global Market Forecast (USD Billion), by Others, 2016-2027
      Figure 15: Global Market Value (USD Billion), by Region, 2019 & 2027
      Figure 16: North America Marine Navigation System Market Value Share (%), By Segment 1, 2019 & 2027
      Figure 17: North America Market Forecast (USD Billion), by Sub-Segment 1, 2016-2027
      Figure 18: North America Market Forecast (USD Billion), by Sub-Segment 2, 2016-2027
      Figure 19: North America Market Value Share (%), By Segment 2, 2019 & 2027
      Figure 20: North America Market Forecast (USD Billion), by Sub-Segment 1, 2016-2027
      Figure 21: North America Market Forecast (USD Billion), by Sub-Segment 2, 2016-2027
      Figure 22: North America Market Forecast (USD Billion), by Sub-Segment 3, 2016-2027
      Figure 23: North America Market Forecast (USD Billion), by Others, 2016-2027
      Figure 24: North America Market Value Share (%), By Segment 3, 2019 & 2027
      Figure 25: North America Market Forecast (USD Billion), by Sub-Segment 1, 2016-2027
      Figure 26: North America Market Forecast (USD Billion), by Sub-Segment 2, 2016-2027
      Figure 27: North America Market Forecast (USD Billion), by Sub-Segment 3, 2016-2027
      Figure 28: North America Market Forecast (USD Billion), by Others, 2016-2027
      Figure 29: North America Market Forecast (USD Billion), by U.S., 2016-2027
      Figure 30: North America Market Forecast (USD Billion), by Canada, 2016-2027
      Figure 31: Latin America Marine Navigation System Market Value Share (%), By Segment 1, 2019 & 2027
      Figure 32: Latin America Market Forecast (USD Billion), by Sub-Segment 1, 2016-2027
      Figure 33: Latin America Market Forecast (USD Billion), by Sub-Segment 2, 2016-2027
      Figure 34: Latin America Market Value Share (%), By Segment 2, 2019 & 2027
      Figure 35: Latin America Market Forecast (USD Billion), by Sub-Segment 1, 2016-2027
      Figure 36: Latin America Market Forecast (USD Billion), by Sub-Segment 2, 2016-2027
      Figure 37: Latin America Market Forecast (USD Billion), by Sub-Segment 3, 2016-2027
      Figure 38: Latin America Market Forecast (USD Billion), by Others, 2016-2027
      Figure 39: Latin America Market Value Share (%), By Segment 3, 2019 & 2027
      Figure 40: Latin America Market Forecast (USD Billion), by Sub-Segment 1, 2016-2027
      Figure 41: Latin America Market Forecast (USD Billion), by Sub-Segment 2, 2016-2027
      Figure 42: Latin America Market Forecast (USD Billion), by Sub-Segment 3, 2016-2027
      Figure 43: Latin America Market Forecast (USD Billion), by Others, 2016-2027
      Figure 44: Latin America Market Forecast (USD Billion), by Brazil, 2016-2027
      Figure 45: Latin America Market Forecast (USD Billion), by Mexico, 2016-2027
      Figure 46: Latin America Market Forecast (USD Billion), by Rest of Latin America, 2016-2027
      Figure 47: Europe Marine Navigation System Market Value Share (%), By Segment 1, 2019 & 2027
      Figure 48: Europe Market Forecast (USD Billion), by Sub-Segment 1, 2016-2027
      Figure 49: Europe Market Forecast (USD Billion), by Sub-Segment 2, 2016-2027
      Figure 50: Europe Market Value Share (%), By Segment 2, 2019 & 2027
      Figure 51: Europe Market Forecast (USD Billion), by Sub-Segment 1, 2016-2027
      Figure 52: Europe Market Forecast (USD Billion), by Sub-Segment 2, 2016-2027
      Figure 53: Europe Market Forecast (USD Billion), by Sub-Segment 3, 2016-2027
      Figure 54: Europe Market Forecast (USD Billion), by Others, 2016-2027
      Figure 55: Europe Market Value Share (%), By Segment 3, 2019 & 2027
      Figure 56: Europe Market Forecast (USD Billion), by Sub-Segment 1, 2016-2027
      Figure 57: Europe Market Forecast (USD Billion), by Sub-Segment 2, 2016-2027
      Figure 58: Europe Market Forecast (USD Billion), by Sub-Segment 3, 2016-2027
      Figure 59: Europe Market Forecast (USD Billion), by Others, 2016-2027
      Figure 60: Europe Market Forecast (USD Billion), by U.K., 2016-2027
      Figure 61: Europe Market Forecast (USD Billion), by Germany, 2016-2027
      Figure 62: Europe Market Forecast (USD Billion), by France, 2016-2027
      Figure 63: Europe Market Forecast (USD Billion), by Italy, 2016-2027
      Figure 64: Europe Market Forecast (USD Billion), by Spain, 2016-2027
      Figure 65: Europe Market Forecast (USD Billion), by Russia, 2016-2027
      Figure 66: Europe Market Forecast (USD Billion), by Rest of Europe, 2016-2027
      Figure 67: Asia Pacific Marine Navigation System Market Value Share (%), By Segment 1, 2019 & 2027
      Figure 68: Asia Pacific Market Forecast (USD Billion), by Sub-Segment 1, 2016-2027
      Figure 69: Asia Pacific Market Forecast (USD Billion), by Sub-Segment 2, 2016-2027
      Figure 70: Asia Pacific Market Value Share (%), By Segment 2, 2019 & 2027
      Figure 71: Asia Pacific Market Forecast (USD Billion), by Sub-Segment 1, 2016-2027
      Figure 72: Asia Pacific Market Forecast (USD Billion), by Sub-Segment 2, 2016-2027
      Figure 73: Asia Pacific Market Forecast (USD Billion), by Sub-Segment 3, 2016-2027
      Figure 74: Asia Pacific Market Forecast (USD Billion), by Others, 2016-2027
      Figure 75: Asia Pacific Market Value Share (%), By Segment 3, 2019 & 2027
      Figure 76: Asia Pacific Market Forecast (USD Billion), by Sub-Segment 1, 2016-2027
      Figure 77: Asia Pacific Market Forecast (USD Billion), by Sub-Segment 2, 2016-2027
      Figure 78: Asia Pacific Market Forecast (USD Billion), by Sub-Segment 3, 2016-2027
      Figure 79: Asia Pacific Market Forecast (USD Billion), by Others, 2016-2027
      Figure 80: Asia Pacific Market Forecast (USD Billion), by China, 2016-2027
      Figure 81: Asia Pacific Market Forecast (USD Billion), by India, 2016-2027
      Figure 82: Asia Pacific Market Forecast (USD Billion), by Japan, 2016-2027
      Figure 83: Asia Pacific Market Forecast (USD Billion), by Australia, 2016-2027
      Figure 84: Asia Pacific Market Forecast (USD Billion), by Southeast Asia, 2016-2027
      Figure 85: Asia Pacific Market Forecast (USD Billion), by Rest of Asia Pacific, 2016-2027
      Figure 86: Middle East & Africa Marine Navigation System Market Value Share (%), By Segment 1, 2019 & 2027
      Figure 87: Middle East & Africa Market Forecast (USD Billion), by Sub-Segment 1, 2016-2027
      Figure 88: Middle East & Africa Market Forecast (USD Billion), by Sub-Segment 2, 2016-2027
      Figure 89: Middle East & Africa Market Value Share (%), By Segment 2, 2019 & 2027
      Figure 90: Middle East & Africa Market Forecast (USD Billion), by Sub-Segment 1, 2016-2027
      Figure 91: Middle East & Africa Market Forecast (USD Billion), by Sub-Segment 2, 2016-2027
      Figure 92: Middle East & Africa Market Forecast (USD Billion), by Sub-Segment 3, 2016-2027
      Figure 93: Middle East & Africa Market Forecast (USD Billion), by Others, 2016-2027
      Figure 94: Middle East & Africa Market Value Share (%), By Segment 3, 2019 & 2027
      Figure 95: Middle East & Africa Market Forecast (USD Billion), by Sub-Segment 1, 2016-2027
      Figure 96: Middle East & Africa Market Forecast (USD Billion), by Sub-Segment 2, 2016-2027
      Figure 97: Middle East & Africa Market Forecast (USD Billion), by Sub-Segment 3, 2016-2027
      Figure 98: Middle East & Africa Market Forecast (USD Billion), by Others, 2016-2027
      Figure 99: Middle East & Africa Market Forecast (USD Billion), by GCC, 2016-2027
      Figure 100: Middle East & Africa Market Forecast (USD Billion), by South Africa, 2016-2027
      Figure 101: Middle East & Africa Market Forecast (USD Billion), by Rest of Middle East & Africa, 2016-2027 
      List of Tables
      Table 1: Global Marine Navigation System Market Revenue (USD Billion) Forecast, by Segment 1, 2016-2027
      Table 2: Global Market Revenue (USD Billion) Forecast, by Segment 2, 2016-2027
      Table 3: Global Market Revenue (USD Billion) Forecast, by Segment 3, 2016-2027
      Table 4: Global Market Revenue (USD Billion) Forecast, by Region, 2016-2027
      Table 5: North America Marine Navigation System Market Revenue (USD Billion) Forecast, by Segment 1, 2016-2027
      Table 6: North America Market Revenue (USD Billion) Forecast, by Segment 2, 2016-2027
      Table 7: North America Market Revenue (USD Billion) Forecast, by Segment 3, 2016-2027
      Table 8: North America Market Revenue (USD Billion) Forecast, by Country, 2016-2027
      Table 9: Europe Marine Navigation System Market Revenue (USD Billion) Forecast, by Segment 1, 2016-2027
      Table 10: Europe Market Revenue (USD Billion) Forecast, by Segment 2, 2016-2027
      Table 11: Europe Market Revenue (USD Billion) Forecast, by Segment 3, 2016-2027
      Table 12: Europe Market Revenue (USD Billion) Forecast, by Country, 2016-2027
      Table 13: Latin America Marine Navigation System Market Revenue (USD Billion) Forecast, by Segment 1, 2016-2027
      Table 14: Latin America Market Revenue (USD Billion) Forecast, by Segment 2, 2016-2027
      Table 15: Latin America Market Revenue (USD Billion) Forecast, by Segment 3, 2016-2027
      Table 16: Latin America Market Revenue (USD Billion) Forecast, by Country, 2016-2027
      Table 17: Asia Pacific Marine Navigation System Market Revenue (USD Billion) Forecast, by Segment 1, 2016-2027
      Table 18: Asia Pacific Market Revenue (USD Billion) Forecast, by Segment 2, 2016-2027
      Table 19: Asia Pacific Market Revenue (USD Billion) Forecast, by Segment 3, 2016-2027
      Table 20: Asia Pacific Market Revenue (USD Billion) Forecast, by Country, 2016-2027
      Table 21: Middle East & Africa Marine Navigation System Market Revenue (USD Billion) Forecast, by Segment 1, 2016-2027
      Table 22: Middle East & Africa Market Revenue (USD Billion) Forecast, by Segment 2, 2016-2027
      Table 23: Middle East & Africa Market Revenue (USD Billion) Forecast, by Segment 3, 2016-2027
      Table 24: Middle East & Africa Market Revenue (USD Billion) Forecast, by Country, 2016-2027
      Research Process

      Data Library Research are conducted by industry experts who offer insight on industry structure, market segmentations technology assessment and competitive landscape (CL), and penetration, as well as on emerging trends. Their analysis is based on primary interviews (~ 80%) and secondary research (~ 20%) as well as years of professional expertise in their respective industries. Adding to this, by analysing historical trends and current market positions, our analysts predict where the market will be headed for the next five years. Furthermore, the varying trends of segment & categories geographically presented are also studied and the estimated based on the primary & secondary research.

      In this particular report from the supply side Data Library Research has conducted primary surveys (interviews) with the key level executives (VP, CEO’s, Marketing Director, Business Development Manager and SOFT) of the companies that active & prominent as well as the midsized organization

      FIGURE 1: DLR RESEARH PROCESS

      research-methodology1

      Primary Research

      Extensive primary research was conducted to gain a deeper insight of the market and industry performance. The analysis is based on both primary and secondary research as well as years of professional expertise in the respective industries.

      In addition to analysing current and historical trends, our analysts predict where the market is headed over the next five years.

      It varies by segment for these categories geographically presented in the list of market tables. Speaking about this particular report we have conducted primary surveys (interviews) with the key level executives (VP, CEO’s, Marketing Director, Business Development Manager and many more) of the major players active in the market.

      Secondary Research

      Secondary research was mainly used to collect and identify information useful for the extensive, technical, market-oriented, and Friend’s study of the Global Extra Neutral Alcohol. It was also used to obtain key information about major players, market classification and segmentation according to the industry trends, geographical markets, and developments related to the market and technology perspectives. For this study, analysts have gathered information from various credible sources, such as annual reports, sec filings, journals, white papers, SOFT presentations, and company web sites.

      Market Size Estimation

      Both, top-down and bottom-up approaches were used to estimate and validate the size of the Global market and to estimate the size of various other dependent submarkets in the overall Extra Neutral Alcohol. The key players in the market were identified through secondary research and their market contributions in the respective geographies were determined through primary and secondary research.

      Forecast Model

      research-methodology2