Global SCADA Market Opportunities and Forecast 2023-2030

  •   DLR2000
  •   March, 2022
  •   Pages: 120
  •  Global
SCADA Market Overview

The growing importance of real-time data in industrial contexts for process analysis and predictive maintenance, as well as the expanding need for industrial robots, are driving the adoption of Industry 4.0. Most industrial processes and systems can be automated with Industry 4.0, allowing manufacturing units to run around the clock. It also eliminates the human errors that are common in manufacturing operations. Cyber-physical systems, IoT, and cloud computing are all part of Industry 4.0. It consists of automation infrastructure, such as SCADA or IoT, that allows a remote operator to carry out industrial processes, and real-time data is gathered efficiently to assure optimal operations.
 
SCADA systems enable real-time reporting to gather current and historical data as well as forecast future events. As a result, in smart factories, using a SCADA system allows operators to foresee machine maintenance needs, schedule production accordingly, and avoid emergencies and equipment failure during the manufacture of valuable products. Each of these factors is anticipated to have a definite impact on the SCADA Market during the forecast period.
 
On the other hand, the fluctuation in oil prices is impeding the growth of the market because the oil & gas industry is a key end-user of SCADA systems.

Report Metric Details
Market size available for years 2023–2030
Base year considered 2023
Forecast period 2024–2030
Forecast unit Value (USD Million)
Segments covered Offering, Component, End User, and Region.
Regions covered North America (the U.S. and Canada), Europe (UK, Germany, France, Italy, Spain, Russia, Rest of Europe), Asia-Pacific (China, India, Japan, Australia, South East Asia, Rest of Asia Pacific), Latin America and the Middle East and Africa (Brazil, Saudi Arabia, UAE, Rest of LAMEA)
Companies covered Schneider Electric, Emerson Electric, Rockwell Automation, ABB, Siemens, Honewell International, Mitsubishi Electric.


Covid-19 Impact on SCADA Market

Like many other industries, COVID-19 badly knocked the electronic and semiconductor industries. This unprecedented event has impacted nearly 230 countries in just a few weeks, resulting in the forced shutdown of manufacturing and transportation activities within and across the countries. This has directly affected the overall sector's growth. It is estimated that COVID-19 to leave more than USD 30 billion impacts on the electronics and semiconductor industry. The sector is majorly affected due to transport restrictions on major electronics and semiconductor raw material providers. However, the emerging need for semiconductors in several industries will offer rapid market recovery over the future period.

SCADA Market Segment Overview


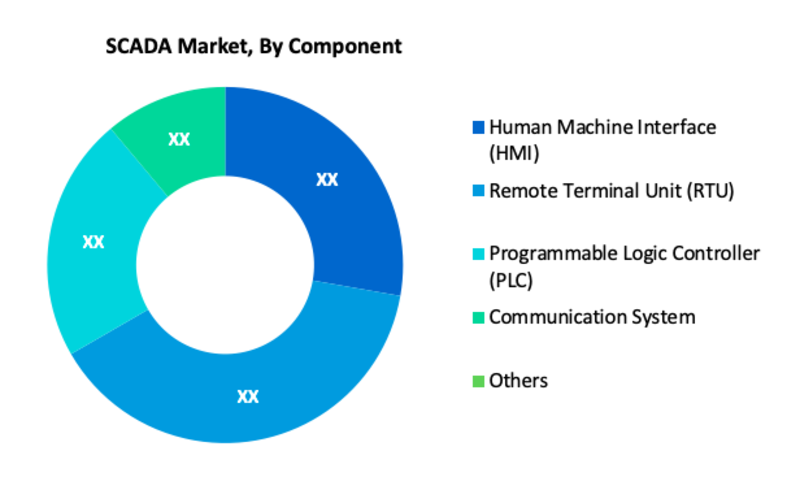
According to Component, Remote Terminal Unit (RTU) is expected to hold the largest share in the global SCADA market. In a SCADA system, an RTU is an electrical device that is one of the system's basic components. It collects data, converts it to a transmittable format, and sends it to the main system. This is accomplished by the use of several RTUs in a SCADA system. Oil and gas is the most common end-user industry for SCADA systems, so deep-sea exploration and extraction, as well as shale gas, contribute to the expanding need for RTUs.
 
SCADA Market, By Offering
·       Hardware
·       Software
·       Services
 
SCADA Market, By Component
·       Human Machine Interface (HMI)
·       Remote Terminal Unit (RTU)
·       Programmable Logic Controller (PLC)
·       Communication System
·       Others

SCADA Market, By End User
  • Process Industry
    • Chemicals
    • Pharmaceuticals
    • Food & beverages
    • Oil & gas
  • Discrete Manufacturing
    • Semiconductor & Electronics
    • Automotive
    • Others
  • Utilities
    • Power
    • Water & wastewater
    • Transportation
    • Telecommunications
SCADA Market Regional Overview

Region-Wise, the market in the Asia Pacific is projected to grow at a significant rate in the forthcoming years. Because of the presence of large firms like Yokogawa Electric, Mitsubishi Electric, and OMRON, APAC is the production hub for automation technologies. Renewable energy, smart grids, water & wastewater, and transportation are expected to drive the SCADA market in APAC to new heights. Because of the growing need for high-quality products and faster production rates, automation is developing in APAC.

SCADA Market, By Geography

·       North America (US & Canada)
·       Europe (UK, Germany, France, Italy, Spain, Russia & Rest of Europe)
·       Asia-Pacific (Japan, China, India, Australia, & South Korea, & Rest of Asia-Pacific)
·       LAMEA (Brazil, Saudi Arabia, UAE & Rest of LAMEA)
 
SCADA Market, Key Players

·       Schneider Electric
·       Emerson Electric
·       Rockwell Automation
·       ABB
·       Siemens
·       Honeywell International
·       Mitsubishi Electric

Frequently Asked Questions (FAQ) :

Q1. What are the driving factors for the Global SCADA market?

The growth of the market is primarily driven by the increased adoption of Industry 4.0 solutions using SCADA systems.

Q2. What are the restraining factors for the Global SCADA market?

The fluctuation in oil prices is impeding the growth of the market because the oil & gas industry is a key end-user of SCADA systems

Q3. Which segment is projected to hold the largest share in the Global SCADA Market. ?

Remote Terminal Unit (RTU) segment is projected to hold the largest share in the Global SCADA Market.

Q4. Which region holds the largest share in the global SCADA market?

Asia Pacific held the largest share in the global SCADA market

Q5. Which are the prominent players in the Global SCADA Market?

Schneider Electric, Emerson Electric, Rockwell Automation, ABB, Siemens, Honeywell International, Mitsubishi Electric. are some key players in the Global SCADA Market.
SCADA Market Study Global Market Analysis, Insights and Forecast, 2020-2027

    1. Introduction

    • 1.1. Research Scope
    • 1.2. Market Segmentation
    • 1.3. Research Methodology
    • 1.4. Definitions and Assumptions

    2. Executive Summary

      3. Market Dynamics

      • 3.1. Market Drivers
      • 3.2. Market Restraints
      • 3.3. Market Opportunities

      4. Key Insights

      • 4.1. Key Emerging Trends – For Major Countries
      • 4.2. Latest Technological Advancement
      • 4.3. Regulatory Landscape
      • 4.4. Industry SWOT Analysis
      • 4.5. Porters Five Forces Analysis

      5. Global SCADA Market Analysis (USD Billion), Insights and Forecast, 2020-2027

      • 5.1. Key Findings / Summary
      • 5.2. Market Analysis, Insights and Forecast – By Offering
        • 5.2.1. Hardware
        • 5.2.2. Software
        • 5.2.3. Services
      • 5.3. Market Analysis, Insights and Forecast – By Component
        • 5.3.1. Human Machine Interface (HMI)
        • 5.3.2. Remote Terminal Unit (RTU)
        • 5.3.3. Programmable Logic Controller (PLC)
        • 5.3.4. Communication System
        • 5.3.5. Others
      • 5.4. Market Analysis, Insights and Forecast – By End User
        • 5.4.1. Process Industry
          • 5.4.1.1. Chemicals
          • 5.4.1.2. Pharmaceuticals
          • 5.4.1.3. Food & beverages
          • 5.4.1.4. Oil & gas
        • 5.4.2. Discrete Manufacturing
          • 5.4.2.1. Semiconductor & Electronics
          • 5.4.2.2. Automotive
          • 5.4.2.3. Others
        • 5.4.3. Utilities
          • 5.4.3.1. Power
          • 5.4.3.2. Water & wastewater
          • 5.4.3.3. Transportation
          • 5.4.3.4. Telecommunications
    • 5.5. Market Analysis, Insights and Forecast – By Region
      • 5.5.1. North America
      • 5.5.2. Europe
      • 5.5.3. Asia Pacific
      • 5.5.4. Latin America, Middle East and Africa
    • 6. North America SCADA Market Analysis (USD Billion), Insights and Forecast, 2020-2027

      • 6.1. Key Findings / Summary
      • 6.2. Market Analysis, Insights and Forecast – By Offering
        • 6.2.1. Hardware
        • 6.2.2. Software
        • 6.2.3. Services
      • 6.3. Market Analysis, Insights and Forecast – By Component
        • 6.3.1. Human Machine Interface (HMI)
        • 6.3.2. Remote Terminal Unit (RTU)
        • 6.3.3. Programmable Logic Controller (PLC)
        • 6.3.4. Communication System
        • 6.3.5. Others
      • 6.4. Market Analysis, Insights and Forecast – By End User
        • 6.4.1. Process Industry
          • 6.4.1.1. Chemicals
          • 6.4.1.2. Pharmaceuticals
          • 6.4.1.3. Food & beverages
          • 6.4.1.4. Oil & gas
        • 6.4.2. Discrete Manufacturing
          • 6.4.2.1. Semiconductor & Electronics
          • 6.4.2.2. Automotive
          • 6.4.2.3. Others
        • 6.4.3. Utilities
          • 6.4.3.1. Power
          • 6.4.3.2. Water & wastewater
          • 6.4.3.3. Transportation
          • 6.4.3.4. Telecommunications
    • 6.5. Market Analysis, Insights and Forecast – By Country
      • 6.5.1. U.S.
      • 6.5.2. Canada
    • 7. Europe SCADA Market Analysis (USD Billion), Insights and Forecast, 2020-2027

      • 7.1. Key Findings / Summary
      • 7.2. Market Analysis, Insights and Forecast – By Offering
        • 7.2.1. Hardware
        • 7.2.2. Software
        • 7.2.3. Services
      • 7.3. Market Analysis, Insights and Forecast – By Component
        • 7.3.1. Human Machine Interface (HMI)
        • 7.3.2. Remote Terminal Unit (RTU)
        • 7.3.3. Programmable Logic Controller (PLC)
        • 7.3.4. Communication System
        • 7.3.5. Others
      • 7.4. Market Analysis, Insights and Forecast – By End User
        • 7.4.1. Process Industry
          • 7.4.1.1. Chemicals
          • 7.4.1.2. Pharmaceuticals
          • 7.4.1.3. Food & beverages
          • 7.4.1.4. Oil & gas
        • 7.4.2. Discrete Manufacturing
          • 7.4.2.1. Semiconductor & Electronics
          • 7.4.2.2. Automotive
          • 7.4.2.3. Others
        • 7.4.3. Utilities
          • 7.4.3.1. Power
          • 7.4.3.2. Water & wastewater
          • 7.4.3.3. Transportation
          • 7.4.3.4. Telecommunications
    • 7.5. Market Analysis, Insights and Forecast – By Country
      • 7.5.1. UK
      • 7.5.2. Germany
      • 7.5.3. France
      • 7.5.4. Italy
      • 7.5.5. Spain
      • 7.5.6. Russia
      • 7.5.7. Rest of Europe
    • 8. Asia Pacific SCADA Market Analysis (USD Billion), Insights and Forecast, 2020-2027

      • 8.1. Key Findings / Summary
      • 8.2. Market Analysis, Insights and Forecast – By Offering
        • 8.2.1. Hardware
        • 8.2.2. Software
        • 8.2.3. Services
      • 8.3. Market Analysis, Insights and Forecast – By Component
        • 8.3.1. Human Machine Interface (HMI)
        • 8.3.2. Remote Terminal Unit (RTU)
        • 8.3.3. Programmable Logic Controller (PLC)
        • 8.3.4. Communication System
        • 8.3.5. Others
      • 8.4. Market Analysis, Insights and Forecast – By End User
        • 8.4.1. Process Industry
          • 8.4.1.1. Chemicals
          • 8.4.1.2. Pharmaceuticals
          • 8.4.1.3. Food & beverages
          • 8.4.1.4. Oil & gas
        • 8.4.2. Discrete Manufacturing
          • 8.4.2.1. Semiconductor & Electronics
          • 8.4.2.2. Automotive
          • 8.4.2.3. Others
        • 8.4.3. Utilities
          • 8.4.3.1. Power
          • 8.4.3.2. Water & wastewater
          • 8.4.3.3. Transportation
          • 8.4.3.4. Telecommunications
    • 8.5. Market Analysis, Insights and Forecast – By Country
      • 8.5.1. China
      • 8.5.2. India
      • 8.5.3. Japan
      • 8.5.4. Australia
      • 8.5.5. South East Asia
      • 8.5.6. Rest of Asia Pacific
    • 9. Latin America, Middle East and Africa SCADA Market Analysis (USD Billion), Insights and Forecast, 2020-2027

      • 9.1. Key Findings / Summary
      • 9.2. Market Analysis, Insights and Forecast – By Offering
        • 9.2.1. Hardware
        • 9.2.2. Software
        • 9.2.3. Services
      • 9.3. Market Analysis, Insights and Forecast – By Component
        • 9.3.1. Human Machine Interface (HMI)
        • 9.3.2. Remote Terminal Unit (RTU)
        • 9.3.3. Programmable Logic Controller (PLC)
        • 9.3.4. Communication System
        • 9.3.5. Others
      • 9.4. Market Analysis, Insights and Forecast – By End User
        • 9.4.1. Process Industry
          • 9.4.1.1. Chemicals
          • 9.4.1.2. Pharmaceuticals
          • 9.4.1.3. Food & beverages
          • 9.4.1.4. Oil & gas
        • 9.4.2. Discrete Manufacturing
          • 9.4.2.1. Semiconductor & Electronics
          • 9.4.2.2. Automotive
          • 9.4.2.3. Others
        • 9.4.3. Utilities
          • 9.4.3.1. Power
          • 9.4.3.2. Water & wastewater
          • 9.4.3.3. Transportation
          • 9.4.3.4. Telecommunications
    • 9.5. Market Analysis, Insights and Forecast – By Country
      • 9.5.1. Brazil
      • 9.5.2. Saudi Arabia
      • 9.5.3. UAE
      • 9.5.4. Rest of LAMEA
    • 10. Competitive Analysis

      • 10.1. Company Market Share Analysis, 2018
      • 10.2. Key Industry Developments
      • 10.3. Company Profile
      • 10.4. Schneider Electric
        • 10.4.1. Business Overview
        • 10.4.2. Segment 1 & Service Offering
        • 10.4.3. Overall Revenue
        • 10.4.4. Geographic Presence
        • 10.4.5. Recent Development
      *Similar details will be provided for the following companies
      • 10.5. Emerson Electric
      • 10.6. Rockwell Automation
      • 10.7. ABB
      • 10.8. Siemens
      • 10.9. Honeywell International
      List of Figures

      Figure 1: Global SCADA Market Revenue Breakdown (USD Billion, %) by Region, 2019 & 2027
      Figure 2: Global Market Value Share (%), By Segment 1, 2019 & 2027
      Figure 3: Global Market Forecast (USD Billion), by Sub-Segment 1, 2016-2027
      Figure 4: Global Market Forecast (USD Billion), by Sub-Segment 2, 2016-2027
      Figure 5: Global Market Value Share (%), By Segment 2, 2019 & 2027
      Figure 6: Global Market Forecast (USD Billion), by Sub-Segment 1, 2016-2027
      Figure 7: Global Market Forecast (USD Billion), by Sub-Segment 2, 2016-2027
      Figure 8: Global Market Forecast (USD Billion), by Sub-Segment 3, 2016-2027
      Figure 9: Global Market Forecast (USD Billion), by Others, 2016-2027
      Figure 10: Global SCADA Market Value Share (%), By Segment 3, 2019 & 2027
      Figure 11: Global Market Forecast (USD Billion), by Sub-Segment 1, 2016-2027
      Figure 12: Global Market Forecast (USD Billion), by Sub-Segment 2, 2016-2027
      Figure 13: Global Market Forecast (USD Billion), by Sub-Segment 3, 2016-2027
      Figure 14: Global Market Forecast (USD Billion), by Others, 2016-2027
      Figure 15: Global Market Value (USD Billion), by Region, 2019 & 2027
      Figure 16: North America SCADA Market Value Share (%), By Segment 1, 2019 & 2027
      Figure 17: North America Market Forecast (USD Billion), by Sub-Segment 1, 2016-2027
      Figure 18: North America Market Forecast (USD Billion), by Sub-Segment 2, 2016-2027
      Figure 19: North America Market Value Share (%), By Segment 2, 2019 & 2027
      Figure 20: North America Market Forecast (USD Billion), by Sub-Segment 1, 2016-2027
      Figure 21: North America Market Forecast (USD Billion), by Sub-Segment 2, 2016-2027
      Figure 22: North America Market Forecast (USD Billion), by Sub-Segment 3, 2016-2027
      Figure 23: North America Market Forecast (USD Billion), by Others, 2016-2027
      Figure 24: North America Market Value Share (%), By Segment 3, 2019 & 2027
      Figure 25: North America Market Forecast (USD Billion), by Sub-Segment 1, 2016-2027
      Figure 26: North America Market Forecast (USD Billion), by Sub-Segment 2, 2016-2027
      Figure 27: North America Market Forecast (USD Billion), by Sub-Segment 3, 2016-2027
      Figure 28: North America Market Forecast (USD Billion), by Others, 2016-2027
      Figure 29: North America Market Forecast (USD Billion), by U.S., 2016-2027
      Figure 30: North America Market Forecast (USD Billion), by Canada, 2016-2027
      Figure 31: Latin America SCADA Market Value Share (%), By Segment 1, 2019 & 2027
      Figure 32: Latin America Market Forecast (USD Billion), by Sub-Segment 1, 2016-2027
      Figure 33: Latin America Market Forecast (USD Billion), by Sub-Segment 2, 2016-2027
      Figure 34: Latin America Market Value Share (%), By Segment 2, 2019 & 2027
      Figure 35: Latin America Market Forecast (USD Billion), by Sub-Segment 1, 2016-2027
      Figure 36: Latin America Market Forecast (USD Billion), by Sub-Segment 2, 2016-2027
      Figure 37: Latin America Market Forecast (USD Billion), by Sub-Segment 3, 2016-2027
      Figure 38: Latin America Market Forecast (USD Billion), by Others, 2016-2027
      Figure 39: Latin America Market Value Share (%), By Segment 3, 2019 & 2027
      Figure 40: Latin America Market Forecast (USD Billion), by Sub-Segment 1, 2016-2027
      Figure 41: Latin America Market Forecast (USD Billion), by Sub-Segment 2, 2016-2027
      Figure 42: Latin America Market Forecast (USD Billion), by Sub-Segment 3, 2016-2027
      Figure 43: Latin America Market Forecast (USD Billion), by Others, 2016-2027
      Figure 44: Latin America Market Forecast (USD Billion), by Brazil, 2016-2027
      Figure 45: Latin America Market Forecast (USD Billion), by Mexico, 2016-2027
      Figure 46: Latin America Market Forecast (USD Billion), by Rest of Latin America, 2016-2027
      Figure 47: Europe SCADA Market Value Share (%), By Segment 1, 2019 & 2027
      Figure 48: Europe Market Forecast (USD Billion), by Sub-Segment 1, 2016-2027
      Figure 49: Europe Market Forecast (USD Billion), by Sub-Segment 2, 2016-2027
      Figure 50: Europe Market Value Share (%), By Segment 2, 2019 & 2027
      Figure 51: Europe Market Forecast (USD Billion), by Sub-Segment 1, 2016-2027
      Figure 52: Europe Market Forecast (USD Billion), by Sub-Segment 2, 2016-2027
      Figure 53: Europe Market Forecast (USD Billion), by Sub-Segment 3, 2016-2027
      Figure 54: Europe Market Forecast (USD Billion), by Others, 2016-2027
      Figure 55: Europe Market Value Share (%), By Segment 3, 2019 & 2027
      Figure 56: Europe Market Forecast (USD Billion), by Sub-Segment 1, 2016-2027
      Figure 57: Europe Market Forecast (USD Billion), by Sub-Segment 2, 2016-2027
      Figure 58: Europe Market Forecast (USD Billion), by Sub-Segment 3, 2016-2027
      Figure 59: Europe Market Forecast (USD Billion), by Others, 2016-2027
      Figure 60: Europe Market Forecast (USD Billion), by U.K., 2016-2027
      Figure 61: Europe Market Forecast (USD Billion), by Germany, 2016-2027
      Figure 62: Europe Market Forecast (USD Billion), by France, 2016-2027
      Figure 63: Europe Market Forecast (USD Billion), by Italy, 2016-2027
      Figure 64: Europe Market Forecast (USD Billion), by Spain, 2016-2027
      Figure 65: Europe Market Forecast (USD Billion), by Russia, 2016-2027
      Figure 66: Europe Market Forecast (USD Billion), by Rest of Europe, 2016-2027
      Figure 67: Asia Pacific SCADA Market Value Share (%), By Segment 1, 2019 & 2027
      Figure 68: Asia Pacific Market Forecast (USD Billion), by Sub-Segment 1, 2016-2027
      Figure 69: Asia Pacific Market Forecast (USD Billion), by Sub-Segment 2, 2016-2027
      Figure 70: Asia Pacific Market Value Share (%), By Segment 2, 2019 & 2027
      Figure 71: Asia Pacific Market Forecast (USD Billion), by Sub-Segment 1, 2016-2027
      Figure 72: Asia Pacific Market Forecast (USD Billion), by Sub-Segment 2, 2016-2027
      Figure 73: Asia Pacific Market Forecast (USD Billion), by Sub-Segment 3, 2016-2027
      Figure 74: Asia Pacific Market Forecast (USD Billion), by Others, 2016-2027
      Figure 75: Asia Pacific Market Value Share (%), By Segment 3, 2019 & 2027
      Figure 76: Asia Pacific Market Forecast (USD Billion), by Sub-Segment 1, 2016-2027
      Figure 77: Asia Pacific Market Forecast (USD Billion), by Sub-Segment 2, 2016-2027
      Figure 78: Asia Pacific Market Forecast (USD Billion), by Sub-Segment 3, 2016-2027
      Figure 79: Asia Pacific Market Forecast (USD Billion), by Others, 2016-2027
      Figure 80: Asia Pacific Market Forecast (USD Billion), by China, 2016-2027
      Figure 81: Asia Pacific Market Forecast (USD Billion), by India, 2016-2027
      Figure 82: Asia Pacific Market Forecast (USD Billion), by Japan, 2016-2027
      Figure 83: Asia Pacific Market Forecast (USD Billion), by Australia, 2016-2027
      Figure 84: Asia Pacific Market Forecast (USD Billion), by Southeast Asia, 2016-2027
      Figure 85: Asia Pacific Market Forecast (USD Billion), by Rest of Asia Pacific, 2016-2027
      Figure 86: Middle East & Africa SCADA Market Value Share (%), By Segment 1, 2019 & 2027
      Figure 87: Middle East & Africa Market Forecast (USD Billion), by Sub-Segment 1, 2016-2027
      Figure 88: Middle East & Africa Market Forecast (USD Billion), by Sub-Segment 2, 2016-2027
      Figure 89: Middle East & Africa Market Value Share (%), By Segment 2, 2019 & 2027
      Figure 90: Middle East & Africa Market Forecast (USD Billion), by Sub-Segment 1, 2016-2027
      Figure 91: Middle East & Africa Market Forecast (USD Billion), by Sub-Segment 2, 2016-2027
      Figure 92: Middle East & Africa Market Forecast (USD Billion), by Sub-Segment 3, 2016-2027
      Figure 93: Middle East & Africa Market Forecast (USD Billion), by Others, 2016-2027
      Figure 94: Middle East & Africa Market Value Share (%), By Segment 3, 2019 & 2027
      Figure 95: Middle East & Africa Market Forecast (USD Billion), by Sub-Segment 1, 2016-2027
      Figure 96: Middle East & Africa Market Forecast (USD Billion), by Sub-Segment 2, 2016-2027
      Figure 97: Middle East & Africa Market Forecast (USD Billion), by Sub-Segment 3, 2016-2027
      Figure 98: Middle East & Africa Market Forecast (USD Billion), by Others, 2016-2027
      Figure 99: Middle East & Africa Market Forecast (USD Billion), by GCC, 2016-2027
      Figure 100: Middle East & Africa Market Forecast (USD Billion), by South Africa, 2016-2027
      Figure 101: Middle East & Africa Market Forecast (USD Billion), by Rest of Middle East & Africa, 2016-2027 
      List of Tables
      Table 1: Global SCADA Market Revenue (USD Billion) Forecast, by Segment 1, 2016-2027
      Table 2: Global Market Revenue (USD Billion) Forecast, by Segment 2, 2016-2027
      Table 3: Global Market Revenue (USD Billion) Forecast, by Segment 3, 2016-2027
      Table 4: Global Market Revenue (USD Billion) Forecast, by Region, 2016-2027
      Table 5: North America SCADA Market Revenue (USD Billion) Forecast, by Segment 1, 2016-2027
      Table 6: North America Market Revenue (USD Billion) Forecast, by Segment 2, 2016-2027
      Table 7: North America Market Revenue (USD Billion) Forecast, by Segment 3, 2016-2027
      Table 8: North America Market Revenue (USD Billion) Forecast, by Country, 2016-2027
      Table 9: Europe SCADA Market Revenue (USD Billion) Forecast, by Segment 1, 2016-2027
      Table 10: Europe Market Revenue (USD Billion) Forecast, by Segment 2, 2016-2027
      Table 11: Europe Market Revenue (USD Billion) Forecast, by Segment 3, 2016-2027
      Table 12: Europe Market Revenue (USD Billion) Forecast, by Country, 2016-2027
      Table 13: Latin America SCADA Market Revenue (USD Billion) Forecast, by Segment 1, 2016-2027
      Table 14: Latin America Market Revenue (USD Billion) Forecast, by Segment 2, 2016-2027
      Table 15: Latin America Market Revenue (USD Billion) Forecast, by Segment 3, 2016-2027
      Table 16: Latin America Market Revenue (USD Billion) Forecast, by Country, 2016-2027
      Table 17: Asia Pacific SCADA Market Revenue (USD Billion) Forecast, by Segment 1, 2016-2027
      Table 18: Asia Pacific Market Revenue (USD Billion) Forecast, by Segment 2, 2016-2027
      Table 19: Asia Pacific Market Revenue (USD Billion) Forecast, by Segment 3, 2016-2027
      Table 20: Asia Pacific Market Revenue (USD Billion) Forecast, by Country, 2016-2027
      Table 21: Middle East & Africa SCADA Market Revenue (USD Billion) Forecast, by Segment 1, 2016-2027
      Table 22: Middle East & Africa Market Revenue (USD Billion) Forecast, by Segment 2, 2016-2027
      Table 23: Middle East & Africa Market Revenue (USD Billion) Forecast, by Segment 3, 2016-2027
      Table 24: Middle East & Africa Market Revenue (USD Billion) Forecast, by Country, 2016-2027
      Research Process

      Data Library Research are conducted by industry experts who offer insight on industry structure, market segmentations technology assessment and competitive landscape (CL), and penetration, as well as on emerging trends. Their analysis is based on primary interviews (~ 80%) and secondary research (~ 20%) as well as years of professional expertise in their respective industries. Adding to this, by analysing historical trends and current market positions, our analysts predict where the market will be headed for the next five years. Furthermore, the varying trends of segment & categories geographically presented are also studied and the estimated based on the primary & secondary research.

      In this particular report from the supply side Data Library Research has conducted primary surveys (interviews) with the key level executives (VP, CEO’s, Marketing Director, Business Development Manager and SOFT) of the companies that active & prominent as well as the midsized organization

      FIGURE 1: DLR RESEARH PROCESS

      research-methodology1

      Primary Research

      Extensive primary research was conducted to gain a deeper insight of the market and industry performance. The analysis is based on both primary and secondary research as well as years of professional expertise in the respective industries.

      In addition to analysing current and historical trends, our analysts predict where the market is headed over the next five years.

      It varies by segment for these categories geographically presented in the list of market tables. Speaking about this particular report we have conducted primary surveys (interviews) with the key level executives (VP, CEO’s, Marketing Director, Business Development Manager and many more) of the major players active in the market.

      Secondary Research

      Secondary research was mainly used to collect and identify information useful for the extensive, technical, market-oriented, and Friend’s study of the Global Extra Neutral Alcohol. It was also used to obtain key information about major players, market classification and segmentation according to the industry trends, geographical markets, and developments related to the market and technology perspectives. For this study, analysts have gathered information from various credible sources, such as annual reports, sec filings, journals, white papers, SOFT presentations, and company web sites.

      Market Size Estimation

      Both, top-down and bottom-up approaches were used to estimate and validate the size of the Global market and to estimate the size of various other dependent submarkets in the overall Extra Neutral Alcohol. The key players in the market were identified through secondary research and their market contributions in the respective geographies were determined through primary and secondary research.

      Forecast Model

      research-methodology2