Global Serial (SPI) NOR Flash Market Opportunities and Forecast 2023-2030

  •   DLR2023
  •   November, 2021
  •   Pages: 120
  •  Global
Serial (SPI) NOR Flash Market Overview

NOR flash memory is a type of non-volatile memory. The most common application of NOR is code execution. When NOR flash memory is first turned on, it consumes more power; however, NOR has a low standby power need. The global Serial (SPI) NOR Flash market is expected to rise at a considerable rate in the years to come. Embedded electronics is one of the most common uses for NOR flash memory. Consumer electronics such as tablets and smartphones frequently employ NOR flash. Serial NOR flash is used in devices with a lightweight operating system. Because of NOR's quick read performance, the OS can be booted much faster than with NAND. Because embedded systems tend to read code during the boot process but do few write operations, NOR is a great choice for them.
 
The evolution of technologies such as 5G has propelled the demand for faster-operating devices. Therefore, NOR flash memories can be used along with NAND in electronic devices, NOR for faster read operations, and NAND for comparably higher write and erase functions. Consequently, applications such as smartphones, smartwatches, medical devices, portable devices, and devices having smaller operating systems extensively utilize NOR flash memory. Each of these factors is anticipated to have a definite impact on the Serial (SPI) NOR Flash market during the forecast period.
 
On the downside, NOR flash memory is more expensive than NAND and has lower code saturation space, which in turn is hindering the serial NOR flash memory market.

Report Metric Details
Market size available for years 2023–2030
Base year considered 2023
Forecast period 2024–2030
Forecast unit Value (USD Million)
Segments covered Type, Application, and Region
Regions covered North America (the U.S. and Canada), Europe (UK, Germany, France, Italy, Spain, Russia, Rest of Europe), Asia-Pacific (China, India, Japan, Australia, South East Asia, Rest of Asia Pacific), Latin America and the Middle East and Africa (Brazil, Saudi Arabia, UAE, Rest of LAMEA)
Companies covered Cypress, Samsung, Winbond, Micron, Macronix, ISSI, Eon, Microchip, GigaDevice.


Covid-19 Impact on Serial (SPI) NOR Flash Market
 
Like many other industries, COVID-19 badly knocked the electronic and semiconductor industries. This unprecedented event has impacted nearly 230 countries in just a few weeks, resulting in the forced shutdown of manufacturing and transportation activities within and across the countries. This has directly affected the overall sector's growth. It is estimated that COVID-19 to leave more than USD 30 billion impacts on the electronics and semiconductor industry. The sector is majorly affected due to transport restrictions on major electronics and semiconductor raw material providers. However, the emerging need for semiconductors in several industries will offer rapid market recovery over the future period.
 
Serial (SPI) NOR Flash Market Segment Overview


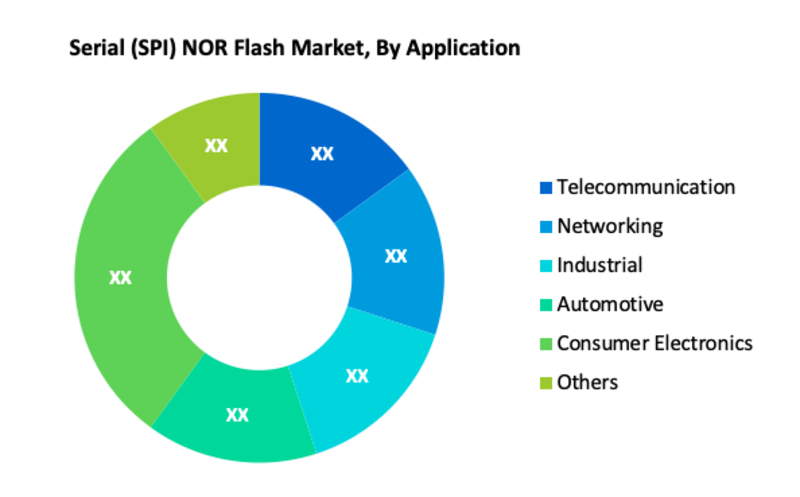
Based on Application, Consumer Electronics is one of the largest segments in the global Serial (SPI) NOR Flash market. Serial NOR flash memory is found in a variety of consumer gadgets, including modems, Wi-Fi/home gateways, CCTV cameras, set-top boxes, smart meters, printers, and digital televisions. This contributes to the segment's expansion.
 
Serial (SPI) NOR Flash Market, By Type
·       High Density Memory
·       Low Density Memory
 
Serial (SPI) NOR Flash Market, By Application
·       Telecommunication
·       Networking
·       Industrial
·       Automotive
·       Consumer Electronics
·       Others

Serial (SPI) NOR Flash Market Regional Overview

In terms of region, Asia Pacific is expected to account for a major share in the global serial NOR flash market in the forecast period. This is due to the presence of a significant electronics sector and important players in the region. The serial NOR flash market appears to be concentrated in Asia and Europe, with these two regions accounting for the majority of the market share. Furthermore, during the projection period, North America is expected to acquire market share and present a substantial potential for the serial NOR flash market. The automotive, industrial (IIoT), networking, and communication sectors in the region are also projected to offer significant opportunities for the market in the forecast period.
 
Serial (SPI) NOR Flash Market, By Geography
 
·       North America (US & Canada)
·       Europe (UK, Germany, France, Italy, Spain, Russia & Rest of Europe)
·       Asia-Pacific (Japan, China, India, Australia, & South Korea, & Rest of Asia-Pacific)
·       LAMEA (Brazil, Saudi Arabia, UAE & Rest of LAMEA)
 
Serial (SPI) NOR Flash Market Competitor overview

Some key developments and strategies adopted by manufacturers in Serial (SPI) NOR Flash are highlighted below.

·       In October 2021, Alliance Memory announced a new line of 3V multiple input/output serial NOR flash memory products designed to provide supply continuity for Micron Technology customers utilizing discontinued N25Q series devices. Offering support for single, dual, and quad SPI modes, the AS25F series combines fast read performance up to 104MHz with the fast program and erase times of 0.3ms and 40ms typical, respectively.

·       In April 2021,  Dialog Semiconductor has developed new serial NOR 1 Mbit and 2 Mbit Flash memory configurations, which claim to have the 'lowest total energy usage' in the industry for power-conscious and space-constrained devices.
 
Serial (SPI) NOR Flash Market, Key Players

·       Cypress
·       Samsung
·       Winbond
·       Micron
·       Macronix
·       ISSI
·       Eon
·       Microchip
·       GigaDevice

Frequently Asked Questions (FAQ) :

Q1. Which Segments are covered in the Serial (SPI) NOR Flash Market report?

Type, Application, and Region these segments are covered in the Serial (SPI) NOR Flash market report.

Q2. Which segment is projected to hold the largest share in the Serial (SPI) NOR Flash Market?

Consumer Electronics segment is projected to hold the largest share in the Serial (SPI) NOR Flash Market.

Q3. Which region holds the largest share in the Serial (SPI) NOR Flash market?

Asia Pacific held the largest share in the global Serial (SPI) NOR Flash market.

Q4. What are the restraining factors for the Serial (SPI) NOR Flash market?

NOR flash memory is more expensive than NAND and has lower code saturation space, which in turn is hindering the serial NOR flash memory market.

Q5. Which are the prominent players in the Serial (SPI) NOR Flash Market?

Cypress, Samsung, Winbond, Micron, Macronix, ISSI, Eon, Microchip, GigaDevice are some key players in the Serial (SPI) NOR Flash Market.
Serial (SPI) NOR Flash Market Study Global Market Analysis, Insights and Forecast, 2020-2027

    1. Introduction

    • 1.1. Research Scope
    • 1.2. Market Segmentation
    • 1.3. Research Methodology
    • 1.4. Definitions and Assumptions

    2. Executive Summary

      3. Market Dynamics

      • 3.1. Market Drivers
      • 3.2. Market Restraints
      • 3.3. Market Opportunities

      4. Key Insights

      • 4.1. Key Emerging Trends – For Major Countries
      • 4.2. Latest Technological Advancement
      • 4.3. Regulatory Landscape
      • 4.4. Industry SWOT Analysis
      • 4.5. Porters Five Forces Analysis

      5. Global Serial (SPI) NOR Flash Market Analysis (USD Billion), Insights and Forecast, 2020-2027

      • 5.1. Key Findings / Summary
      • 5.2. Market Analysis, Insights and Forecast – By Type
        • 5.2.1. High Density Memory
        • 5.2.2. Low Density Memory
      • 5.3. Market Analysis, Insights and Forecast – By Application
        • 5.3.1. Telecommunication
        • 5.3.2. Networking
        • 5.3.3. Industrial
        • 5.3.4. Automotive
        • 5.3.5. Consumer Electronics
        • 5.3.6. Others
      • 5.4. Market Analysis, Insights and Forecast – By Region
        • 5.4.1. North America
        • 5.4.2. Europe
        • 5.4.3. Asia Pacific
        • 5.4.4. Latin America, Middle East and Africa

      6. North America Serial (SPI) NOR Flash Market Analysis (USD Billion), Insights and Forecast, 2020-2027

      • 6.1. Key Findings / Summary
      • 6.2. Market Analysis, Insights and Forecast – By Type
        • 6.2.1. High Density Memory
        • 6.2.2. Low Density Memory
      • 6.3. Market Analysis, Insights and Forecast – By Application
        • 6.3.1. Telecommunication
        • 6.3.2. Networking
        • 6.3.3. Industrial
        • 6.3.4. Automotive
        • 6.3.5. Consumer Electronics
        • 6.3.6. Others
      • 6.4. Market Analysis, Insights and Forecast – By Country
        • 6.4.1. U.S.
        • 6.4.2. Canada

      7. Europe Serial (SPI) NOR Flash Market Analysis (USD Billion), Insights and Forecast, 2020-2027

      • 7.1. Key Findings / Summary
      • 7.2. Market Analysis, Insights and Forecast – By Type
        • 7.2.1. High Density Memory
        • 7.2.2. Low Density Memory
      • 7.3. Market Analysis, Insights and Forecast – By Application
        • 7.3.1. Telecommunication
        • 7.3.2. Networking
        • 7.3.3. Industrial
        • 7.3.4. Automotive
        • 7.3.5. Consumer Electronics
        • 7.3.6. Others
      • 7.4. Market Analysis, Insights and Forecast – By Country
        • 7.4.1. UK
        • 7.4.2. Germany
        • 7.4.3. France
        • 7.4.4. Italy
        • 7.4.5. Spain
        • 7.4.6. Russia
        • 7.4.7. Rest of Europe

      8. Asia Pacific Serial (SPI) NOR Flash Market Analysis (USD Billion), Insights and Forecast, 2020-2027

      • 8.1. Key Findings / Summary
      • 8.2. Market Analysis, Insights and Forecast – By Type
        • 8.2.1. High Density Memory
        • 8.2.2. Low Density Memory
      • 8.3. Market Analysis, Insights and Forecast – By Application
        • 8.3.1. Telecommunication
        • 8.3.2. Networking
        • 8.3.3. Industrial
        • 8.3.4. Automotive
        • 8.3.5. Consumer Electronics
        • 8.3.6. Others
      • 8.4. Market Analysis, Insights and Forecast – By Country
        • 8.4.1. China
        • 8.4.2. India
        • 8.4.3. Japan
        • 8.4.4. Australia
        • 8.4.5. South East Asia
        • 8.4.6. Rest of Asia Pacific

      9. Latin America, Middle East and Africa Serial (SPI) NOR Flash Market Analysis (USD Billion), Insights and Forecast, 2020-2027

      • 9.1. Key Findings / Summary
      • 9.2. Market Analysis, Insights and Forecast – By Type
        • 9.2.1. High Density Memory
        • 9.2.2. Low Density Memory
      • 9.3. Market Analysis, Insights and Forecast – By Application
        • 9.3.1. Telecommunication
        • 9.3.2. Networking
        • 9.3.3. Industrial
        • 9.3.4. Automotive
        • 9.3.5. Consumer Electronics
        • 9.3.6. Others
      • 9.4. Market Analysis, Insights and Forecast – By Country
        • 9.4.1. Brazil
        • 9.4.2. Saudi Arabia
        • 9.4.3. UAE
        • 9.4.4. Rest of LAMEA

      10. Competitive Analysis

      • 10.1. Company Market Share Analysis, 2018
      • 10.2. Key Industry Developments
      • 10.3. Company Profile
      • 10.4. Cypress
        • 10.4.1. Business Overview
        • 10.4.2. Segment 1 & Service Offering
        • 10.4.3. Overall Revenue
        • 10.4.4. Geographic Presence
        • 10.4.5. Recent Development
      *Similar details will be provided for the following companies
      • 10.5. Samsung
      • 10.6. Winbond
      • 10.7. Micron
      • 10.8. Macronix
      • 10.9. ISSI
      • 10.10. Eon
      • 10.11. Microchip
      List of Figures

      Figure 1: Global Serial NOR Flash Market Revenue Breakdown (USD Billion, %) by Region, 2019 & 2027
      Figure 2: Global Serial NOR Flash Market Value Share (%), By Segment 1, 2019 & 2027
      Figure 3: Global Serial NOR Flash Market Forecast (USD Billion), by Sub-Segment 1, 2016-2027
      Figure 4: Global Serial NOR Flash Market Forecast (USD Billion), by Sub-Segment 2, 2016-2027
      Figure 5: Global Serial NOR Flash Market Value Share (%), By Segment 2, 2019 & 2027
      Figure 6: Global Serial NOR Flash Market Forecast (USD Billion), by Sub-Segment 1, 2016-2027
      Figure 7: Global Serial NOR Flash Market Forecast (USD Billion), by Sub-Segment 2, 2016-2027
      Figure 8: Global Serial NOR Flash Market Forecast (USD Billion), by Sub-Segment 3, 2016-2027
      Figure 9: Global Serial NOR Flash Market Forecast (USD Billion), by Others, 2016-2027
      Figure 10: Global Serial NOR Flash Market Value Share (%), By Segment 3, 2019 & 2027
      Figure 11: Global Serial NOR Flash Market Forecast (USD Billion), by Sub-Segment 1, 2016-2027
      Figure 12: Global Serial NOR Flash Market Forecast (USD Billion), by Sub-Segment 2, 2016-2027
      Figure 13: Global Serial NOR Flash Market Forecast (USD Billion), by Sub-Segment 3, 2016-2027
      Figure 14: Global Serial NOR Flash Market Forecast (USD Billion), by Others, 2016-2027
      Figure 15: Global Serial NOR Flash Market Value (USD Billion), by Region, 2019 & 2027
      Figure 16: North America Serial NOR Flash Market Value Share (%), By Segment 1, 2019 & 2027
      Figure 17: North America Serial NOR Flash Market Forecast (USD Billion), by Sub-Segment 1, 2016-2027
      Figure 18: North America Serial NOR Flash Market Forecast (USD Billion), by Sub-Segment 2, 2016-2027
      Figure 19: North America Serial NOR Flash Market Value Share (%), By Segment 2, 2019 & 2027
      Figure 20: North America Serial NOR Flash Market Forecast (USD Billion), by Sub-Segment 1, 2016-2027
      Figure 21: North America Serial NOR Flash Market Forecast (USD Billion), by Sub-Segment 2, 2016-2027
      Figure 22: North America Serial NOR Flash Market Forecast (USD Billion), by Sub-Segment 3, 2016-2027
      Figure 23: North America Serial NOR Flash Market Forecast (USD Billion), by Others, 2016-2027
      Figure 24: North America Serial NOR Flash Market Value Share (%), By Segment 3, 2019 & 2027
      Figure 25: North America Serial NOR Flash Market Forecast (USD Billion), by Sub-Segment 1, 2016-2027
      Figure 26: North America Serial NOR Flash Market Forecast (USD Billion), by Sub-Segment 2, 2016-2027
      Figure 27: North America Serial NOR Flash Market Forecast (USD Billion), by Sub-Segment 3, 2016-2027
      Figure 28: North America Serial NOR Flash Market Forecast (USD Billion), by Others, 2016-2027
      Figure 29: North America Serial NOR Flash Market Forecast (USD Billion), by U.S., 2016-2027
      Figure 30: North America Serial NOR Flash Market Forecast (USD Billion), by Canada, 2016-2027
      Figure 31: Latin America Serial NOR Flash Market Value Share (%), By Segment 1, 2019 & 2027
      Figure 32: Latin America Serial NOR Flash Market Forecast (USD Billion), by Sub-Segment 1, 2016-2027
      Figure 33: Latin America Serial NOR Flash Market Forecast (USD Billion), by Sub-Segment 2, 2016-2027
      Figure 34: Latin America Serial NOR Flash Market Value Share (%), By Segment 2, 2019 & 2027
      Figure 35: Latin America Serial NOR Flash Market Forecast (USD Billion), by Sub-Segment 1, 2016-2027
      Figure 36: Latin America Serial NOR Flash Market Forecast (USD Billion), by Sub-Segment 2, 2016-2027
      Figure 37: Latin America Serial NOR Flash Market Forecast (USD Billion), by Sub-Segment 3, 2016-2027
      Figure 38: Latin America Serial NOR Flash Market Forecast (USD Billion), by Others, 2016-2027
      Figure 39: Latin America Serial NOR Flash Market Value Share (%), By Segment 3, 2019 & 2027
      Figure 40: Latin America Serial NOR Flash Market Forecast (USD Billion), by Sub-Segment 1, 2016-2027
      Figure 41: Latin America Serial NOR Flash Market Forecast (USD Billion), by Sub-Segment 2, 2016-2027
      Figure 42: Latin America Serial NOR Flash Market Forecast (USD Billion), by Sub-Segment 3, 2016-2027
      Figure 43: Latin America Serial NOR Flash Market Forecast (USD Billion), by Others, 2016-2027
      Figure 44: Latin America Serial NOR Flash Market Forecast (USD Billion), by Brazil, 2016-2027
      Figure 45: Latin America Serial NOR Flash Market Forecast (USD Billion), by Mexico, 2016-2027
      Figure 46: Latin America Serial NOR Flash Market Forecast (USD Billion), by Rest of Latin America, 2016-2027
      Figure 47: Europe Serial NOR Flash Market Value Share (%), By Segment 1, 2019 & 2027
      Figure 48: Europe Serial NOR Flash Market Forecast (USD Billion), by Sub-Segment 1, 2016-2027
      Figure 49: Europe Serial NOR Flash Market Forecast (USD Billion), by Sub-Segment 2, 2016-2027
      Figure 50: Europe Serial NOR Flash Market Value Share (%), By Segment 2, 2019 & 2027
      Figure 51: Europe Serial NOR Flash Market Forecast (USD Billion), by Sub-Segment 1, 2016-2027
      Figure 52: Europe Serial NOR Flash Market Forecast (USD Billion), by Sub-Segment 2, 2016-2027
      Figure 53: Europe Serial NOR Flash Market Forecast (USD Billion), by Sub-Segment 3, 2016-2027
      Figure 54: Europe Serial NOR Flash Market Forecast (USD Billion), by Others, 2016-2027
      Figure 55: Europe Serial NOR Flash Market Value Share (%), By Segment 3, 2019 & 2027
      Figure 56: Europe Serial NOR Flash Market Forecast (USD Billion), by Sub-Segment 1, 2016-2027
      Figure 57: Europe Serial NOR Flash Market Forecast (USD Billion), by Sub-Segment 2, 2016-2027
      Figure 58: Europe Serial NOR Flash Market Forecast (USD Billion), by Sub-Segment 3, 2016-2027
      Figure 59: Europe Serial NOR Flash Market Forecast (USD Billion), by Others, 2016-2027
      Figure 60: Europe Serial NOR Flash Market Forecast (USD Billion), by U.K., 2016-2027
      Figure 61: Europe Serial NOR Flash Market Forecast (USD Billion), by Germany, 2016-2027
      Figure 62: Europe Serial NOR Flash Market Forecast (USD Billion), by France, 2016-2027
      Figure 63: Europe Serial NOR Flash Market Forecast (USD Billion), by Italy, 2016-2027
      Figure 64: Europe Serial NOR Flash Market Forecast (USD Billion), by Spain, 2016-2027
      Figure 65: Europe Serial NOR Flash Market Forecast (USD Billion), by Russia, 2016-2027
      Figure 66: Europe Serial NOR Flash Market Forecast (USD Billion), by Rest of Europe, 2016-2027
      Figure 67: Asia Pacific Serial NOR Flash Market Value Share (%), By Segment 1, 2019 & 2027
      Figure 68: Asia Pacific Serial NOR Flash Market Forecast (USD Billion), by Sub-Segment 1, 2016-2027
      Figure 69: Asia Pacific Serial NOR Flash Market Forecast (USD Billion), by Sub-Segment 2, 2016-2027
      Figure 70: Asia Pacific Serial NOR Flash Market Value Share (%), By Segment 2, 2019 & 2027
      Figure 71: Asia Pacific Serial NOR Flash Market Forecast (USD Billion), by Sub-Segment 1, 2016-2027
      Figure 72: Asia Pacific Serial NOR Flash Market Forecast (USD Billion), by Sub-Segment 2, 2016-2027
      Figure 73: Asia Pacific Serial NOR Flash Market Forecast (USD Billion), by Sub-Segment 3, 2016-2027
      Figure 74: Asia Pacific Serial NOR Flash Market Forecast (USD Billion), by Others, 2016-2027
      Figure 75: Asia Pacific Serial NOR Flash Market Value Share (%), By Segment 3, 2019 & 2027
      Figure 76: Asia Pacific Serial NOR Flash Market Forecast (USD Billion), by Sub-Segment 1, 2016-2027
      Figure 77: Asia Pacific Serial NOR Flash Market Forecast (USD Billion), by Sub-Segment 2, 2016-2027
      Figure 78: Asia Pacific Serial NOR Flash Market Forecast (USD Billion), by Sub-Segment 3, 2016-2027
      Figure 79: Asia Pacific Serial NOR Flash Market Forecast (USD Billion), by Others, 2016-2027
      Figure 80: Asia Pacific Serial NOR Flash Market Forecast (USD Billion), by China, 2016-2027
      Figure 81: Asia Pacific Serial NOR Flash Market Forecast (USD Billion), by India, 2016-2027
      Figure 82: Asia Pacific Serial NOR Flash Market Forecast (USD Billion), by Japan, 2016-2027
      Figure 83: Asia Pacific Serial NOR Flash Market Forecast (USD Billion), by Australia, 2016-2027
      Figure 84: Asia Pacific Serial NOR Flash Market Forecast (USD Billion), by Southeast Asia, 2016-2027
      Figure 85: Asia Pacific Serial NOR Flash Market Forecast (USD Billion), by Rest of Asia Pacific, 2016-2027
      Figure 86: Middle East & Africa Serial NOR Flash Market Value Share (%), By Segment 1, 2019 & 2027
      Figure 87: Middle East & Africa Serial NOR Flash Market Forecast (USD Billion), by Sub-Segment 1, 2016-2027
      Figure 88: Middle East & Africa Serial NOR Flash Market Forecast (USD Billion), by Sub-Segment 2, 2016-2027
      Figure 89: Middle East & Africa Serial NOR Flash Market Value Share (%), By Segment 2, 2019 & 2027
      Figure 90: Middle East & Africa Serial NOR Flash Market Forecast (USD Billion), by Sub-Segment 1, 2016-2027
      Figure 91: Middle East & Africa Serial NOR Flash Market Forecast (USD Billion), by Sub-Segment 2, 2016-2027
      Figure 92: Middle East & Africa Serial NOR Flash Market Forecast (USD Billion), by Sub-Segment 3, 2016-2027
      Figure 93: Middle East & Africa Serial NOR Flash Market Forecast (USD Billion), by Others, 2016-2027
      Figure 94: Middle East & Africa Serial NOR Flash Market Value Share (%), By Segment 3, 2019 & 2027
      Figure 95: Middle East & Africa Serial NOR Flash Market Forecast (USD Billion), by Sub-Segment 1, 2016-2027
      Figure 96: Middle East & Africa Serial NOR Flash Market Forecast (USD Billion), by Sub-Segment 2, 2016-2027
      Figure 97: Middle East & Africa Serial NOR Flash Market Forecast (USD Billion), by Sub-Segment 3, 2016-2027
      Figure 98: Middle East & Africa Serial NOR Flash Market Forecast (USD Billion), by Others, 2016-2027
      Figure 99: Middle East & Africa Serial NOR Flash Market Forecast (USD Billion), by GCC, 2016-2027
      Figure 100: Middle East & Africa Serial NOR Flash Market Forecast (USD Billion), by South Africa, 2016-2027
      Figure 101: Middle East & Africa Serial NOR Flash Market Forecast (USD Billion), by Rest of Middle East & Africa, 2016-2027 
      List of Tables
      Table 1: Global Serial NOR Flash Market Revenue (USD Billion) Forecast, by Segment 1, 2016-2027
      Table 2: Global Serial NOR Flash Market Revenue (USD Billion) Forecast, by Segment 2, 2016-2027
      Table 3: Global Serial NOR Flash Market Revenue (USD Billion) Forecast, by Segment 3, 2016-2027
      Table 4: Global Serial NOR Flash Market Revenue (USD Billion) Forecast, by Region, 2016-2027
      Table 5: North America Serial NOR Flash Market Revenue (USD Billion) Forecast, by Segment 1, 2016-2027
      Table 6: North America Serial NOR Flash Market Revenue (USD Billion) Forecast, by Segment 2, 2016-2027
      Table 7: North America Serial NOR Flash Market Revenue (USD Billion) Forecast, by Segment 3, 2016-2027
      Table 8: North America Serial NOR Flash Market Revenue (USD Billion) Forecast, by Country, 2016-2027
      Table 9: Europe Serial NOR Flash Market Revenue (USD Billion) Forecast, by Segment 1, 2016-2027
      Table 10: Europe Serial NOR Flash Market Revenue (USD Billion) Forecast, by Segment 2, 2016-2027
      Table 11: Europe Serial NOR Flash Market Revenue (USD Billion) Forecast, by Segment 3, 2016-2027
      Table 12: Europe Serial NOR Flash Market Revenue (USD Billion) Forecast, by Country, 2016-2027
      Table 13: Latin America Serial NOR Flash Market Revenue (USD Billion) Forecast, by Segment 1, 2016-2027
      Table 14: Latin America Serial NOR Flash Market Revenue (USD Billion) Forecast, by Segment 2, 2016-2027
      Table 15: Latin America Serial NOR Flash Market Revenue (USD Billion) Forecast, by Segment 3, 2016-2027
      Table 16: Latin America Serial NOR Flash Market Revenue (USD Billion) Forecast, by Country, 2016-2027
      Table 17: Asia Pacific Serial NOR Flash Market Revenue (USD Billion) Forecast, by Segment 1, 2016-2027
      Table 18: Asia Pacific Serial NOR Flash Market Revenue (USD Billion) Forecast, by Segment 2, 2016-2027
      Table 19: Asia Pacific Serial NOR Flash Market Revenue (USD Billion) Forecast, by Segment 3, 2016-2027
      Table 20: Asia Pacific Serial NOR Flash Market Revenue (USD Billion) Forecast, by Country, 2016-2027
      Table 21: Middle East & Africa Serial NOR Flash Market Revenue (USD Billion) Forecast, by Segment 1, 2016-2027
      Table 22: Middle East & Africa Serial NOR Flash Market Revenue (USD Billion) Forecast, by Segment 2, 2016-2027
      Table 23: Middle East & Africa Serial NOR Flash Market Revenue (USD Billion) Forecast, by Segment 3, 2016-2027
      Table 24: Middle East & Africa Serial NOR Flash Market Revenue (USD Billion) Forecast, by Country, 2016-2027
      Research Process

      Data Library Research are conducted by industry experts who offer insight on industry structure, market segmentations technology assessment and competitive landscape (CL), and penetration, as well as on emerging trends. Their analysis is based on primary interviews (~ 80%) and secondary research (~ 20%) as well as years of professional expertise in their respective industries. Adding to this, by analysing historical trends and current market positions, our analysts predict where the market will be headed for the next five years. Furthermore, the varying trends of segment & categories geographically presented are also studied and the estimated based on the primary & secondary research.

      In this particular report from the supply side Data Library Research has conducted primary surveys (interviews) with the key level executives (VP, CEO’s, Marketing Director, Business Development Manager and SOFT) of the companies that active & prominent as well as the midsized organization

      FIGURE 1: DLR RESEARH PROCESS

      research-methodology1

      Primary Research

      Extensive primary research was conducted to gain a deeper insight of the market and industry performance. The analysis is based on both primary and secondary research as well as years of professional expertise in the respective industries.

      In addition to analysing current and historical trends, our analysts predict where the market is headed over the next five years.

      It varies by segment for these categories geographically presented in the list of market tables. Speaking about this particular report we have conducted primary surveys (interviews) with the key level executives (VP, CEO’s, Marketing Director, Business Development Manager and many more) of the major players active in the market.

      Secondary Research

      Secondary research was mainly used to collect and identify information useful for the extensive, technical, market-oriented, and Friend’s study of the Global Extra Neutral Alcohol. It was also used to obtain key information about major players, market classification and segmentation according to the industry trends, geographical markets, and developments related to the market and technology perspectives. For this study, analysts have gathered information from various credible sources, such as annual reports, sec filings, journals, white papers, SOFT presentations, and company web sites.

      Market Size Estimation

      Both, top-down and bottom-up approaches were used to estimate and validate the size of the Global market and to estimate the size of various other dependent submarkets in the overall Extra Neutral Alcohol. The key players in the market were identified through secondary research and their market contributions in the respective geographies were determined through primary and secondary research.

      Forecast Model

      research-methodology2