Global Smart Parking Systems Market Opportunities and Forecast 2023-2030

  •   DLR2044
  •   March, 2022
  •   Pages: 120
  •  Global
Smart Parking Systems Market Overview

Smart parking is a parking system that assists drivers in finding safe parking spots. With the help of embedded software and sensors, available parking space is shown via a sign or symbol. Due to efficient vehicle management, the driver is correctly advised of the vacant space. This technique detects the presence or absence of automobiles by using several types of sensors as a hardware component in the parking slot. The Smart parking system gives real-time data on the availability of nearby parking spaces and allows drivers to park in that slot without causing any other vehicles to interfere. The global Smart Parking Systems market is expected to rise at a considerable rate in the forthcoming years.

The global Smart Parking Systems market is driven by an increase in parking concerns, rising demand for Internet of Things (IoT)-based technologies, and a high adoption rate in the number of automobiles. However, market growth is constrained by high staffing costs, configuration complexity, and limited internet penetration in developing nations.

Furthermore, a surge in government initiatives to establish smart cities around the world, as well as increased investment in developing autonomous vehicles, are likely to generate enormous chances for the market to grow.

Report Metric Details
Market size available for years 2023–2030
Base year considered 2023
Forecast period 2024–2030
Forecast unit Value (USD Million)
Segments covered Type, Technology, Application, End User, and Region.
Regions covered North America (the U.S. and Canada), Europe (UK, Germany, France, Italy, Spain, Russia, Rest of Europe), Asia-Pacific (China, India, Japan, Australia, South East Asia, Rest of Asia Pacific), Latin America and the Middle East and Africa (Brazil, Saudi Arabia, UAE, Rest of LAMEA)
Companies covered Streetline, Inc., Cisco Systems, Inc., ParkMe, Inc., Urbiotica, Skidata AG, Amano McGann, Inc., Swarco AG, Smart Parking Ltd, Nedap N.V., Parkmobile, LLC.


Smart Parking Systems Market Segment Overview


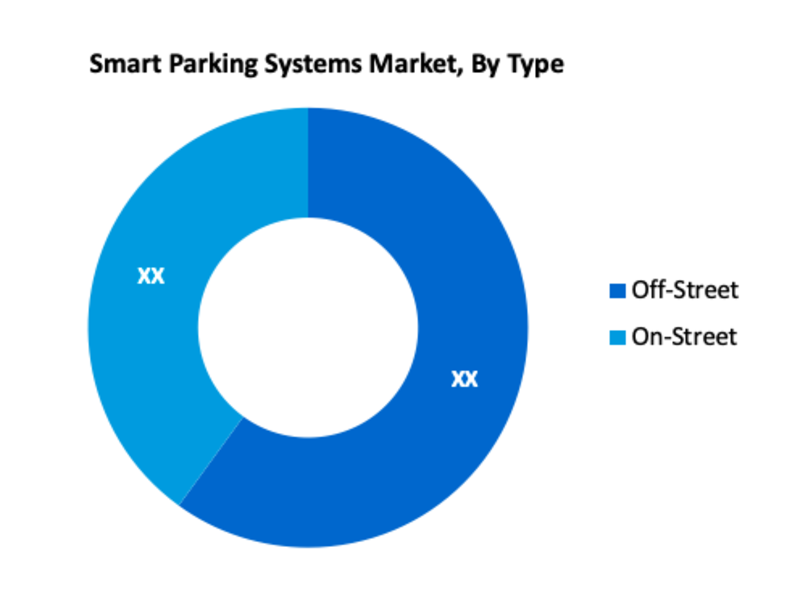
Based Type, Off-Street is the most prominent segment in the global Smart Parking Systems market. off-street smart parking systems are in large demand owing to the ease with which they can be employed and fine-tuned. Moreover, they can be privately owned, while almost all on-street parking spaces are owned by the government. Consequently, while the need for smart parking systems is tremendously high on both sites, it is being implemented on a larger scale in off-street sites. Further, most off-street parking areas are made of commercial parking lots and garages. 
 
Smart Parking Systems Market, By Type
 
·       Off-Street
·       On-Street
 
Smart Parking Systems Market, By Technology
 
·       IoT
·       Ultrasonic
·       RFID
 
Smart Parking Systems Market, By Application
 
·       Security & Surveillance
·       Smart Payment System
·       E parking
·       License Plate Recognition
 
Smart Parking Systems Market, By End User
 
·       Commercial
·       Government
 
Smart Parking Systems Market Regional Overview

Region-Wise, North America commanded a major share, in terms of revenue, and is predictable to maintain its supremacy over the forecast period. This is because of the presence of dense traffic in cities such as New York, Los Angeles, and others. In addition to this, these cities are also viewing a greater level of awareness towards modern solutions for traffic control and parking, thus becoming an optimized region for the large-scale adoption of smart parking systems. 
 
Smart Parking Systems Market, By Geography
 
·       North America (US & Canada)
·       Europe (UK, Germany, France, Italy, Spain, Russia & Rest of Europe)
·       Asia-Pacific (Japan, China, India, Australia, & South Korea, & Rest of Asia-Pacific)
·       LAMEA (Brazil, Saudi Arabia, UAE & Rest of LAMEA)
 
Smart Parking Systems Market, Key Players

·       Streetline, Inc.
·       Cisco Systems, Inc.
·       ParkMe, Inc.
·       Urbioticas
·       Skidata AG
·       Amano McGann, Inc.
·       Swarco AG
·       Smart Parking Ltd
·       Nedap N.V.
·       Parkmobile, LLC.

Frequently Asked Questions (FAQ) :

Q1. What are the driving factors for the Smart Parking Systems market?

The global Smart Parking Systems market is driven by an increase in parking concerns, rising demand for Internet of Things (IoT)-based technologies, and a high adoption rate in the number of automobiles.

Q2. What are the restraining factors for the Smart Parking Systems market?

Market growth is constrained by high staffing costs, configuration complexity, and limited internet penetration in developing nations.

Q3. Which segment is projected to hold the largest share in the Smart Parking Systems Market?

Off-Street segment is projected to hold the largest share in the Smart Parking Systems Market

Q4. Which region holds the largest share in the Smart Parking Systems market?

North America held the largest share in the global Smart Parking Systems market

Q5. Which are the prominent players in the Smart Parking Systems Market?

Streetline, Inc., Cisco Systems, Inc., ParkMe, Inc., Urbiotica, Skidata AG, Amano McGann, Inc., Swarco AG, Smart Parking Ltd, Nedap N.V., Parkmobile, LLC. are some key players in the Smart Parking Systems Market
Smart Parking Systems Market Study Global Market Analysis, Insights and Forecast, 2020-2027

    1. Introduction

    • 1.1. Research Scope
    • 1.2. Market Segmentation
    • 1.3. Research Methodology
    • 1.4. Definitions and Assumptions

    2. Executive Summary

      3. Market Dynamics

      • 3.1. Market Drivers
      • 3.2. Market Restraints
      • 3.3. Market Opportunities

      4. Key Insights

      • 4.1. Key Emerging Trends – For Major Countries
      • 4.2. Latest Technological Advancement
      • 4.3. Regulatory Landscape
      • 4.4. Industry SWOT Analysis
      • 4.5. Porters Five Forces Analysis

      5. Global Smart Parking Systems Market Analysis (USD Billion), Insights and Forecast, 2020-2027

      • 5.1. Key Findings / Summary
      • 5.2. Market Analysis, Insights and Forecast – By Type
        • 5.2.1. Off-Street
        • 5.2.2. On-Street
      • 5.3. Market Analysis, Insights and Forecast – By Technology
        • 5.3.1. IoT
        • 5.3.2. Ultrasonic
        • 5.3.3. RFID
      • 5.4. Market Analysis, Insights and Forecast – By Application
        • 5.4.1. Security & Surveillance
        • 5.4.2. Smart Payment System
        • 5.4.3. E parking
        • 5.4.4. License Plate Recognition
      • 5.5. Market Analysis, Insights and Forecast – By End User
        • 5.5.1. Commercial
        • 5.5.2. Government
      • 5.6. Market Analysis, Insights and Forecast – By Region
        • 5.6.1. North America
        • 5.6.2. Europe
        • 5.6.3. Asia Pacific
        • 5.6.4. Latin America, Middle East and Africa

      6. North America Smart Parking Systems Market Analysis (USD Billion), Insights and Forecast, 2020-2027

      • 6.1. Key Findings / Summary
      • 6.2. Market Analysis, Insights and Forecast – By Type
        • 6.2.1. Off-Street
        • 6.2.2. On-Street
      • 6.3. Market Analysis, Insights and Forecast – By Technology
        • 6.3.1. IoT
        • 6.3.2. Ultrasonic
        • 6.3.3. RFID
      • 6.4. Market Analysis, Insights and Forecast – By Application
        • 6.4.1. Security & Surveillance
        • 6.4.2. Smart Payment System
        • 6.4.3. E parking
        • 6.4.4. License Plate Recognition
      • 6.5. Market Analysis, Insights and Forecast – By End User
        • 6.5.1. Commercial
        • 6.5.2. Government
      • 6.6. Market Analysis, Insights and Forecast – By Country
        • 6.6.1. U.S.
        • 6.6.2. Canada

      7. Europe Smart Parking Systems Market Analysis (USD Billion), Insights and Forecast, 2020-2027

      • 7.1. Key Findings / Summary
      • 7.2. Market Analysis, Insights and Forecast – By Type
        • 7.2.1. Off-Street
        • 7.2.2. On-Street
      • 7.3. Market Analysis, Insights and Forecast – By Technology
        • 7.3.1. IoT
        • 7.3.2. Ultrasonic
        • 7.3.3. RFID
      • 7.4. Market Analysis, Insights and Forecast – By Application
        • 7.4.1. Security & Surveillance
        • 7.4.2. Smart Payment System
        • 7.4.3. E parking
        • 7.4.4. License Plate Recognition
      • 7.5. Market Analysis, Insights and Forecast – By End User
        • 7.5.1. Commercial
        • 7.5.2. Government
      • 7.6. Market Analysis, Insights and Forecast – By Country
        • 7.6.1. UK
        • 7.6.2. Germany
        • 7.6.3. France
        • 7.6.4. Italy
        • 7.6.5. Spain
        • 7.6.6. Russia
        • 7.6.7. Rest of Europe

      8. Asia Pacific Smart Parking Systems Market Analysis (USD Billion), Insights and Forecast, 2020-2027

      • 8.1. Key Findings / Summary
      • 8.2. Market Analysis, Insights and Forecast – By Type
        • 8.2.1. Off-Street
        • 8.2.2. On-Street
      • 8.3. Market Analysis, Insights and Forecast – By Technology
        • 8.3.1. IoT
        • 8.3.2. Ultrasonic
        • 8.3.3. RFID
      • 8.4. Market Analysis, Insights and Forecast – By Application
        • 8.4.1. Security & Surveillance
        • 8.4.2. Smart Payment System
        • 8.4.3. E parking
        • 8.4.4. License Plate Recognition
      • 8.5. Market Analysis, Insights and Forecast – By End User
        • 8.5.1. Commercial
        • 8.5.2. Government
      • 8.6. Market Analysis, Insights and Forecast – By Country
        • 8.6.1. China
        • 8.6.2. India
        • 8.6.3. Japan
        • 8.6.4. Australia
        • 8.6.5. South East Asia
        • 8.6.6. Rest of Asia Pacific

      9. Latin America, Middle East and Africa Smart Parking Systems Market Analysis (USD Billion), Insights and Forecast, 2020-2027

      • 9.1. Key Findings / Summary
      • 9.2. Market Analysis, Insights and Forecast – By Type
        • 9.2.1. Off-Street
        • 9.2.2. On-Street
      • 9.3. Market Analysis, Insights and Forecast – By Technology
        • 9.3.1. IoT
        • 9.3.2. Ultrasonic
        • 9.3.3. RFID
      • 9.4. Market Analysis, Insights and Forecast – By Application
        • 9.4.1. Security & Surveillance
        • 9.4.2. Smart Payment System
        • 9.4.3. E parking
        • 9.4.4. License Plate Recognition
      • 9.5. Market Analysis, Insights and Forecast – By End User
        • 9.5.1. Commercial
        • 9.5.2. Government
      • 9.6. Market Analysis, Insights and Forecast – By Country
        • 9.6.1. Brazil
        • 9.6.2. Saudi Arabia
        • 9.6.3. UAE
        • 9.6.4. Rest of LAMEA

      10. Competitive Analysis

      • 10.1. Company Market Share Analysis, 2018
      • 10.2. Key Industry Developments
      • 10.3. Company Profile
      • 10.4. Streetline, Inc.
        • 10.4.1. Business Overview
        • 10.4.2. Segment 1 & Service Offering
        • 10.4.3. Overall Revenue
        • 10.4.4. Geographic Presence
        • 10.4.5. Recent Development
      *Similar details will be provided for the following companies
      • 10.5. Cisco Systems, Inc.
      • 10.6. ParkMe, Inc.
      • 10.7. Urbioticas
      • 10.8. Skidata AG
      • 10.9. Amano McGann, Inc.
      • 10.10. Swarco AG
      • 10.11. Smart Parking Ltd
      • 10.12. Nedap N.V.
      List of Figures

      Figure 1: Global Smart Parking Systems Market Revenue Breakdown (USD Billion, %) by Region, 2019 & 2027
      Figure 2: Global Market Value Share (%), By Segment 1, 2019 & 2027
      Figure 3: Global Market Forecast (USD Billion), by Sub-Segment 1, 2016-2027
      Figure 4: Global Market Forecast (USD Billion), by Sub-Segment 2, 2016-2027
      Figure 5: Global Market Value Share (%), By Segment 2, 2019 & 2027
      Figure 6: Global Market Forecast (USD Billion), by Sub-Segment 1, 2016-2027
      Figure 7: Global Market Forecast (USD Billion), by Sub-Segment 2, 2016-2027
      Figure 8: Global Market Forecast (USD Billion), by Sub-Segment 3, 2016-2027
      Figure 9: Global Smart Parking Systems Market Forecast (USD Billion), by Others, 2016-2027
      Figure 10: Global Market Value Share (%), By Segment 3, 2019 & 2027
      Figure 11: Global Market Forecast (USD Billion), by Sub-Segment 1, 2016-2027
      Figure 12: Global Market Forecast (USD Billion), by Sub-Segment 2, 2016-2027
      Figure 13: Global Market Forecast (USD Billion), by Sub-Segment 3, 2016-2027
      Figure 14: Global Market Forecast (USD Billion), by Others, 2016-2027
      Figure 15: Global Market Value (USD Billion), by Region, 2019 & 2027
      Figure 16: North America Smart Parking Systems Market Value Share (%), By Segment 1, 2019 & 2027
      Figure 17: North America Market Forecast (USD Billion), by Sub-Segment 1, 2016-2027
      Figure 18: North America Market Forecast (USD Billion), by Sub-Segment 2, 2016-2027
      Figure 19: North America Market Value Share (%), By Segment 2, 2019 & 2027
      Figure 20: North America Market Forecast (USD Billion), by Sub-Segment 1, 2016-2027
      Figure 21: North America Market Forecast (USD Billion), by Sub-Segment 2, 2016-2027
      Figure 22: North America Market Forecast (USD Billion), by Sub-Segment 3, 2016-2027
      Figure 23: North America Market Forecast (USD Billion), by Others, 2016-2027
      Figure 24: North America Market Value Share (%), By Segment 3, 2019 & 2027
      Figure 25: North America Market Forecast (USD Billion), by Sub-Segment 1, 2016-2027
      Figure 26: North America Market Forecast (USD Billion), by Sub-Segment 2, 2016-2027
      Figure 27: North America Market Forecast (USD Billion), by Sub-Segment 3, 2016-2027
      Figure 28: North America Market Forecast (USD Billion), by Others, 2016-2027
      Figure 29: North America Market Forecast (USD Billion), by U.S., 2016-2027
      Figure 30: North America Market Forecast (USD Billion), by Canada, 2016-2027
      Figure 31: Latin America Smart Parking Systems Market Value Share (%), By Segment 1, 2019 & 2027
      Figure 32: Latin America Market Forecast (USD Billion), by Sub-Segment 1, 2016-2027
      Figure 33: Latin America Market Forecast (USD Billion), by Sub-Segment 2, 2016-2027
      Figure 34: Latin America Market Value Share (%), By Segment 2, 2019 & 2027
      Figure 35: Latin America Market Forecast (USD Billion), by Sub-Segment 1, 2016-2027
      Figure 36: Latin America Market Forecast (USD Billion), by Sub-Segment 2, 2016-2027
      Figure 37: Latin America Market Forecast (USD Billion), by Sub-Segment 3, 2016-2027
      Figure 38: Latin America Market Forecast (USD Billion), by Others, 2016-2027
      Figure 39: Latin America Market Value Share (%), By Segment 3, 2019 & 2027
      Figure 40: Latin America Market Forecast (USD Billion), by Sub-Segment 1, 2016-2027
      Figure 41: Latin America Market Forecast (USD Billion), by Sub-Segment 2, 2016-2027
      Figure 42: Latin America Market Forecast (USD Billion), by Sub-Segment 3, 2016-2027
      Figure 43: Latin America Market Forecast (USD Billion), by Others, 2016-2027
      Figure 44: Latin America Market Forecast (USD Billion), by Brazil, 2016-2027
      Figure 45: Latin America Market Forecast (USD Billion), by Mexico, 2016-2027
      Figure 46: Latin America Market Forecast (USD Billion), by Rest of Latin America, 2016-2027
      Figure 47: Europe Smart Parking Systems Market Value Share (%), By Segment 1, 2019 & 2027
      Figure 48: Europe Market Forecast (USD Billion), by Sub-Segment 1, 2016-2027
      Figure 49: Europe Market Forecast (USD Billion), by Sub-Segment 2, 2016-2027
      Figure 50: Europe Market Value Share (%), By Segment 2, 2019 & 2027
      Figure 51: Europe Market Forecast (USD Billion), by Sub-Segment 1, 2016-2027
      Figure 52: Europe Market Forecast (USD Billion), by Sub-Segment 2, 2016-2027
      Figure 53: Europe Market Forecast (USD Billion), by Sub-Segment 3, 2016-2027
      Figure 54: Europe Market Forecast (USD Billion), by Others, 2016-2027
      Figure 55: Europe Market Value Share (%), By Segment 3, 2019 & 2027
      Figure 56: Europe Market Forecast (USD Billion), by Sub-Segment 1, 2016-2027
      Figure 57: Europe Market Forecast (USD Billion), by Sub-Segment 2, 2016-2027
      Figure 58: Europe Market Forecast (USD Billion), by Sub-Segment 3, 2016-2027
      Figure 59: Europe Market Forecast (USD Billion), by Others, 2016-2027
      Figure 60: Europe Market Forecast (USD Billion), by U.K., 2016-2027
      Figure 61: Europe Market Forecast (USD Billion), by Germany, 2016-2027
      Figure 62: Europe Market Forecast (USD Billion), by France, 2016-2027
      Figure 63: Europe Market Forecast (USD Billion), by Italy, 2016-2027
      Figure 64: Europe Market Forecast (USD Billion), by Spain, 2016-2027
      Figure 65: Europe Market Forecast (USD Billion), by Russia, 2016-2027
      Figure 66: Europe Market Forecast (USD Billion), by Rest of Europe, 2016-2027
      Figure 67: Asia Pacific Smart Parking Systems Market Value Share (%), By Segment 1, 2019 & 2027
      Figure 68: Asia Pacific Market Forecast (USD Billion), by Sub-Segment 1, 2016-2027
      Figure 69: Asia Pacific Market Forecast (USD Billion), by Sub-Segment 2, 2016-2027
      Figure 70: Asia Pacific Market Value Share (%), By Segment 2, 2019 & 2027
      Figure 71: Asia Pacific Market Forecast (USD Billion), by Sub-Segment 1, 2016-2027
      Figure 72: Asia Pacific Market Forecast (USD Billion), by Sub-Segment 2, 2016-2027
      Figure 73: Asia Pacific Market Forecast (USD Billion), by Sub-Segment 3, 2016-2027
      Figure 74: Asia Pacific Market Forecast (USD Billion), by Others, 2016-2027
      Figure 75: Asia Pacific Market Value Share (%), By Segment 3, 2019 & 2027
      Figure 76: Asia Pacific Market Forecast (USD Billion), by Sub-Segment 1, 2016-2027
      Figure 77: Asia Pacific Market Forecast (USD Billion), by Sub-Segment 2, 2016-2027
      Figure 78: Asia Pacific Market Forecast (USD Billion), by Sub-Segment 3, 2016-2027
      Figure 79: Asia Pacific Market Forecast (USD Billion), by Others, 2016-2027
      Figure 80: Asia Pacific Market Forecast (USD Billion), by China, 2016-2027
      Figure 81: Asia Pacific Market Forecast (USD Billion), by India, 2016-2027
      Figure 82: Asia Pacific Market Forecast (USD Billion), by Japan, 2016-2027
      Figure 83: Asia Pacific Market Forecast (USD Billion), by Australia, 2016-2027
      Figure 84: Asia Pacific Market Forecast (USD Billion), by Southeast Asia, 2016-2027
      Figure 85: Asia Pacific Market Forecast (USD Billion), by Rest of Asia Pacific, 2016-2027
      Figure 86: Middle East & Africa Smart Parking Systems Market Value Share (%), By Segment 1, 2019 & 2027
      Figure 87: Middle East & Africa Market Forecast (USD Billion), by Sub-Segment 1, 2016-2027
      Figure 88: Middle East & Africa Market Forecast (USD Billion), by Sub-Segment 2, 2016-2027
      Figure 89: Middle East & Africa Market Value Share (%), By Segment 2, 2019 & 2027
      Figure 90: Middle East & Africa Market Forecast (USD Billion), by Sub-Segment 1, 2016-2027
      Figure 91: Middle East & Africa Market Forecast (USD Billion), by Sub-Segment 2, 2016-2027
      Figure 92: Middle East & Africa Market Forecast (USD Billion), by Sub-Segment 3, 2016-2027
      Figure 93: Middle East & Africa Market Forecast (USD Billion), by Others, 2016-2027
      Figure 94: Middle East & Africa Market Value Share (%), By Segment 3, 2019 & 2027
      Figure 95: Middle East & Africa Market Forecast (USD Billion), by Sub-Segment 1, 2016-2027
      Figure 96: Middle East & Africa Market Forecast (USD Billion), by Sub-Segment 2, 2016-2027
      Figure 97: Middle East & Africa Market Forecast (USD Billion), by Sub-Segment 3, 2016-2027
      Figure 98: Middle East & Africa Market Forecast (USD Billion), by Others, 2016-2027
      Figure 99: Middle East & Africa Market Forecast (USD Billion), by GCC, 2016-2027
      Figure 100: Middle East & Africa Market Forecast (USD Billion), by South Africa, 2016-2027
      Figure 101: Middle East & Africa Market Forecast (USD Billion), by Rest of Middle East & Africa, 2016-2027 
      List of Tables
      Table 1: Global Smart Parking Systems Market Revenue (USD Billion) Forecast, by Segment 1, 2016-2027
      Table 2: Global Market Revenue (USD Billion) Forecast, by Segment 2, 2016-2027
      Table 3: Global Market Revenue (USD Billion) Forecast, by Segment 3, 2016-2027
      Table 4: Global Market Revenue (USD Billion) Forecast, by Region, 2016-2027
      Table 5: North America Smart Parking Systems Market Revenue (USD Billion) Forecast, by Segment 1, 2016-2027
      Table 6: North America Market Revenue (USD Billion) Forecast, by Segment 2, 2016-2027
      Table 7: North America Market Revenue (USD Billion) Forecast, by Segment 3, 2016-2027
      Table 8: North America Market Revenue (USD Billion) Forecast, by Country, 2016-2027
      Table 9: Europe Smart Parking Systems Market Revenue (USD Billion) Forecast, by Segment 1, 2016-2027
      Table 10: Europe Market Revenue (USD Billion) Forecast, by Segment 2, 2016-2027
      Table 11: Europe Market Revenue (USD Billion) Forecast, by Segment 3, 2016-2027
      Table 12: Europe Market Revenue (USD Billion) Forecast, by Country, 2016-2027
      Table 13: Latin America Smart Parking Systems Market Revenue (USD Billion) Forecast, by Segment 1, 2016-2027
      Table 14: Latin America Market Revenue (USD Billion) Forecast, by Segment 2, 2016-2027
      Table 15: Latin America Market Revenue (USD Billion) Forecast, by Segment 3, 2016-2027
      Table 16: Latin America Market Revenue (USD Billion) Forecast, by Country, 2016-2027
      Table 17: Asia Pacific Smart Parking Systems Market Revenue (USD Billion) Forecast, by Segment 1, 2016-2027
      Table 18: Asia Pacific Market Revenue (USD Billion) Forecast, by Segment 2, 2016-2027
      Table 19: Asia Pacific Market Revenue (USD Billion) Forecast, by Segment 3, 2016-2027
      Table 20: Asia Pacific Market Revenue (USD Billion) Forecast, by Country, 2016-2027
      Table 21: Middle East & Africa Smart Parking Systems Market Revenue (USD Billion) Forecast, by Segment 1, 2016-2027
      Table 22: Middle East & Africa Market Revenue (USD Billion) Forecast, by Segment 2, 2016-2027
      Table 23: Middle East & Africa Market Revenue (USD Billion) Forecast, by Segment 3, 2016-2027
      Table 24: Middle East & Africa Market Revenue (USD Billion) Forecast, by Country, 2016-2027
      Research Process

      Data Library Research are conducted by industry experts who offer insight on industry structure, market segmentations technology assessment and competitive landscape (CL), and penetration, as well as on emerging trends. Their analysis is based on primary interviews (~ 80%) and secondary research (~ 20%) as well as years of professional expertise in their respective industries. Adding to this, by analysing historical trends and current market positions, our analysts predict where the market will be headed for the next five years. Furthermore, the varying trends of segment & categories geographically presented are also studied and the estimated based on the primary & secondary research.

      In this particular report from the supply side Data Library Research has conducted primary surveys (interviews) with the key level executives (VP, CEO’s, Marketing Director, Business Development Manager and SOFT) of the companies that active & prominent as well as the midsized organization

      FIGURE 1: DLR RESEARH PROCESS

      research-methodology1

      Primary Research

      Extensive primary research was conducted to gain a deeper insight of the market and industry performance. The analysis is based on both primary and secondary research as well as years of professional expertise in the respective industries.

      In addition to analysing current and historical trends, our analysts predict where the market is headed over the next five years.

      It varies by segment for these categories geographically presented in the list of market tables. Speaking about this particular report we have conducted primary surveys (interviews) with the key level executives (VP, CEO’s, Marketing Director, Business Development Manager and many more) of the major players active in the market.

      Secondary Research

      Secondary research was mainly used to collect and identify information useful for the extensive, technical, market-oriented, and Friend’s study of the Global Extra Neutral Alcohol. It was also used to obtain key information about major players, market classification and segmentation according to the industry trends, geographical markets, and developments related to the market and technology perspectives. For this study, analysts have gathered information from various credible sources, such as annual reports, sec filings, journals, white papers, SOFT presentations, and company web sites.

      Market Size Estimation

      Both, top-down and bottom-up approaches were used to estimate and validate the size of the Global market and to estimate the size of various other dependent submarkets in the overall Extra Neutral Alcohol. The key players in the market were identified through secondary research and their market contributions in the respective geographies were determined through primary and secondary research.

      Forecast Model

      research-methodology2