Global Structured Cabling Market Opportunities and Forecast 2023-2030

  •   DLR1974
  •   February, 2022
  •   Pages: 120
  •  Global
Structured Cabling Market Overview

The global Structured Cabling market is projected to rise at a significant rate in the estimated period.  The global structured cabling market has been driven by rising demand for high bandwidth, as well as the expansion and modernization of communication infrastructure propelled by economic growth. Growing need to facilitate rapid communication and optimized energy consumption, the IT & telecommunication industry is growing rapidly. This is one of the most significant factors for the growth of the global Structured Cabling market.
 
The growth of the cable network, fuelled by the modernization of infrastructure in developing economies, is driving up demand for structured cabling around the world. In addition to this, the IT & telecommunication industry's demand for high-bandwidth telecommunication infrastructure is expected to increase in the next years as the focus on IoT (Internet of Things) applications grows. As a result, the structured cabling industry is expected to grow during the forecast period.

Report Metric Details
Market size available for years 2023–2030
Base year considered 2023
Forecast period 2024–2030
Forecast unit Value (USD Million)
Segments covered Solution, End-user, and Region.
Regions covered North America (the U.S. and Canada), Europe (UK, Germany, France, Italy, Spain, Russia, Rest of Europe), Asia-Pacific (China, India, Japan, Australia, South East Asia, Rest of Asia Pacific), Latin America and the Middle East and Africa (Brazil, Saudi Arabia, UAE, Rest of LAMEA)
Companies covered ABB Ltd., The Cabling Company Group, Belden Inc., CommScope Corning, Inc., Dätwyler Cabling Solutions AG, Legrand, Nexans, Schneider Electric SE, TE Connectivity Ltd.


Covid-19 Impact on Structured Cabling Market

Like many other industries, COVID-19 badly knocked the electronic and semiconductor industries. This unprecedented event has impacted nearly 230 countries in just a few weeks, resulting in the forced shutdown of manufacturing and transportation activities within and across the countries. This has directly affected the overall sector's growth. It is estimated that COVID-19 to leave more than USD 30 billion impacts on the electronics and semiconductor industry. The sector is majorly affected due to transport restrictions on major electronics and semiconductor raw material providers. However, the emerging need for semiconductors in several industries will offer rapid market recovery over the future period.
 
Structured Cabling Market Segment Overview


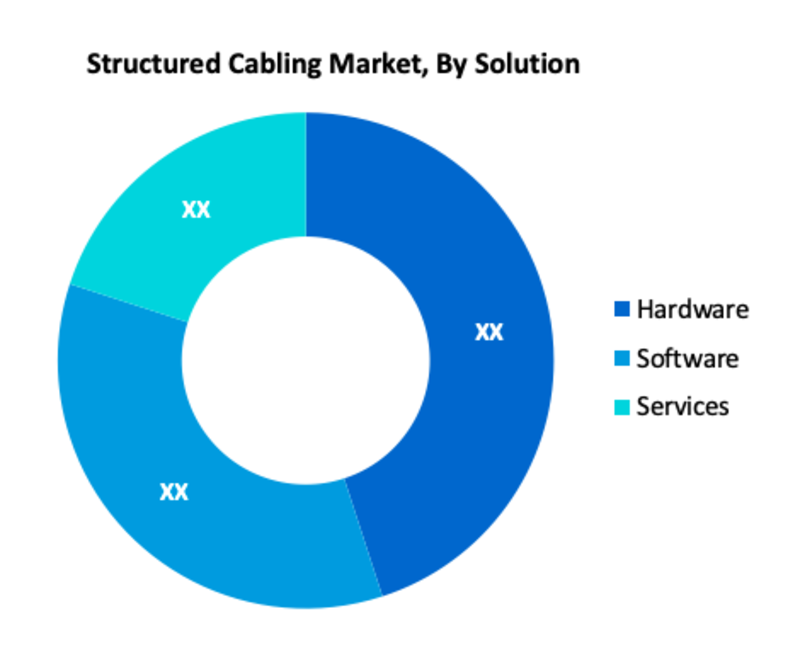
Based on Solution, Hardware is one of the most prominent segments in the global Structured Cabling market. Due to the constant installation of a large number of machines and assembly units around the world, followed by extensive wiring systems, the hardware sector has seen tremendous growth. During the forecast period, this is projected to continue to boost demand for structured cabling. Furthermore, the industrial end-user segment is expected to enlarge at a substantial CAGR in the forecast period. This is due to the rising penetration of portable computing devices and the increasing dependency of several industrial sectors on cloud applications.
 
Structured Cabling Market, By Solution
  • Hardware
    • Copper Cable
    • Fiber Optic Cable
    • Enclosure
  • Software
  • Services
    • Installation
    • Consulting
    • Maintenance & Support
Structured Cabling Market, By End-user
·       Commercial & Residential
·       IT & Telecommunication
·       Government
·       Industrial
·       Others (mining and education)

Structured Cabling Market Regional Overview

In terms of region, North America commanded a major share, in terms of revenue, and is predictable to maintain its supremacy over the forecast period. This is due to the presence of major manufacturers and the growth of the IT & telecom industry in this region. Furthermore, the structured cabling market in North America is being boosted by the large quantity of wire and cable shipments to electric utilities in the region. The United States dominated the North American market. Additionally, the market in the Asia Pacific is expected to grow at a considerable rate in the forthcoming years. Because of the rapid growth of the IT industry and increased government spending on infrastructure development in these countries, demand for structured cabling in the Asia Pacific is expected to remain concentrated in China and Japan. Due to the country's fast urbanization and increased construction of residential and commercial structures, the market in India is expected to grow at the highest CAGR during the forecast period.
 
Structured Cabling Market, By Geography
 
·       North America (US & Canada)
·       Europe (UK, Germany, France, Italy, Spain, Russia & Rest of Europe)
·       Asia-Pacific (Japan, China, India, Australia, & South Korea, & Rest of Asia-Pacific)
·       LAMEA (Brazil, Saudi Arabia, UAE & Rest of LAMEA)
 
Structured Cabling Market Competitor overview

Some key developments and strategies adopted by manufacturers in the Structured Cabling are highlighted below.

·       In December 2021, Kane Infrastructure Services Holdings, LLC, an Aterian Investment Partners portfolio company, is announced the acquisition of Cable Solutions, LLC.  This represents Kane's first acquisition as it executes its strategy of acquiring leading service companies across the nation in the high growth and very fragmented communications and utility infrastructure markets. As a result of the acquisition, Kane has expanded its geographic reach to cover from the Northeast to the Southwest providing a national service footprint for its customers.

Structured Cabling Market, Key Players

·       ABB Ltd.
·       The Cabling Company Group
·       Belden Inc.
·       CommScope Corning, Inc.
·       Dätwyler Cabling Solutions AG
·       Legrand
·       Nexans
·       Schneider Electric SE
·       TE Connectivity Ltd

Frequently Asked Questions (FAQ) :

Q1. What are the driving factors for the Structured Cabling market?

Growing need to facilitate rapid communication and optimized energy consumption, IT & telecommunication industry is growing rapidly. This is one of the most significant factors for the growth of the global Structured Cabling market.

Q2. Which Segments are covered in the Structured Cabling Market report?

Solution, End-user, and Region. these segments are covered in the Structured Cabling market report.

Q3. Which segment is projected to hold the largest share in the Structured Cabling Market?

The hardware segment is projected to hold the largest share in the Structured Cabling Market.

Q4. Which region holds the largest share in the Structured Cabling market?

North America held the largest share in the global Structured Cabling market

Q5. Which are the prominent players in the Structured Cabling Market?

ABB Ltd., The Cabling Company Group, Belden Inc., CommScope Corning, Inc., Dätwyler Cabling Solutions AG, Legrand, Nexans, Schneider Electric SE, TE Connectivity Ltd. are some key players in the Structured Cabling Market
Structured Cabling Market Study Global Market Analysis, Insights and Forecast, 2020-2027

    1. Introduction

    • 1.1. Research Scope
    • 1.2. Market Segmentation
    • 1.3. Research Methodology
    • 1.4. Definitions and Assumptions

    2. Executive Summary

      3. Market Dynamics

      • 3.1. Market Drivers
      • 3.2. Market Restraints
      • 3.3. Market Opportunities

      4. Key Insights

      • 4.1. Key Emerging Trends – For Major Countries
      • 4.2. Latest Technological Advancement
      • 4.3. Regulatory Landscape
      • 4.4. Industry SWOT Analysis
      • 4.5. Porters Five Forces Analysis

      5. Global Structured Cabling Market Analysis (USD Billion), Insights and Forecast, 2020-2027

      • 5.1. Key Findings / Summary
      • 5.2. Market Analysis, Insights and Forecast – By Solution
        • 5.2.1. Hardware
          • 5.2.1.1. Copper Cable
          • 5.2.1.2. Fiber Optic Cable
          • 5.2.1.3. Enclosure
        • 5.2.2. Software
        • 5.2.3. Services
          • 5.2.3.1. Installation
          • 5.2.3.2. Consulting
          • 5.2.3.3. Maintenance & Support
    • 5.3. Market Analysis, Insights and Forecast – By End-user
      • 5.3.1. Commercial & Residential
      • 5.3.2. IT & Telecommunication
      • 5.3.3. Government
      • 5.3.4. Industrial
      • 5.3.5. Others (mining and education)
    • 5.4. Market Analysis, Insights and Forecast – By Region
      • 5.4.1. North America
      • 5.4.2. Europe
      • 5.4.3. Asia Pacific
      • 5.4.4. Latin America, Middle East and Africa
    • 6. North America Structured Cabling Market Analysis (USD Billion), Insights and Forecast, 2020-2027

      • 6.1. Key Findings / Summary
      • 6.2. Market Analysis, Insights and Forecast – By Solution
        • 6.2.1. Hardware
          • 6.2.1.1. Copper Cable
          • 6.2.1.2. Fiber Optic Cable
          • 6.2.1.3. Enclosure
        • 6.2.2. Software
        • 6.2.3. Services
          • 6.2.3.1. Installation
          • 6.2.3.2. Consulting
          • 6.2.3.3. Maintenance & Support
    • 6.3. Market Analysis, Insights and Forecast – By End-user
      • 6.3.1. Commercial & Residential
      • 6.3.2. IT & Telecommunication
      • 6.3.3. Government
      • 6.3.4. Industrial
      • 6.3.5. Others (mining and education)
    • 6.4. Market Analysis, Insights and Forecast – By Country
      • 6.4.1. U.S.
      • 6.4.2. Canada
    • 7. Europe Structured Cabling Market Analysis (USD Billion), Insights and Forecast, 2020-2027

      • 7.1. Key Findings / Summary
      • 7.2. Market Analysis, Insights and Forecast – By Solution
        • 7.2.1. Hardware
          • 7.2.1.1. Copper Cable
          • 7.2.1.2. Fiber Optic Cable
          • 7.2.1.3. Enclosure
        • 7.2.2. Software
        • 7.2.3. Services
          • 7.2.3.1. Installation
          • 7.2.3.2. Consulting
          • 7.2.3.3. Maintenance & Support
    • 7.3. Market Analysis, Insights and Forecast – By End-user
      • 7.3.1. Commercial & Residential
      • 7.3.2. IT & Telecommunication
      • 7.3.3. Government
      • 7.3.4. Industrial
      • 7.3.5. Others (mining and education)
    • 7.4. Market Analysis, Insights and Forecast – By Country
      • 7.4.1. UK
      • 7.4.2. Germany
      • 7.4.3. France
      • 7.4.4. Italy
      • 7.4.5. Spain
      • 7.4.6. Russia
      • 7.4.7. Rest of Europe
    • 8. Asia Pacific Structured Cabling Market Analysis (USD Billion), Insights and Forecast, 2020-2027

      • 8.1. Key Findings / Summary
      • 8.2. Market Analysis, Insights and Forecast – By Solution
        • 8.2.1. Hardware
          • 8.2.1.1. Copper Cable
          • 8.2.1.2. Fiber Optic Cable
          • 8.2.1.3. Enclosure
        • 8.2.2. Software
        • 8.2.3. Services
          • 8.2.3.1. Installation
          • 8.2.3.2. Consulting
          • 8.2.3.3. Maintenance & Support
    • 8.3. Market Analysis, Insights and Forecast – By End-user
      • 8.3.1. Commercial & Residential
      • 8.3.2. IT & Telecommunication
      • 8.3.3. Government
      • 8.3.4. Industrial
      • 8.3.5. Others (mining and education)
    • 8.4. Market Analysis, Insights and Forecast – By Country
      • 8.4.1. China
      • 8.4.2. India
      • 8.4.3. Japan
      • 8.4.4. Australia
      • 8.4.5. South East Asia
      • 8.4.6. Rest of Asia Pacific
    • 9. Latin America, Middle East and Africa Structured Cabling Market Analysis (USD Billion), Insights and Forecast, 2020-2027

      • 9.1. Key Findings / Summary
      • 9.2. Market Analysis, Insights and Forecast – By Solution
        • 9.2.1. Hardware
          • 9.2.1.1. Copper Cable
          • 9.2.1.2. Fiber Optic Cable
          • 9.2.1.3. Enclosure
        • 9.2.2. Software
        • 9.2.3. Services
          • 9.2.3.1. Installation
          • 9.2.3.2. Consulting
          • 9.2.3.3. Maintenance & Support
    • 9.3. Market Analysis, Insights and Forecast – By End-user
      • 9.3.1. Commercial & Residential
      • 9.3.2. IT & Telecommunication
      • 9.3.3. Government
      • 9.3.4. Industrial
      • 9.3.5. Others (mining and education)
    • 9.4. Market Analysis, Insights and Forecast – By Country
      • 9.4.1. Brazil
      • 9.4.2. Saudi Arabia
      • 9.4.3. UAE
      • 9.4.4. Rest of LAMEA
    • 10. Competitive Analysis

      • 10.1. Company Market Share Analysis, 2018
      • 10.2. Key Industry Developments
      • 10.3. Company Profile
      • 10.4. ABB Ltd.
        • 10.4.1. Business Overview
        • 10.4.2. Segment 1 & Service Offering
        • 10.4.3. Overall Revenue
        • 10.4.4. Geographic Presence
        • 10.4.5. Recent Development
      *Similar details will be provided for the following companies
      • 10.5. The Cabling Company Group
      • 10.6. Belden Inc.
      • 10.7. CommScope Corning, Inc.
      • 10.8. Dätwyler Cabling Solutions AG
      • 10.9. Legrand
      • 10.10. Nexans
      • 10.11. Schneider Electric SE
      List of Figures

      Figure 1: Global Structured Cabling Market Revenue Breakdown (USD Billion, %) by Region, 2019 & 2027
      Figure 2: Global Market Value Share (%), By Segment 1, 2019 & 2027
      Figure 3: Global Market Forecast (USD Billion), by Sub-Segment 1, 2016-2027
      Figure 4: Global Market Forecast (USD Billion), by Sub-Segment 2, 2016-2027
      Figure 5: Global Market Value Share (%), By Segment 2, 2019 & 2027
      Figure 6: Global Market Forecast (USD Billion), by Sub-Segment 1, 2016-2027
      Figure 7: Global Market Forecast (USD Billion), by Sub-Segment 2, 2016-2027
      Figure 8: Global Market Forecast (USD Billion), by Sub-Segment 3, 2016-2027
      Figure 9: Global Structured Cabling Market Forecast (USD Billion), by Others, 2016-2027
      Figure 10: Global Market Value Share (%), By Segment 3, 2019 & 2027
      Figure 11: Global Market Forecast (USD Billion), by Sub-Segment 1, 2016-2027
      Figure 12: Global Market Forecast (USD Billion), by Sub-Segment 2, 2016-2027
      Figure 13: Global Market Forecast (USD Billion), by Sub-Segment 3, 2016-2027
      Figure 14: Global Market Forecast (USD Billion), by Others, 2016-2027
      Figure 15: Global Market Value (USD Billion), by Region, 2019 & 2027
      Figure 16: North America Structured Cabling Market Value Share (%), By Segment 1, 2019 & 2027
      Figure 17: North America Market Forecast (USD Billion), by Sub-Segment 1, 2016-2027
      Figure 18: North America Market Forecast (USD Billion), by Sub-Segment 2, 2016-2027
      Figure 19: North America Market Value Share (%), By Segment 2, 2019 & 2027
      Figure 20: North America Market Forecast (USD Billion), by Sub-Segment 1, 2016-2027
      Figure 21: North America Market Forecast (USD Billion), by Sub-Segment 2, 2016-2027
      Figure 22: North America Market Forecast (USD Billion), by Sub-Segment 3, 2016-2027
      Figure 23: North America Market Forecast (USD Billion), by Others, 2016-2027
      Figure 24: North America Market Value Share (%), By Segment 3, 2019 & 2027
      Figure 25: North America Market Forecast (USD Billion), by Sub-Segment 1, 2016-2027
      Figure 26: North America Market Forecast (USD Billion), by Sub-Segment 2, 2016-2027
      Figure 27: North America Market Forecast (USD Billion), by Sub-Segment 3, 2016-2027
      Figure 28: North America Market Forecast (USD Billion), by Others, 2016-2027
      Figure 29: North America Market Forecast (USD Billion), by U.S., 2016-2027
      Figure 30: North America Market Forecast (USD Billion), by Canada, 2016-2027
      Figure 31: Latin America Structured Cabling Market Value Share (%), By Segment 1, 2019 & 2027
      Figure 32: Latin America Market Forecast (USD Billion), by Sub-Segment 1, 2016-2027
      Figure 33: Latin America Market Forecast (USD Billion), by Sub-Segment 2, 2016-2027
      Figure 34: Latin America Market Value Share (%), By Segment 2, 2019 & 2027
      Figure 35: Latin America Market Forecast (USD Billion), by Sub-Segment 1, 2016-2027
      Figure 36: Latin America Market Forecast (USD Billion), by Sub-Segment 2, 2016-2027
      Figure 37: Latin America Market Forecast (USD Billion), by Sub-Segment 3, 2016-2027
      Figure 38: Latin America Market Forecast (USD Billion), by Others, 2016-2027
      Figure 39: Latin America Market Value Share (%), By Segment 3, 2019 & 2027
      Figure 40: Latin America Market Forecast (USD Billion), by Sub-Segment 1, 2016-2027
      Figure 41: Latin America Market Forecast (USD Billion), by Sub-Segment 2, 2016-2027
      Figure 42: Latin America Market Forecast (USD Billion), by Sub-Segment 3, 2016-2027
      Figure 43: Latin America Market Forecast (USD Billion), by Others, 2016-2027
      Figure 44: Latin America Market Forecast (USD Billion), by Brazil, 2016-2027
      Figure 45: Latin America Market Forecast (USD Billion), by Mexico, 2016-2027
      Figure 46: Latin America Market Forecast (USD Billion), by Rest of Latin America, 2016-2027
      Figure 47: Europe Structured Cabling Market Value Share (%), By Segment 1, 2019 & 2027
      Figure 48: Europe Market Forecast (USD Billion), by Sub-Segment 1, 2016-2027
      Figure 49: Europe Market Forecast (USD Billion), by Sub-Segment 2, 2016-2027
      Figure 50: Europe Market Value Share (%), By Segment 2, 2019 & 2027
      Figure 51: Europe Market Forecast (USD Billion), by Sub-Segment 1, 2016-2027
      Figure 52: Europe Market Forecast (USD Billion), by Sub-Segment 2, 2016-2027
      Figure 53: Europe Market Forecast (USD Billion), by Sub-Segment 3, 2016-2027
      Figure 54: Europe Market Forecast (USD Billion), by Others, 2016-2027
      Figure 55: Europe Market Value Share (%), By Segment 3, 2019 & 2027
      Figure 56: Europe Market Forecast (USD Billion), by Sub-Segment 1, 2016-2027
      Figure 57: Europe Market Forecast (USD Billion), by Sub-Segment 2, 2016-2027
      Figure 58: Europe Market Forecast (USD Billion), by Sub-Segment 3, 2016-2027
      Figure 59: Europe Market Forecast (USD Billion), by Others, 2016-2027
      Figure 60: Europe Market Forecast (USD Billion), by U.K., 2016-2027
      Figure 61: Europe Market Forecast (USD Billion), by Germany, 2016-2027
      Figure 62: Europe Market Forecast (USD Billion), by France, 2016-2027
      Figure 63: Europe Market Forecast (USD Billion), by Italy, 2016-2027
      Figure 64: Europe Market Forecast (USD Billion), by Spain, 2016-2027
      Figure 65: Europe Market Forecast (USD Billion), by Russia, 2016-2027
      Figure 66: Europe Market Forecast (USD Billion), by Rest of Europe, 2016-2027
      Figure 67: Asia Pacific Structured Cabling Market Value Share (%), By Segment 1, 2019 & 2027
      Figure 68: Asia Pacific Market Forecast (USD Billion), by Sub-Segment 1, 2016-2027
      Figure 69: Asia Pacific Market Forecast (USD Billion), by Sub-Segment 2, 2016-2027
      Figure 70: Asia Pacific Market Value Share (%), By Segment 2, 2019 & 2027
      Figure 71: Asia Pacific Market Forecast (USD Billion), by Sub-Segment 1, 2016-2027
      Figure 72: Asia Pacific Market Forecast (USD Billion), by Sub-Segment 2, 2016-2027
      Figure 73: Asia Pacific Market Forecast (USD Billion), by Sub-Segment 3, 2016-2027
      Figure 74: Asia Pacific Market Forecast (USD Billion), by Others, 2016-2027
      Figure 75: Asia Pacific Market Value Share (%), By Segment 3, 2019 & 2027
      Figure 76: Asia Pacific Market Forecast (USD Billion), by Sub-Segment 1, 2016-2027
      Figure 77: Asia Pacific Market Forecast (USD Billion), by Sub-Segment 2, 2016-2027
      Figure 78: Asia Pacific Market Forecast (USD Billion), by Sub-Segment 3, 2016-2027
      Figure 79: Asia Pacific Market Forecast (USD Billion), by Others, 2016-2027
      Figure 80: Asia Pacific Market Forecast (USD Billion), by China, 2016-2027
      Figure 81: Asia Pacific Market Forecast (USD Billion), by India, 2016-2027
      Figure 82: Asia Pacific Market Forecast (USD Billion), by Japan, 2016-2027
      Figure 83: Asia Pacific Market Forecast (USD Billion), by Australia, 2016-2027
      Figure 84: Asia Pacific Forecast (USD Billion), by Southeast Asia, 2016-2027
      Figure 85: Asia Pacific Cabling Market Forecast (USD Billion), by Rest of Asia Pacific, 2016-2027
      Figure 86: Middle East & Africa Structured Cabling Market Value Share (%), By Segment 1, 2019 & 2027
      Figure 87: Middle East & Africa Market Forecast (USD Billion), by Sub-Segment 1, 2016-2027
      Figure 88: Middle East & Africa Market Forecast (USD Billion), by Sub-Segment 2, 2016-2027
      Figure 89: Middle East & Africa Market Value Share (%), By Segment 2, 2019 & 2027
      Figure 90: Middle East & Africa Market Forecast (USD Billion), by Sub-Segment 1, 2016-2027
      Figure 91: Middle East & Africa Market Forecast (USD Billion), by Sub-Segment 2, 2016-2027
      Figure 92: Middle East & Africa Market Forecast (USD Billion), by Sub-Segment 3, 2016-2027
      Figure 93: Middle East & Africa Market Forecast (USD Billion), by Others, 2016-2027
      Figure 94: Middle East & Africa Market Value Share (%), By Segment 3, 2019 & 2027
      Figure 95: Middle East & Africa Market Forecast (USD Billion), by Sub-Segment 1, 2016-2027
      Figure 96: Middle East & Africa Market Forecast (USD Billion), by Sub-Segment 2, 2016-2027
      Figure 97: Middle East & Africa Market Forecast (USD Billion), by Sub-Segment 3, 2016-2027
      Figure 98: Middle East & Africa Market Forecast (USD Billion), by Others, 2016-2027
      Figure 99: Middle East & Africa Market Forecast (USD Billion), by GCC, 2016-2027
      Figure 100: Middle East & Africa Market Forecast (USD Billion), by South Africa, 2016-2027
      Figure 101: Middle East & Africa Market Forecast (USD Billion), by Rest of Middle East & Africa, 2016-2027 
      List of Tables
      Table 1: Global Structured Cabling Market Revenue (USD Billion) Forecast, by Segment 1, 2016-2027
      Table 2: Global Market Revenue (USD Billion) Forecast, by Segment 2, 2016-2027
      Table 3: Global Market Revenue (USD Billion) Forecast, by Segment 3, 2016-2027
      Table 4: Global Market Revenue (USD Billion) Forecast, by Region, 2016-2027
      Table 5: North America Structured Cabling Market Revenue (USD Billion) Forecast, by Segment 1, 2016-2027
      Table 6: North America Market Revenue (USD Billion) Forecast, by Segment 2, 2016-2027
      Table 7: North America Market Revenue (USD Billion) Forecast, by Segment 3, 2016-2027
      Table 8: North America Market Revenue (USD Billion) Forecast, by Country, 2016-2027
      Table 9: Europe Structured Cabling Market Revenue (USD Billion) Forecast, by Segment 1, 2016-2027
      Table 10: Europe Market Revenue (USD Billion) Forecast, by Segment 2, 2016-2027
      Table 11: Europe Market Revenue (USD Billion) Forecast, by Segment 3, 2016-2027
      Table 12: Europe Market Revenue (USD Billion) Forecast, by Country, 2016-2027
      Table 13: Latin America Structured Cabling Market Revenue (USD Billion) Forecast, by Segment 1, 2016-2027
      Table 14: Latin America Market Revenue (USD Billion) Forecast, by Segment 2, 2016-2027
      Table 15: Latin America Market Revenue (USD Billion) Forecast, by Segment 3, 2016-2027
      Table 16: Latin America Market Revenue (USD Billion) Forecast, by Country, 2016-2027
      Table 17: Asia Pacific Structured Cabling Market Revenue (USD Billion) Forecast, by Segment 1, 2016-2027
      Table 18: Asia Pacific Market Revenue (USD Billion) Forecast, by Segment 2, 2016-2027
      Table 19: Asia Pacific Market Revenue (USD Billion) Forecast, by Segment 3, 2016-2027
      Table 20: Asia Pacific Market Revenue (USD Billion) Forecast, by Country, 2016-2027
      Table 21: Middle East & Africa Structured Cabling Market Revenue (USD Billion) Forecast, by Segment 1, 2016-2027
      Table 22: Middle East & Africa Market Revenue (USD Billion) Forecast, by Segment 2, 2016-2027
      Table 23: Middle East & Africa Market Revenue (USD Billion) Forecast, by Segment 3, 2016-2027
      Table 24: Middle East & Africa Market Revenue (USD Billion) Forecast, by Country, 2016-2027
      Research Process

      Data Library Research are conducted by industry experts who offer insight on industry structure, market segmentations technology assessment and competitive landscape (CL), and penetration, as well as on emerging trends. Their analysis is based on primary interviews (~ 80%) and secondary research (~ 20%) as well as years of professional expertise in their respective industries. Adding to this, by analysing historical trends and current market positions, our analysts predict where the market will be headed for the next five years. Furthermore, the varying trends of segment & categories geographically presented are also studied and the estimated based on the primary & secondary research.

      In this particular report from the supply side Data Library Research has conducted primary surveys (interviews) with the key level executives (VP, CEO’s, Marketing Director, Business Development Manager and SOFT) of the companies that active & prominent as well as the midsized organization

      FIGURE 1: DLR RESEARH PROCESS

      research-methodology1

      Primary Research

      Extensive primary research was conducted to gain a deeper insight of the market and industry performance. The analysis is based on both primary and secondary research as well as years of professional expertise in the respective industries.

      In addition to analysing current and historical trends, our analysts predict where the market is headed over the next five years.

      It varies by segment for these categories geographically presented in the list of market tables. Speaking about this particular report we have conducted primary surveys (interviews) with the key level executives (VP, CEO’s, Marketing Director, Business Development Manager and many more) of the major players active in the market.

      Secondary Research

      Secondary research was mainly used to collect and identify information useful for the extensive, technical, market-oriented, and Friend’s study of the Global Extra Neutral Alcohol. It was also used to obtain key information about major players, market classification and segmentation according to the industry trends, geographical markets, and developments related to the market and technology perspectives. For this study, analysts have gathered information from various credible sources, such as annual reports, sec filings, journals, white papers, SOFT presentations, and company web sites.

      Market Size Estimation

      Both, top-down and bottom-up approaches were used to estimate and validate the size of the Global market and to estimate the size of various other dependent submarkets in the overall Extra Neutral Alcohol. The key players in the market were identified through secondary research and their market contributions in the respective geographies were determined through primary and secondary research.

      Forecast Model

      research-methodology2