Chlorine Dioxide Market Overview and Analysis:

The global chlorine dioxide market is expected to reach USD 1.18 billion in 2025 and grow further to about USD 1.83 billion by 2032, with a CAGR of 6.5%.

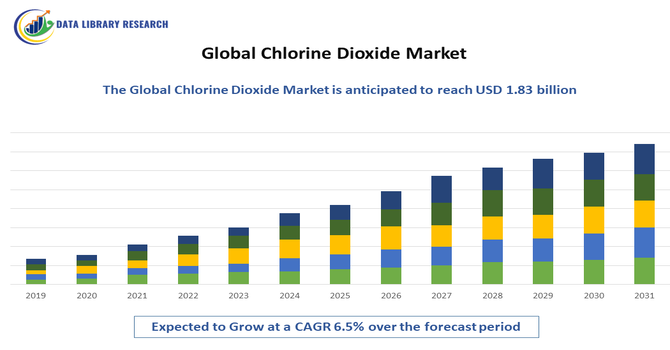
Chlorine dioxide is a powerful disinfectant widely used in water treatment, healthcare, and food processing. Unlike chlorine, it does not form harmful by-products, making it safer and more environmentally friendly. It works by penetrating microbial cell walls and disrupting vital processes, effectively killing bacteria, viruses, and fungi. Its ability to provide rapid, broad-spectrum disinfection at low concentrations makes it a preferred choice in industries where hygiene and safety are critical. Rising regulatory acceptance, updated healthcare standards, and the growing demand for efficient, cost-effective, and scalable disinfection technologies are driving wider adoption of chlorine dioxide across global markets.

Chlorine Dioxide Market Latest Trends:

The chlorine dioxide market is witnessing significant trends driven by technological innovation and evolving end-user demands. A major shift is towards on-site generation systems, which enhance safety by minimizing the storage and transport of the unstable chemical. Sustainability is a key driver, with industries favoring chlorine dioxide over chlorine for its superior disinfection efficacy and reduced formation of harmful by-products. The market is also expanding beyond traditional water treatment into new applications like oil & gas, HVAC system disinfection, and even air purification. Geographically, growth is robust in Asia-Pacific due to rapid industrialization and stricter water safety regulations, while North America and Europe continue to lead in technological adoption and regulatory compliance.

Segmentation:

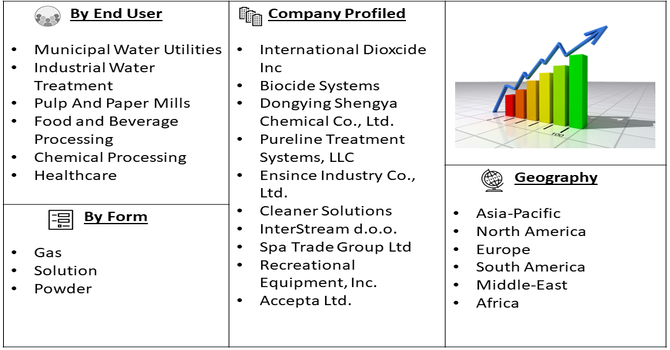
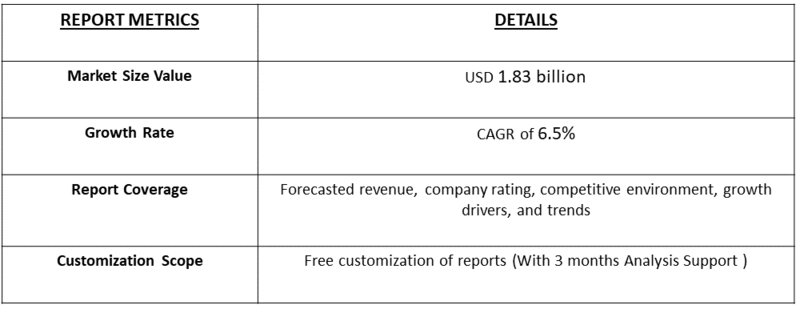
The Chlorine dioxide market segmentation spans by Form (Gas, Solution, and Powder), End-User Industry (Municipal Water Utilities, Industrial Water Treatment, Pulp And Paper Mills, Food and Beverage Processing, Chemical Processing, and Healthcare), and Geography (North America, Europe, Asia-Pacific, Middle East and Africa, and South America). The report provides the value (in USD million) for the above segments.

Market Drivers:

  • Increasing Demand for Advanced Water and Wastewater Treatment

The key growth driver for the chlorine dioxide market is the rising global demand for advanced water and wastewater treatment solutions. Rapid population growth and industrial expansion continue to strain freshwater resources, creating a critical need for effective disinfection technologies. Chlorine dioxide offers broad-spectrum efficacy against bacteria, viruses, and resilient protozoa such as Cryptosporidium and Giardia, often outperforming conventional disinfectants like chlorine. Stricter environmental regulations are also pushing municipalities and industries to adopt safer, more reliable methods that minimize harmful disinfection by-products (DBPs).  

In healthcare, adoption is accelerating as well, for instance, in June 2024, when Boulder iQ expanded its chlorine dioxide sterilization capabilities for medical devices, aligning with updated EPA regulations and surging demand for proven sterilization solutions. Thus, these factors are strengthening chlorine dioxide’s position as a preferred disinfection and sterilization technology, driving sustained market growth worldwide.

  • Expanding Applications in High-Growth Industrial Sectors

Another major driver for the chlorine dioxide market is its growing adoption beyond municipal water treatment, as demand expands into high-value industrial sectors. In the pulp and paper industry, its strong oxidizing and bleaching properties are essential for producing brighter, higher-quality paper. In food processing, chlorine dioxide is increasingly used for equipment sanitization and washing fruits and vegetables, thanks to its broad-spectrum efficacy and lack of toxic residues.

The pharmaceutical and healthcare industries also rely on it for disinfecting cleanrooms and medical devices. This diversification not only broadens the market’s reach but also reduces dependence on a single application. For instance, in January 2024, Scotmas Group signed an MoU with ACWA Power to advance “Green Desalination” technologies, highlighting chlorine dioxide’s role in sustainable growth. Thus, these developments position chlorine dioxide as a versatile, future-ready solution that will continue to drive strong demand across multiple industries worldwide.

Market Restraints:

  • Handling Hazards and Infrastructure Costs

A significant restraint for the Chlorine Dioxide market stems from the inherent hazards associated with its handling, storage, and generation. Chlorine dioxide is a highly reactive and unstable gas, posing risks of explosion if not handled properly. Its precursors also require careful management. This necessitates specialized equipment for on-site generation and trained personnel to operate it safely, leading to substantial initial capital investment and ongoing operational costs for end-users. The complex regulatory compliance surrounding its transport and use adds to these challenges. Thus, these smaller enterprises or those in regions with less developed infrastructure may find it difficult or uneconomical to adopt chlorine dioxide technologies, limiting its market penetration and growth potential, especially in comparison to simpler or less hazardous alternatives in certain applications.

Social Economic Impact On Chlorine Dioxide Market

The socio-economic impact on the chlorine dioxide market has been significant. Before COVID-19, demand was largely steady, driven by municipal water treatment and select industrial applications. Post-pandemic, heightened awareness of hygiene, stricter healthcare protocols, and rising demand for advanced disinfection technologies accelerated adoption across food, pharma, and medical sectors. Growing industrialization, urban water scarcity, and stricter environmental norms continue to expand opportunities, while collaborations in green desalination highlight its role in sustainability. Additionally, the use of augmented reality (AR) for remote monitoring and training is improving operational efficiency, further enhancing chlorine dioxide’s adoption in critical industries.

Segmental Analysis:

  • Powder segment is expected to witness highest growth over the forecast period

The powder segment of the Chlorine Dioxide market is anticipated to experience the highest growth over the forecast period. This surge is primarily attributed to the development and increasing adoption of stable, solid-form precursors for chlorine dioxide generation. These powder formulations offer significant advantages over liquid precursors, including enhanced safety, ease of handling, longer shelf life, and reduced transportation costs. As end-users, particularly in smaller-scale operations or remote locations, seek more convenient and less hazardous methods for generating chlorine dioxide on-site, the demand for these stable powder precursors is expected to climb. This trend is further supported by ongoing innovations in creating more efficient and user-friendly powder-based generation systems, making chlorine dioxide more accessible across a wider range of applications, thus driving its segment's rapid expansion.

  • Industrial Water Treatment end user segment is expected to witness highest growth over the forecast period

The Industrial Water Treatment end-user segment is poised for the highest growth in the Chlorine Dioxide market. This expansion is driven by the critical need for effective and reliable water management in diverse industrial processes. Industries such as power generation, oil and gas, chemical manufacturing, and food processing all rely heavily on treated water for cooling, steam generation, cleaning, and as a process medium. Chlorine dioxide's superior biocidal efficacy, especially against biofilms and resistant microorganisms, makes it an ideal choice for preventing fouling, corrosion, and microbial contamination in complex industrial water systems. The increasing stringency of environmental discharge regulations, coupled with the drive for operational efficiency and asset longevity in these industries, further bolsters the demand for advanced disinfection solutions like chlorine dioxide, positioning this segment for substantial growth.

  • North America region is expected to witness the highest growth over the forecast period

North America is projected to register the fastest growth in the chlorine dioxide market, driven by a combination of stringent environmental regulations, a mature industrial base, and rapid technological advancements. In the United States and Canada, strict water and wastewater quality standards are compelling municipalities and industries to adopt advanced disinfection methods, with chlorine dioxide offering superior performance compared to traditional solutions. Major industries such as pulp and paper, food and beverage, and oil and gas continue to drive demand for bleaching, sanitization, and microbial control applications.

The region also benefits from strong R&D capabilities and the presence of leading players developing safer and more efficient chlorine dioxide generation systems. Recent investments further underline this momentum, for instance, in December 2024, Chlorum Solutions USA announced a $70 million plant in Arizona to locally produce sodium hypochlorite, hydrochloric acid, and caustic soda without storing or transporting chlorine gas, reducing both risks and costs. Such localized, safer production models reflect the region’s broader push toward sustainability and cost-efficiency, reinforcing North America’s leadership in chlorine dioxide adoption and innovation.

Chlorine Dioxide Market Competitive Landscape:

The chlorine dioxide market has been witnessing steady advancements driven by innovation, regulatory recognition, and growing demand for safer, more efficient disinfection solutions. With products like De Nora Water Technologies’ Oxicore™, which set new benchmarks in scalability, cost efficiency, and yield for water treatment, companies are focusing on modular, high-performance technologies to strengthen their competitive edge. At the same time, regulatory bodies such as AAMI and ANSI acknowledging chlorine dioxide foam for medical device disinfection has expanded its relevance beyond traditional industrial and municipal use into the healthcare sector, intensifying competition. Global players are now positioning chlorine dioxide as a versatile, science-backed solution, and the landscape is expected to be shaped by technological differentiation, compliance with international standards, and market expansion.

Here are 10 major producers of Chlorine Dioxide:

  • International Dioxcide Inc
  • Biocide Systems
  • Dongying Shengya Chemical Co., Ltd.
  • Pureline Treatment Systems, LLC
  • Ensince Industry Co., Ltd.
  • Cleaner Solutions
  • InterStream d.o.o.
  • Spa Trade Group Ltd
  • Recreational Equipment, Inc.
  • Accepta Ltd.

Recent Developments:

  • In September, 2025, De Nora Water Technologies launched Oxicore, a next-generation chlorine dioxide generator under its Capital Controls brand, at the Global Water Expo in Saudi Arabia. The system delivered up to 99% ClO₂ yield with precise, on-demand dosing. Its modular skid design allowed plants to expand capacity simply by adding units, reducing installation costs and spare part requirements. By offering high efficiency and easy scalability, Oxicore™ marked a significant step forward in making chlorine dioxide treatment more reliable, cost-effective, and adaptable for diverse water facilities worldwide.
  • In February, 2025, the Association for the Advancement of Medical Instrumentation (AAMI), in collaboration with the American National Standards Institute (ANSI), updated its standards to recognize chlorine dioxide foam as an innovative method for high-level disinfection of medical devices. This U.S. update followed the 2024 guidelines from the World Federation for Ultrasound in Medicine and Biology, which had already endorsed chlorine dioxide for cleaning and disinfecting endocavitary ultrasound probes. The recognition positioned chlorine dioxide as a reliable and science-backed solution for safer and more effective infection control in healthcare settings.


Frequently Asked Questions (FAQ) :

Q1. What the main growth driving factors for this market?

The primary growth drivers for the Chlorine Dioxide market include its increasing use in water treatment for disinfection and purification, its application in the pulp and paper industry for bleaching, and its role in the food and beverage sector for sanitization. Growing environmental concerns and stricter regulations also fuel demand.

Q2. What are the main restraining factors for this market?

The high cost of chlorine dioxide production and the potential environmental and health concerns associated with its usage may hinder the market growth. Additionally, the availability of alternative disinfectants and treatment methods could limit the market's expansion.

Q3. Which segment is expected to witness high growth?

The water treatment segment dominates due to the escalating need for effective disinfection against pathogens and pollutants. The pulp and paper industry also sustains significant consumption owing to chlorine dioxide’s eco-friendly bleaching properties. Additionally, the food and beverage sector is projected for rapid growth, driven by demand for antimicrobial treatments of produce and poultry.

Q4. Who are the top major players for this market?

Key players include Ecolab, Grundfos, Evoqua Water Technologies, Prominent, and Vasu Chemicals. These companies lead through technological innovation, extensive distribution networks, and strong application expertise in disinfection and water treatment.

Q5. Which country is the largest player?

The United States is the largest market, driven by advanced water treatment infrastructure, high healthcare standards, and strict environmental regulations. Significant industrial and municipal demand solidifies its dominant position globally.

Chlorine Dioxide Market Study Global Market Analysis, Insights and Forecast, 2023-2030

    1. Introduction

    • 1.1. Research Scope
    • 1.2. Market Segmentation
    • 1.3. Research Methodology
    • 1.4. Definitions and Assumptions

    2. Executive Summary

      3. Market Dynamics

      • 3.1. Market Drivers
      • 3.2. Market Restraints
      • 3.3. Market Opportunities

      4. Key Insights

      • 4.1. Key Emerging Trends – For Major Countries
      • 4.2. Latest Technological Advancement
      • 4.3. Regulatory Landscape
      • 4.4. Industry SWOT Analysis
      • 4.5. Porters Five Forces Analysis

      5. Global Chlorine Dioxide Market Analysis (USD Billion), Insights and Forecast, 2023-2030

      • 5.1. Key Findings / Summary
      • 5.2. Market Analysis, Insights and Forecast – By Type
        • 5.2.1. Drinking Water
        • 5.2.2. Waste Water
        • 5.2.3. Swimming Water
        • 5.2.4. Cooling Water
      • 5.3. Market Analysis, Insights and Forecast – By Application
        • 5.3.1. Pulp and paper industry
        • 5.3.2. Industrial water treatment
        • 5.3.3. Food processing
        • 5.3.4. Others
      • 5.4. Market Analysis, Insights and Forecast – By Region
        • 5.4.1. North America
        • 5.4.2. Europe
        • 5.4.3. Asia Pacific
        • 5.4.4. Latin America, Middle East, and Africa

      6. North America Chlorine Dioxide Market Analysis (USD Billion), Insights and Forecast, 2023-2030

      • 6.1. Key Findings / Summary
      • 6.2. Market Analysis, Insights and Forecast – By Type
        • 6.2.1. Wet Industry
        • 6.2.2. Ion Implantation
        • 6.2.3. Biological Type
        • 6.2.4. Others
      • 6.3. Market Analysis, Insights and Forecast – By Application
        • 6.3.1. Pulp and paper industry
        • 6.3.2. Industrial water treatment
        • 6.3.3. Food processing
        • 6.3.4. Others
      • 6.4. Market Analysis, Insights and Forecast – By Country
        • 6.4.1. U.S.
        • 6.4.2. Canada

      7. Europe Chlorine Dioxide Market Analysis (USD Billion), Insights and Forecast, 2023-2030

      • 7.1. Key Findings / Summary
      • 7.2. Market Analysis, Insights and Forecast – By Type
        • 7.2.1. Drinking Water
        • 7.2.2. Waste Water
        • 7.2.3. Swimming Water
        • 7.2.4. Cooling Water
      • 7.3. Market Analysis, Insights and Forecast – By Application
        • 7.3.1. Pulp and paper industry
        • 7.3.2. Industrial water treatment
        • 7.3.3. Food processing
        • 7.3.4. Others
      • 7.4. Market Analysis, Insights and Forecast – By Country
        • 7.4.1. UK
        • 7.4.2. Germany
        • 7.4.3. France
        • 7.4.4. Italy
        • 7.4.5. Spain
        • 7.4.6. Russia
        • 7.4.7. Rest of Europe

      8. Asia Pacific Chlorine Dioxide Market Analysis (USD Billion), Insights and Forecast, 2023-2030

      • 8.1. Key Findings / Summary
      • 8.2. Market Analysis, Insights and Forecast – By Type
        • 8.2.1. Drinking Water
        • 8.2.2. Waste Water
        • 8.2.3. Swimming Water
        • 8.2.4. Cooling Water
      • 8.3. Market Analysis, Insights and Forecast – By Application
        • 8.3.1. Pulp and paper industry
        • 8.3.2. Industrial water treatment
        • 8.3.3. Food processing
        • 8.3.4. Others
      • 8.4. Market Analysis, Insights and Forecast – By Country
        • 8.4.1. China
        • 8.4.2. India
        • 8.4.3. Japan
        • 8.4.4. Australia
        • 8.4.5. South East Asia
        • 8.4.6. Rest of Asia Pacific

      9. Latin America, Middle East, and Africa Chlorine Dioxide Market Analysis (USD Billion), Insights and Forecast, 2023-2030

      • 9.1. Key Findings / Summary
      • 9.2. Market Analysis, Insights and Forecast – By Type
        • 9.2.1. Drinking Water
        • 9.2.2. Waste Water
        • 9.2.3. Swimming Water
        • 9.2.4. Cooling Water
      • 9.3. Market Analysis, Insights and Forecast – By Application
        • 9.3.1. Pulp and paper industry
        • 9.3.2. Industrial water treatment
        • 9.3.3. Food processing
        • 9.3.4. Others
      • 9.4. Market Analysis, Insights and Forecast – By Country
        • 9.4.1. Brazil
        • 9.4.2. Saudi Arabia
        • 9.4.3. UAE
        • 9.4.4. Rest of LAMEA

      10. Competitive Analysis

      • 10.1. Company Market Share Analysis, 2018
      • 10.2. Key Industry Developments
      • 10.3. Company Profile
      • 10.4. Accepta
        • 10.4.1. Business Overview
        • 10.4.2. Segment 1 & Service Offering
        • 10.4.3. Overall Revenue
        • 10.4.4. Geographic Presence
        • 10.4.5. Recent Development
      *Similar details will be provided for the following companies
      • 10.5. Grundfos
      • 10.6. Ecolab
      • 10.7. Evoqua
      • 10.8. ProMinent
      • 10.9. CDG Environmental LLC
      • 10.10. The Sabre Companies LLC
      • 10.11. Iotronic Elektrogerätebau GmbH
      • 10.12. Tecme Srl
      List of Figures

      Figure 1: Global Chlorine Dioxide Market Revenue Breakdown (USD Billion, %) by Region, 2023 & 2030
      Figure 2: Global Chlorine Dioxide Market Value Share (%), By Segment 1, 2023 & 2030
      Figure 3: Global Chlorine Dioxide Market Forecast (USD Billion), by Sub-Segment 1, 2018-2030
      Figure 4: Global Chlorine Dioxide Market Forecast (USD Billion), by Sub-Segment 2, 2018-2030
      Figure 5: Global Chlorine Dioxide Market Value Share (%), By Segment 2, 2023 & 2030
      Figure 6: Global Chlorine Dioxide Market Forecast (USD Billion), by Sub-Segment 1, 2018-2030
      Figure 7: Global Chlorine Dioxide Market Forecast (USD Billion), by Sub-Segment 2, 2018-2030
      Figure 8: Global Chlorine Dioxide Market Forecast (USD Billion), by Sub-Segment 3, 2018-2030
      Figure 9: Global Chlorine Dioxide Market Forecast (USD Billion), by Others, 2018-2030
      Figure 10: Global Chlorine Dioxide Market Value Share (%), By Segment 3, 2023 & 2030
      Figure 11: Global Chlorine Dioxide Market Forecast (USD Billion), by Sub-Segment 1, 2018-2030
      Figure 12: Global Chlorine Dioxide Market Forecast (USD Billion), by Sub-Segment 2, 2018-2030
      Figure 13: Global Chlorine Dioxide Market Forecast (USD Billion), by Sub-Segment 3, 2018-2030
      Figure 14: Global Chlorine Dioxide Market Forecast (USD Billion), by Others, 2018-2030
      Figure 15: Global Chlorine Dioxide Market Value (USD Billion), by Region, 2023 & 2030
      Figure 16: North America Chlorine Dioxide Market Value Share (%), By Segment 1, 2023 & 2030
      Figure 17: North America Chlorine Dioxide Market Forecast (USD Billion), by Sub-Segment 1, 2018-2030
      Figure 18: North America Chlorine Dioxide Market Forecast (USD Billion), by Sub-Segment 2, 2018-2030
      Figure 19: North America Chlorine Dioxide Market Value Share (%), By Segment 2, 2023 & 2030
      Figure 20: North America Chlorine Dioxide Market Forecast (USD Billion), by Sub-Segment 1, 2018-2030
      Figure 21: North America Chlorine Dioxide Market Forecast (USD Billion), by Sub-Segment 2, 2018-2030
      Figure 22: North America Chlorine Dioxide Market Forecast (USD Billion), by Sub-Segment 3, 2018-2030
      Figure 23: North America Chlorine Dioxide Market Forecast (USD Billion), by Others, 2018-2030
      Figure 24: North America Chlorine Dioxide Market Value Share (%), By Segment 3, 2023 & 2030
      Figure 25: North America Chlorine Dioxide Market Forecast (USD Billion), by Sub-Segment 1, 2018-2030
      Figure 26: North America Chlorine Dioxide Market Forecast (USD Billion), by Sub-Segment 2, 2018-2030
      Figure 27: North America Chlorine Dioxide Market Forecast (USD Billion), by Sub-Segment 3, 2018-2030
      Figure 28: North America Chlorine Dioxide Market Forecast (USD Billion), by Others, 2018-2030
      Figure 29: North America Chlorine Dioxide Market Forecast (USD Billion), by U.S., 2018-2030
      Figure 30: North America Chlorine Dioxide Market Forecast (USD Billion), by Canada, 2018-2030
      Figure 31: Latin America Chlorine Dioxide Market Value Share (%), By Segment 1, 2023 & 2030
      Figure 32: Latin America Chlorine Dioxide Market Forecast (USD Billion), by Sub-Segment 1, 2018-2030
      Figure 33: Latin America Chlorine Dioxide Market Forecast (USD Billion), by Sub-Segment 2, 2018-2030
      Figure 34: Latin America Chlorine Dioxide Market Value Share (%), By Segment 2, 2023 & 2030
      Figure 35: Latin America Chlorine Dioxide Market Forecast (USD Billion), by Sub-Segment 1, 2018-2030
      Figure 36: Latin America Chlorine Dioxide Market Forecast (USD Billion), by Sub-Segment 2, 2018-2030
      Figure 37: Latin America Chlorine Dioxide Market Forecast (USD Billion), by Sub-Segment 3, 2018-2030
      Figure 38: Latin America Chlorine Dioxide Market Forecast (USD Billion), by Others, 2018-2030
      Figure 39: Latin America Chlorine Dioxide Market Value Share (%), By Segment 3, 2023 & 2030
      Figure 40: Latin America Chlorine Dioxide Market Forecast (USD Billion), by Sub-Segment 1, 2018-2030
      Figure 41: Latin America Chlorine Dioxide Market Forecast (USD Billion), by Sub-Segment 2, 2018-2030
      Figure 42: Latin America Chlorine Dioxide Market Forecast (USD Billion), by Sub-Segment 3, 2018-2030
      Figure 43: Latin America Chlorine Dioxide Market Forecast (USD Billion), by Others, 2018-2030
      Figure 44: Latin America Chlorine Dioxide Market Forecast (USD Billion), by Brazil, 2018-2030
      Figure 45: Latin America Chlorine Dioxide Market Forecast (USD Billion), by Mexico, 2018-2030
      Figure 46: Latin America Chlorine Dioxide Market Forecast (USD Billion), by Rest of Latin America, 2018-2030
      Figure 47: Europe Chlorine Dioxide Market Value Share (%), By Segment 1, 2023 & 2030
      Figure 48: Europe Chlorine Dioxide Market Forecast (USD Billion), by Sub-Segment 1, 2018-2030
      Figure 49: Europe Chlorine Dioxide Market Forecast (USD Billion), by Sub-Segment 2, 2018-2030
      Figure 50: Europe Chlorine Dioxide Market Value Share (%), By Segment 2, 2023 & 2030
      Figure 51: Europe Chlorine Dioxide Market Forecast (USD Billion), by Sub-Segment 1, 2018-2030
      Figure 52: Europe Chlorine Dioxide Market Forecast (USD Billion), by Sub-Segment 2, 2018-2030
      Figure 53: Europe Chlorine Dioxide Market Forecast (USD Billion), by Sub-Segment 3, 2018-2030
      Figure 54: Europe Chlorine Dioxide Market Forecast (USD Billion), by Others, 2018-2030
      Figure 55: Europe Chlorine Dioxide Market Value Share (%), By Segment 3, 2023 & 2030
      Figure 56: Europe Chlorine Dioxide Market Forecast (USD Billion), by Sub-Segment 1, 2018-2030
      Figure 57: Europe Chlorine Dioxide Market Forecast (USD Billion), by Sub-Segment 2, 2018-2030
      Figure 58: Europe Chlorine Dioxide Market Forecast (USD Billion), by Sub-Segment 3, 2018-2030
      Figure 59: Europe Chlorine Dioxide Market Forecast (USD Billion), by Others, 2018-2030
      Figure 60: Europe Chlorine Dioxide Market Forecast (USD Billion), by U.K., 2018-2030
      Figure 61: Europe Chlorine Dioxide Market Forecast (USD Billion), by Germany, 2018-2030
      Figure 62: Europe Chlorine Dioxide Market Forecast (USD Billion), by France, 2018-2030
      Figure 63: Europe Chlorine Dioxide Market Forecast (USD Billion), by Italy, 2018-2030
      Figure 64: Europe Chlorine Dioxide Market Forecast (USD Billion), by Spain, 2018-2030
      Figure 65: Europe Chlorine Dioxide Market Forecast (USD Billion), by Russia, 2018-2030
      Figure 66: Europe Chlorine Dioxide Market Forecast (USD Billion), by Rest of Europe, 2018-2030
      Figure 67: Asia Pacific Chlorine Dioxide Market Value Share (%), By Segment 1, 2023 & 2030
      Figure 68: Asia Pacific Chlorine Dioxide Market Forecast (USD Billion), by Sub-Segment 1, 2018-2030
      Figure 69: Asia Pacific Chlorine Dioxide Market Forecast (USD Billion), by Sub-Segment 2, 2018-2030
      Figure 70: Asia Pacific Chlorine Dioxide Market Value Share (%), By Segment 2, 2023 & 2030
      Figure 71: Asia Pacific Chlorine Dioxide Market Forecast (USD Billion), by Sub-Segment 1, 2018-2030
      Figure 72: Asia Pacific Chlorine Dioxide Market Forecast (USD Billion), by Sub-Segment 2, 2018-2030
      Figure 73: Asia Pacific Chlorine Dioxide Market Forecast (USD Billion), by Sub-Segment 3, 2018-2030
      Figure 74: Asia Pacific Chlorine Dioxide Market Forecast (USD Billion), by Others, 2018-2030
      Figure 75: Asia Pacific Chlorine Dioxide Market Value Share (%), By Segment 3, 2023 & 2030
      Figure 76: Asia Pacific Chlorine Dioxide Market Forecast (USD Billion), by Sub-Segment 1, 2018-2030
      Figure 77: Asia Pacific Chlorine Dioxide Market Forecast (USD Billion), by Sub-Segment 2, 2018-2030
      Figure 78: Asia Pacific Chlorine Dioxide Market Forecast (USD Billion), by Sub-Segment 3, 2018-2030
      Figure 79: Asia Pacific Chlorine Dioxide Market Forecast (USD Billion), by Others, 2018-2030
      Figure 80: Asia Pacific Chlorine Dioxide Market Forecast (USD Billion), by China, 2018-2030
      Figure 81: Asia Pacific Chlorine Dioxide Market Forecast (USD Billion), by India, 2018-2030
      Figure 82: Asia Pacific Chlorine Dioxide Market Forecast (USD Billion), by Japan, 2018-2030
      Figure 83: Asia Pacific Chlorine Dioxide Market Forecast (USD Billion), by Australia, 2018-2030
      Figure 84: Asia Pacific Chlorine Dioxide Market Forecast (USD Billion), by Southeast Asia, 2018-2030
      Figure 85: Asia Pacific Chlorine Dioxide Market Forecast (USD Billion), by Rest of Asia Pacific, 2018-2030
      Figure 86: Middle East & Africa Chlorine Dioxide Market Value Share (%), By Segment 1, 2023 & 2030
      Figure 87: Middle East & Africa Chlorine Dioxide Market Forecast (USD Billion), by Sub-Segment 1, 2018-2030
      Figure 88: Middle East & Africa Chlorine Dioxide Market Forecast (USD Billion), by Sub-Segment 2, 2018-2030
      Figure 89: Middle East & Africa Chlorine Dioxide Market Value Share (%), By Segment 2, 2023 & 2030
      Figure 90: Middle East & Africa Chlorine Dioxide Market Forecast (USD Billion), by Sub-Segment 1, 2018-2030
      Figure 91: Middle East & Africa Chlorine Dioxide Market Forecast (USD Billion), by Sub-Segment 2, 2018-2030
      Figure 92: Middle East & Africa Chlorine Dioxide Market Forecast (USD Billion), by Sub-Segment 3, 2018-2030
      Figure 93: Middle East & Africa Chlorine Dioxide Market Forecast (USD Billion), by Others, 2018-2030
      Figure 94: Middle East & Africa Chlorine Dioxide Market Value Share (%), By Segment 3, 2023 & 2030
      Figure 95: Middle East & Africa Chlorine Dioxide Market Forecast (USD Billion), by Sub-Segment 1, 2018-2030
      Figure 96: Middle East & Africa Chlorine Dioxide Market Forecast (USD Billion), by Sub-Segment 2, 2018-2030
      Figure 97: Middle East & Africa Chlorine Dioxide Market Forecast (USD Billion), by Sub-Segment 3, 2018-2030
      Figure 98: Middle East & Africa Chlorine Dioxide Market Forecast (USD Billion), by Others, 2018-2030
      Figure 99: Middle East & Africa Chlorine Dioxide Market Forecast (USD Billion), by GCC, 2018-2030
      Figure 100: Middle East & Africa Chlorine Dioxide Market Forecast (USD Billion), by South Africa, 2018-2030
      Figure 101: Middle East & Africa Chlorine Dioxide Market Forecast (USD Billion), by Rest of Middle East & Africa, 2018-2030 
      List of Tables
      Table 1: Global Chlorine Dioxide Market Revenue (USD Billion) Forecast, by Segment 1, 2018-2030
      Table 2: Global Chlorine Dioxide Market Revenue (USD Billion) Forecast, by Segment 2, 2018-2030
      Table 3: Global Chlorine Dioxide Market Revenue (USD Billion) Forecast, by Segment 3, 2018-2030
      Table 4: Global Chlorine Dioxide Market Revenue (USD Billion) Forecast, by Region, 2018-2030
      Table 5: North America Chlorine Dioxide Market Revenue (USD Billion) Forecast, by Segment 1, 2018-2030
      Table 6: North America Chlorine Dioxide Market Revenue (USD Billion) Forecast, by Segment 2, 2018-2030
      Table 7: North America Chlorine Dioxide Market Revenue (USD Billion) Forecast, by Segment 3, 2018-2030
      Table 8: North America Chlorine Dioxide Market Revenue (USD Billion) Forecast, by Country, 2018-2030
      Table 9: Europe Chlorine Dioxide Market Revenue (USD Billion) Forecast, by Segment 1, 2018-2030
      Table 10: Europe Chlorine Dioxide Market Revenue (USD Billion) Forecast, by Segment 2, 2018-2030
      Table 11: Europe Chlorine Dioxide Market Revenue (USD Billion) Forecast, by Segment 3, 2018-2030
      Table 12: Europe Chlorine Dioxide Market Revenue (USD Billion) Forecast, by Country, 2018-2030
      Table 13: Latin America Chlorine Dioxide Market Revenue (USD Billion) Forecast, by Segment 1, 2018-2030
      Table 14: Latin America Chlorine Dioxide Market Revenue (USD Billion) Forecast, by Segment 2, 2018-2030
      Table 15: Latin America Chlorine Dioxide Market Revenue (USD Billion) Forecast, by Segment 3, 2018-2030
      Table 16: Latin America Chlorine Dioxide Market Revenue (USD Billion) Forecast, by Country, 2018-2030
      Table 17: Asia Pacific Chlorine Dioxide Market Revenue (USD Billion) Forecast, by Segment 1, 2018-2030
      Table 18: Asia Pacific Chlorine Dioxide Market Revenue (USD Billion) Forecast, by Segment 2, 2018-2030
      Table 19: Asia Pacific Chlorine Dioxide Market Revenue (USD Billion) Forecast, by Segment 3, 2018-2030
      Table 20: Asia Pacific Chlorine Dioxide Market Revenue (USD Billion) Forecast, by Country, 2018-2030
      Table 21: Middle East & Africa Chlorine Dioxide Market Revenue (USD Billion) Forecast, by Segment 1, 2018-2030
      Table 22: Middle East & Africa Chlorine Dioxide Market Revenue (USD Billion) Forecast, by Segment 2, 2018-2030
      Table 23: Middle East & Africa Chlorine Dioxide Market Revenue (USD Billion) Forecast, by Segment 3, 2018-2030
      Table 24: Middle East & Africa Chlorine Dioxide Market Revenue (USD Billion) Forecast, by Country, 2018-2030
      Research Process

      Data Library Research are conducted by industry experts who offer insight on industry structure, market segmentations technology assessment and competitive landscape (CL), and penetration, as well as on emerging trends. Their analysis is based on primary interviews (~ 80%) and secondary research (~ 20%) as well as years of professional expertise in their respective industries. Adding to this, by analysing historical trends and current market positions, our analysts predict where the market will be headed for the next five years. Furthermore, the varying trends of segment & categories geographically presented are also studied and the estimated based on the primary & secondary research.

      In this particular report from the supply side Data Library Research has conducted primary surveys (interviews) with the key level executives (VP, CEO’s, Marketing Director, Business Development Manager and SOFT) of the companies that active & prominent as well as the midsized organization

      FIGURE 1: DLR RESEARH PROCESS

      research-methodology1

      Primary Research

      Extensive primary research was conducted to gain a deeper insight of the market and industry performance. The analysis is based on both primary and secondary research as well as years of professional expertise in the respective industries.

      In addition to analysing current and historical trends, our analysts predict where the market is headed over the next five years.

      It varies by segment for these categories geographically presented in the list of market tables. Speaking about this particular report we have conducted primary surveys (interviews) with the key level executives (VP, CEO’s, Marketing Director, Business Development Manager and many more) of the major players active in the market.

      Secondary Research

      Secondary research was mainly used to collect and identify information useful for the extensive, technical, market-oriented, and Friend’s study of the Global Extra Neutral Alcohol. It was also used to obtain key information about major players, market classification and segmentation according to the industry trends, geographical markets, and developments related to the market and technology perspectives. For this study, analysts have gathered information from various credible sources, such as annual reports, sec filings, journals, white papers, SOFT presentations, and company web sites.

      Market Size Estimation

      Both, top-down and bottom-up approaches were used to estimate and validate the size of the Global market and to estimate the size of various other dependent submarkets in the overall Extra Neutral Alcohol. The key players in the market were identified through secondary research and their market contributions in the respective geographies were determined through primary and secondary research.

      Forecast Model

      research-methodology2

      Happy to Assist You

      If you have a question?

      info@datalibraryresearch.com

      IND : +91 955 279 0357

      Browse Related Reports