Cross-linked Polyethylene Market Overview
The global Cross-Linked Polyethylene Market was valued at $5,323.50 million in 2021 and is predicted to grow at a 7.80% CAGR during 2023-2030.
The global Cross-linked Polyethylene market is expected to rise at a significant rate in the estimated period. Pipe, tubing, wire, and cable are all common forms of cross-linked polyethylene. Cross-linking HDPE is used to make pipes and tubing while cross-linking LDPE is used to make wires and cables. Plumbing is a common use for cross-linked polyethylene. The polymer is rapidly replacing copper pipes and tubes because it is more flexible, less expensive, corrosion-resistant, and has a wider temperature range.
Mining is another key application of the polymer. The cost and time required for the installation, repair, and maintenance of pipes in mines are significantly decreased due to the ease with which cross-linked polyethylene piping may be mounted. Copper wires are protected with electrical tubing composed of cross-linked polyethylene, which is resistant to heat, weather, and moisture while also being insulated.
Because of its great strength and heat and chemical resistance, cross-linked polyethylene is also used in chemical storage tanks. Its application in wear-resistant joints is also being researched right now. Dental materials, automobile ducts and housings, kayaks, and canoes are among the polymer's other uses. All these aforementioned factors are majorly contributing to the growth of the global Cross-linked Polyethylene Market.
| Report Metric |
Details |
| Market size available for years |
2023–2030 |
| Base year considered |
2023 |
| Forecast period |
2024–2030 |
| Forecast unit |
Value (USD Million) |
| Segments covered |
Type, Application, and Region. |
| Regions covered |
North America (the U.S. and Canada), Europe (UK, Germany, France, Italy, Spain, Russia, Rest of Europe), Asia-Pacific (China, India, Japan, Australia, South East Asia, Rest of Asia Pacific), Latin America and the Middle East and Africa (Brazil, Saudi Arabia, UAE, Rest of LAMEA) |
| Companies covered |
ExxonMobil Chemical Company, Inc., LyondellBasell Industries, 3H Vinacom Co., Ltd, Hanwha Chemicals, Arkema Group, AkzoNobel N.V., Falcone Specialities AG, Borealis AG, PolyOne Corporation. |
Covid-19 Impact on Cross-linked Polyethylene Market
The ongoing COVID-19 pandemic conditions have severely affected every sector around the world. Whereas, the chemicals and materials sectors were moderately affected during the pandemic. This is primarily due to the uncut demand for chemicals for healthcare, life science, and cleaning agents. However, other elements of chemical and material sectors such as paints, industrial oil, construction materials are facing diminution in demand. Strict lockdown resulted in a nearly 50-60% reduction in supply for raw materials, which directly affected the manufacturing process. Further, halt on many end-use industries directly affected the chemical demand all around the world.
Cross-linked Polyethylene Market Segment Overview
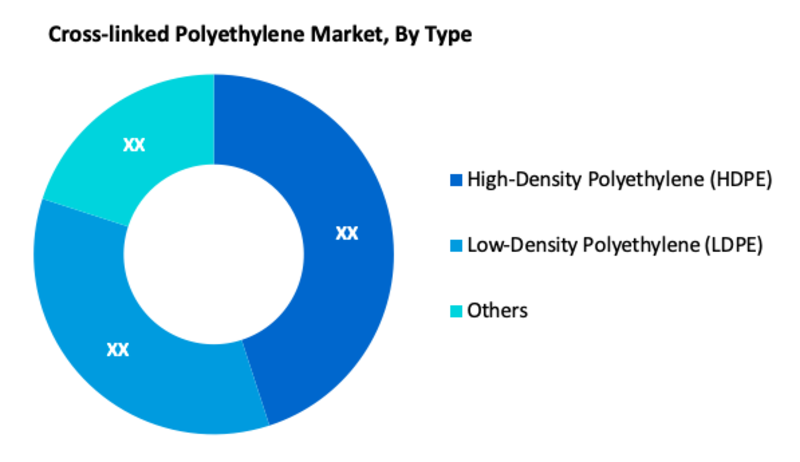
According to Type, High-Density Polyethylene (HDPE) is expected to hold the largest share of the global Cross-linked Polyethylene market. This is because it is increasingly used in pipes and tubes. HDPE is a versatile material that may be used in a variety of applications due to its unique blend of physical qualities. It is also simple to install, does not corrode, and has high flexural strength. Furthermore, Low-Density Polyethylene (LDPE) is another main segment in the global market. In plastic packagings, such as shopping bags and plastic wrap, LDPE is preferred. It can also be found in wires and cables.
Cross-linked Polyethylene Market, By Type
· High-Density Polyethylene (HDPE)
· Low-Density Polyethylene (LDPE)
· Others
Cross-linked Polyethylene Market, By Application
· Wires & Cables
· Plumbing
· Medical
· Chemical
· Automotive
· Others
Cross-linked Polyethylene Market Regional Overview
Geographically, North America holds the largest share of the global Cross-linked Polyethylene market. North America is a major user of cross-linked polyethylene, which is being used to replace other materials in plumbing applications in both residential and commercial buildings. The polymer is in high demand because of the region's well-developed sewerage and water transmission systems. Moreover, another key region for the cross-linked polymer market is in the Asia Pacific. China and India are quickly updating their public infrastructure, including water and sewerage systems. As a result, demand for cross-linked polyethylene is expected to rise in this region. The mining and chemical manufacturing industries are likely to increase their demand for cross-linked polythene.
Cross-linked Polyethylene Market, By Geography
· North America (US & Canada)
· Europe (UK, Germany, France, Italy, Spain, Russia & Rest of Europe)
· Asia-Pacific (Japan, China, India, Australia, & South Korea, & Rest of Asia-Pacific)
· LAMEA (Brazil, Saudi Arabia, UAE & Rest of LAMEA)
Cross-linked Polyethylene Market, Key Players
· ExxonMobil Chemical Company, Inc.
· LyondellBasell Industries
· 3H Vinacom Co., Ltd
· Hanwha Chemicals
· Arkema Group
· AkzoNobel N.V.
· Falcone Specialities AG
· Borealis AG
· PolyOne Corporation
Frequently Asked Questions (FAQ) :
Q1. What are the driving factors for the global Cross-linked Polyethylene market?
Because of its great strength and heat and chemical resistance, cross-linked polyethylene is used in chemical storage tanks, is one of the great factors that assist in the development of the Cross-linked Polyethylene Market
Q2. Which Segments are covered in the global Cross-linked Polyethylene market report?
Type, Application, and Region these segments are covered in the global Cross-linked Polyethylene market report.
Q3. Which segment is projected to hold the largest share in the global Cross-linked Polyethylene market?
High-Density Polyethylene (HDPE) segment is projected to hold the largest share in the global Cross-linked Polyethylene market
Q4. Which region holds the largest share in the global Cross-linked Polyethylene market?
North America holds the largest share in the global Cross-linked Polyethylene market
Q5. Which are the prominent players in the global Cross-linked Polyethylene market?
ExxonMobil Chemical Company, Inc., LyondellBasell Industries, 3H Vinacom Co., Ltd, Hanwha Chemicals, Arkema Group, AkzoNobel N.V., Falcone Specialities AG, Borealis AG, PolyOne Corporation. are some key players in the global Cross-linked Polyethylene market
List of Figures
Figure 1: Global Cross Linked Polyethylene Market Revenue Breakdown (USD Billion, %) by Region, 2023 & 2030
Figure 2: Global Market Value Share (%), By Segment 1, 2023 & 2030
Figure 3: Global Market Forecast (USD Billion), by Sub-Segment 1, 2021-2030
Figure 4: Global Market Forecast (USD Billion), by Sub-Segment 2, 2021-2030
Figure 5: Global Market Value Share (%), By Segment 2, 2023 & 2030
Figure 6: Global Market Forecast (USD Billion), by Sub-Segment 1, 2021-2030
Figure 7: Global Market Forecast (USD Billion), by Sub-Segment 2, 2021-2030
Figure 8: Global Market Forecast (USD Billion), by Sub-Segment 3, 2021-2030
Figure 9: Global Cross Linked Polyethylene Market Forecast (USD Billion), by Others, 2021-2030
Figure 10: Global Market Value Share (%), By Segment 3, 2023 & 2030
Figure 11: Global Market Forecast (USD Billion), by Sub-Segment 1, 2021-2030
Figure 12: Global Market Forecast (USD Billion), by Sub-Segment 2, 2021-2030
Figure 13: Global Market Forecast (USD Billion), by Sub-Segment 3, 2021-2030
Figure 14: Global Market Forecast (USD Billion), by Others, 2021-2030
Figure 15: Global Market Value (USD Billion), by Region, 2023 & 2030
Figure 16: North America Cross Linked Polyethylene Market Value Share (%), By Segment 1, 2023 & 2030
Figure 17: North America Market Forecast (USD Billion), by Sub-Segment 1, 2021-2030
Figure 18: North America Market Forecast (USD Billion), by Sub-Segment 2, 2021-2030
Figure 19: North America Market Value Share (%), By Segment 2, 2023 & 2030
Figure 20: North America Market Forecast (USD Billion), by Sub-Segment 1, 2021-2030
Figure 21: North America Market Forecast (USD Billion), by Sub-Segment 2, 2021-2030
Figure 22: North America Market Forecast (USD Billion), by Sub-Segment 3, 2021-2030
Figure 23: North America Market Forecast (USD Billion), by Others, 2021-2030
Figure 24: North America Market Value Share (%), By Segment 3, 2023 & 2030
Figure 25: North America Market Forecast (USD Billion), by Sub-Segment 1, 2021-2030
Figure 26: North America Market Forecast (USD Billion), by Sub-Segment 2, 2021-2030
Figure 27: North America Market Forecast (USD Billion), by Sub-Segment 3, 2021-2030
Figure 28: North America Market Forecast (USD Billion), by Others, 2021-2030
Figure 29: North America Market Forecast (USD Billion), by U.S., 2021-2030
Figure 30: North America Market Forecast (USD Billion), by Canada, 2021-2030
Figure 31: Latin America Cross Linked Polyethylene Market Value Share (%), By Segment 1, 2023 & 2030
Figure 32: Latin America Market Forecast (USD Billion), by Sub-Segment 1, 2021-2030
Figure 33: Latin America Market Forecast (USD Billion), by Sub-Segment 2, 2021-2030
Figure 34: Latin America Market Value Share (%), By Segment 2, 2023 & 2030
Figure 35: Latin America Market Forecast (USD Billion), by Sub-Segment 1, 2021-2030
Figure 36: Latin America Market Forecast (USD Billion), by Sub-Segment 2, 2021-2030
Figure 37: Latin America Market Forecast (USD Billion), by Sub-Segment 3, 2021-2030
Figure 38: Latin America Market Forecast (USD Billion), by Others, 2021-2030
Figure 39: Latin America Market Value Share (%), By Segment 3, 2023 & 2030
Figure 40: Latin America Market Forecast (USD Billion), by Sub-Segment 1, 2021-2030
Figure 41: Latin America Market Forecast (USD Billion), by Sub-Segment 2, 2021-2030
Figure 42: Latin America Market Forecast (USD Billion), by Sub-Segment 3, 2021-2030
Figure 43: Latin America Market Forecast (USD Billion), by Others, 2021-2030
Figure 44: Latin America Market Forecast (USD Billion), by Brazil, 2021-2030
Figure 45: Latin America Market Forecast (USD Billion), by Mexico, 2021-2030
Figure 46: Latin America Market Forecast (USD Billion), by Rest of Latin America, 2021-2030
Figure 47: Europe Cross Linked Polyethylene Market Value Share (%), By Segment 1, 2023 & 2030
Figure 48: Europe Market Forecast (USD Billion), by Sub-Segment 1, 2021-2030
Figure 49: Europe Market Forecast (USD Billion), by Sub-Segment 2, 2021-2030
Figure 50: Europe Market Value Share (%), By Segment 2, 2023 & 2030
Figure 51: Europe Market Forecast (USD Billion), by Sub-Segment 1, 2021-2030
Figure 52: Europe Market Forecast (USD Billion), by Sub-Segment 2, 2021-2030
Figure 53: Europe Market Forecast (USD Billion), by Sub-Segment 3, 2021-2030
Figure 54: Europe Market Forecast (USD Billion), by Others, 2021-2030
Figure 55: Europe Market Value Share (%), By Segment 3, 2023 & 2030
Figure 56: Europe Market Forecast (USD Billion), by Sub-Segment 1, 2021-2030
Figure 57: Europe Market Forecast (USD Billion), by Sub-Segment 2, 2021-2030
Figure 58: Europe Market Forecast (USD Billion), by Sub-Segment 3, 2021-2030
Figure 59: Europe Market Forecast (USD Billion), by Others, 2021-2030
Figure 60: Europe Market Forecast (USD Billion), by U.K., 2021-2030
Figure 61: Europe Market Forecast (USD Billion), by Germany, 2021-2030
Figure 62: Europe Market Forecast (USD Billion), by France, 2021-2030
Figure 63: Europe Market Forecast (USD Billion), by Italy, 2021-2030
Figure 64: Europe Market Forecast (USD Billion), by Spain, 2021-2030
Figure 65: Europe Market Forecast (USD Billion), by Russia, 2021-2030
Figure 66: Europe Market Forecast (USD Billion), by Rest of Europe, 2021-2030
Figure 67: Asia Pacific Cross Linked Polyethylene Market Value Share (%), By Segment 1, 2023 & 2030
Figure 68: Asia Pacific Market Forecast (USD Billion), by Sub-Segment 1, 2021-2030
Figure 69: Asia Pacific Market Forecast (USD Billion), by Sub-Segment 2, 2021-2030
Figure 70: Asia Pacific Market Value Share (%), By Segment 2, 2023 & 2030
Figure 71: Asia Pacific Market Forecast (USD Billion), by Sub-Segment 1, 2021-2030
Figure 72: Asia Pacific Market Forecast (USD Billion), by Sub-Segment 2, 2021-2030
Figure 73: Asia Pacific Market Forecast (USD Billion), by Sub-Segment 3, 2021-2030
Figure 74: Asia Pacific Market Forecast (USD Billion), by Others, 2021-2030
Figure 75: Asia Pacific Market Value Share (%), By Segment 3, 2023 & 2030
Figure 76: Asia Pacific Market Forecast (USD Billion), by Sub-Segment 1, 2021-2030
Figure 77: Asia Pacific Market Forecast (USD Billion), by Sub-Segment 2, 2021-2030
Figure 78: Asia Pacific Market Forecast (USD Billion), by Sub-Segment 3, 2021-2030
Figure 79: Asia Pacific Market Forecast (USD Billion), by Others, 2021-2030
Figure 80: Asia Pacific Market Forecast (USD Billion), by China, 2021-2030
Figure 81: Asia Pacific Market Forecast (USD Billion), by India, 2021-2030
Figure 82: Asia Pacific Market Forecast (USD Billion), by Japan, 2021-2030
Figure 83: Asia Pacific Market Forecast (USD Billion), by Australia, 2021-2030
Figure 84: Asia Pacific Market Forecast (USD Billion), by Southeast Asia, 2021-2030
Figure 85: Asia Pacific Market Forecast (USD Billion), by Rest of Asia Pacific, 2021-2030
Figure 86: Middle East & Africa Cross Linked Polyethylene Market Value Share (%), By Segment 1, 2023 & 2030
Figure 87: Middle East & Africa Market Forecast (USD Billion), by Sub-Segment 1, 2021-2030
Figure 88: Middle East & Africa Market Forecast (USD Billion), by Sub-Segment 2, 2021-2030
Figure 89: Middle East & Africa Market Value Share (%), By Segment 2, 2023 & 2030
Figure 90: Middle East & Africa Market Forecast (USD Billion), by Sub-Segment 1, 2021-2030
Figure 91: Middle East & Africa Market Forecast (USD Billion), by Sub-Segment 2, 2021-2030
Figure 92: Middle East & Africa Market Forecast (USD Billion), by Sub-Segment 3, 2021-2030
Figure 93: Middle East & Africa Market Forecast (USD Billion), by Others, 2021-2030
Figure 94: Middle East & Africa Market Value Share (%), By Segment 3, 2023 & 2030
Figure 95: Middle East & Africa Market Forecast (USD Billion), by Sub-Segment 1, 2021-2030
Figure 96: Middle East & Africa Market Forecast (USD Billion), by Sub-Segment 2, 2021-2030
Figure 97: Middle East & Africa Market Forecast (USD Billion), by Sub-Segment 3, 2021-2030
Figure 98: Middle East & Africa Market Forecast (USD Billion), by Others, 2021-2030
Figure 99: Middle East & Africa Market Forecast (USD Billion), by GCC, 2021-2030
Figure 100: Middle East & Africa Market Forecast (USD Billion), by South Africa, 2021-2030
Figure 101: Middle East & Africa Market Forecast (USD Billion), by Rest of Middle East & Africa, 2021-2030
List of Tables
Table 1: Global Cross Linked Polyethylene Market Revenue (USD Billion) Forecast, by Segment 1, 2021-2030
Table 2: Global Market Revenue (USD Billion) Forecast, by Segment 2, 2021-2030
Table 3: Global Market Revenue (USD Billion) Forecast, by Segment 3, 2021-2030
Table 4: Global Market Revenue (USD Billion) Forecast, by Region, 2021-2030
Table 5: North America Cross Linked Polyethylene Market Revenue (USD Billion) Forecast, by Segment 1, 2021-2030
Table 6: North America Market Revenue (USD Billion) Forecast, by Segment 2, 2021-2030
Table 7: North America Market Revenue (USD Billion) Forecast, by Segment 3, 2021-2030
Table 8: North America Market Revenue (USD Billion) Forecast, by Country, 2021-2030
Table 9: Europe Cross Linked Polyethylene Market Revenue (USD Billion) Forecast, by Segment 1, 2021-2030
Table 10: Europe Market Revenue (USD Billion) Forecast, by Segment 2, 2021-2030
Table 11: Europe Market Revenue (USD Billion) Forecast, by Segment 3, 2021-2030
Table 12: Europe Market Revenue (USD Billion) Forecast, by Country, 2021-2030
Table 13: Latin America Cross Linked Polyethylene Market Revenue (USD Billion) Forecast, by Segment 1, 2021-2030
Table 14: Latin America Market Revenue (USD Billion) Forecast, by Segment 2, 2021-2030
Table 15: Latin America Market Revenue (USD Billion) Forecast, by Segment 3, 2021-2030
Table 16: Latin America Market Revenue (USD Billion) Forecast, by Country, 2021-2030
Table 17: Asia Pacific Cross Linked Polyethylene Market Revenue (USD Billion) Forecast, by Segment 1, 2021-2030
Table 18: Asia Pacific Market Revenue (USD Billion) Forecast, by Segment 2, 2021-2030
Table 19: Asia Pacific Market Revenue (USD Billion) Forecast, by Segment 3, 2021-2030
Table 20: Asia Pacific Market Revenue (USD Billion) Forecast, by Country, 2021-2030
Table 21: Middle East & Africa Cross Linked Polyethylene Market Revenue (USD Billion) Forecast, by Segment 1, 2021-2030
Table 22: Middle East & Africa Market Revenue (USD Billion) Forecast, by Segment 2, 2021-2030
Table 23: Middle East & Africa Market Revenue (USD Billion) Forecast, by Segment 3, 2021-2030
Table 24: Middle East & Africa Market Revenue (USD Billion) Forecast, by Country, 2021-2030
Research Process
Data Library Research are conducted by industry experts who offer insight on
industry structure, market segmentations technology assessment and competitive landscape (CL), and penetration, as well as on emerging trends. Their analysis is based on primary interviews (~ 80%) and secondary research (~ 20%) as well as years of professional expertise in their respective industries. Adding to this, by analysing historical trends and current market positions, our analysts predict where the market will be headed for the next five years. Furthermore, the varying trends of segment & categories geographically presented are also studied and the estimated based on the primary & secondary research.
In this particular report from the supply side Data Library Research has conducted primary surveys (interviews) with the key level executives (VP, CEO’s, Marketing Director, Business Development Manager
and SOFT) of the companies that active & prominent as well as the midsized organization
FIGURE 1: DLR RESEARH PROCESS

Primary Research
Extensive primary research was conducted to gain a deeper insight of the market and industry performance. The analysis is based on both primary and secondary research as well as years of professional expertise in the respective industries.
In addition to analysing current and historical trends, our analysts predict where the market is headed over the next five years.
It varies by segment for these categories geographically presented in the list of market tables. Speaking about this particular report we have conducted primary surveys (interviews) with the key level executives (VP, CEO’s, Marketing Director, Business Development Manager and many more) of the major players active in the market.
Secondary Research
Secondary research was mainly used to collect and identify information useful for the extensive, technical, market-oriented, and Friend’s study of the Global Extra Neutral Alcohol. It was also used to obtain key information about major players, market classification and segmentation according to the industry trends, geographical markets, and developments related to the market and technology perspectives. For this study, analysts have gathered information from various credible sources, such as annual reports, sec filings, journals, white papers, SOFT presentations, and company web sites.
Market Size Estimation
Both, top-down and bottom-up approaches were used to estimate and validate the size of the Global market and to estimate the size of various other dependent submarkets in the overall Extra Neutral Alcohol. The key players in the market were identified through secondary research and their market contributions in the respective geographies were determined through primary and secondary research.
Forecast Model
