Global Glioblastoma Market Opportunities and Forecast 2022-2029

  •   DLR2113
  •   May, 2023
  •   Pages: 120
  •  Global
Market Overview

Glioblastoma is a type of brain cancer that is notoriously difficult to treat. In fact, the median survival rate for patients with glioblastoma is just over one year. Despite the grim prognosis, there is still hope for patients with glioblastoma. Thanks to advances in treatment and a better understanding of the disease, the survival rate for glioblastoma has doubled in the last decade. In addition, the global market for glioblastoma treatment is expected to grow significantly in the next few years.

The global Glioblastoma market is expected to reach $4.81 billion by 2029. This growth is primarily driven by the rising incidence of brain cancer, advancement in treatment modalities, and growing investment in research and development activities.

According to the World Health Organization (WHO), brain cancer is the second leading cause of cancer death in children under the age of 15 years and the fifth leading cause of cancer death in adults aged 65 years and above. Glioblastoma is the most common type of brain cancer, accounting for around 52% of all brain tumors. The American Brain Tumor Association (ABTA) estimates that there will be 23,820 new cases of primary brain tumors diagnosed in the United States in 2023.

Treatment options for glioblastoma include surgery, radiation therapy, chemotherapy, targeted therapy, and immunotherapy. The standard treatment regimen for glioblastoma includes surgery followed by radiation therapy with or without concurrent temozolomide chemotherapy. median overall survival (OS) for patients treated with this regimen is about 14 months. However, there are a number of clinical trials underway that are evaluating novel treatment approaches for glioblastoma, which hold the promise of improved efficacy and longer OS.

The rising incidence of brain cancer and the increasing number of clinical trials

Cancer is one of the leading causes of death worldwide, with brain cancer accounting for a significant proportion of cases. Glioblastoma is the most aggressive and deadly type of brain cancer, and its incidence is on the rise. According to the World Health Organization, the incidence of brain cancer has increased by nearly 50% over the past two decades.

The good news is that advances in medical research are leading to more effective treatments for this disease. Clinical trials are an important part of this process, as they allow scientists to test new therapies in humans. There are currently hundreds of clinical trials underway for glioblastoma, with many more expected in the coming years. This is good news for patients and their families, as it means that there are more treatment options available.

If you or someone you love has been diagnosed with glioblastoma, it is important to talk to your doctor about clinical trials that may be right for you. With so many options available, there is sure to be a trial that can offer hope for a better outcome


Report Includes


An overview of the global Glioblastoma market, and related technologies and developments. Analyses of global market trends, with historical data from 2018, 2023, and 2020 estimates and projections of CAGRs through 2029. It also includes breakdowns of the overall Glioblastoma market along with various segments, and by geographic region. Analysis of the stakeholder value chain in the Glioblastoma market and comprehensive profiles of leading companies in the industry

Report Metric Details
Market size available for years 2022–2029
Base year considered 2022
Forecast period 2022–2029
Forecast unit Value (USD Million)
Segments Covered Treatment, Drug Class, End User, and Region.
Regions covered North America (the U.S. and Canada), Europe (UK, Germany, France, Italy, Spain, Russia, Rest of Europe), Asia-Pacific (China, India, Japan, Australia, South East Asia, Rest of Asia Pacific), Latin America and the Middle East and Africa (Brazil, Saudi Arabia, UAE, Rest of LAMEA)
Companies covered Merck & Co., Inc., Amgen, Inc., F. Hoffmann-La Roche Ltd., Pfizer Inc., Amgen, Inc., Teva Pharmaceutical Industries Ltd., Sun Pharmaceutical Industries Ltd., Arbor Pharmaceuticals, LLC, Amneal Pharmaceuticals, Karyopharm Therapeutics, Inc., Sumitomo Dainippon Pharma Oncology, Inc. (Boston Biomedical, Inc.)

Report Scope


The report forecasts the size of the Glioblastoma market for components from 2022 through 2029
The Executive Summary provides a snapshot of key findings of the report. The introduction chapter includes research scope, market segmentation, research methodology, and definitions and assumptions. It involves extreme rigorous scientific methods, tools and techniques to estimate the market size. Exhaustive secondary research is being carried out to collect information related to the market, the parent market, and the peer market. Primary research is undertaken to validate the assumptions, findings, and sizing with the industry experts professionals across the value chain of the market. Both top-down and bottom-up approaches are employed to estimate the complete market size.

The chapter on market dynamics includes market drivers, restraints, and opportunities which helps familiarise with market potential and upcoming opportunities. The chapter on key insights includes emerging trends from major countries, latest technological advancement, regulatory landscape, SWOT analysis, and porters five forces analysis. This chapter provides detailed insights into the market, which derives the market trends, changing phase of investments, scope of profit potential, and helps to take appropriate business decisions. The chapter on competitive analysis includes profiling of leading companies in the global market to map the leading companies and their focus of interest in the market.

After deriving the market size from the market size estimation process, the total market has been split into several segments and sub-segments. To complete the overall market engineering process and arrive at the exact statistics for all segments and sub-segments, data triangulation and market breakdown procedures is being used. The data triangulation is carried out by studying various factors and trends from demand and supply perspectives.

Segmentation Analysis:

Glioblastoma Market Segment Overview


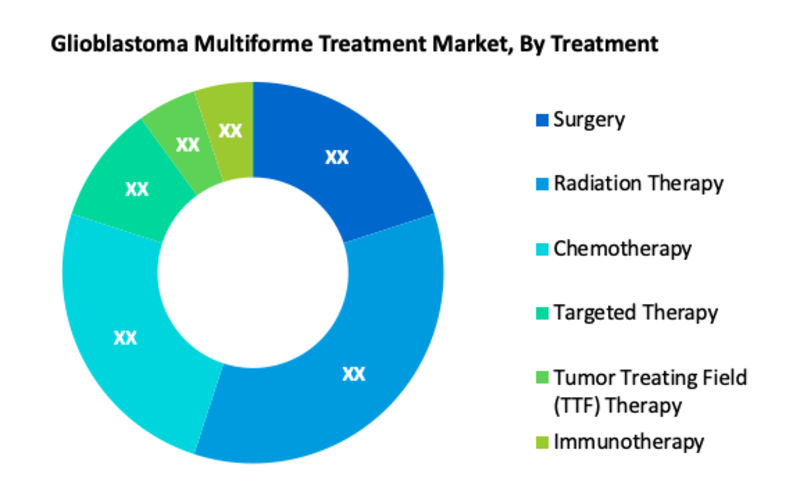
According to Treatment, the Radiation Therapy segment holds the largest share of the global Glioblastoma market. This is because survival rates have improved. Radiation therapy can be used as a stand-alone treatment or in combination with chemotherapy and surgery. In the event of a recurrence of a brain tumor, it is also beneficial and highly recommended. When temozolomide is used with radiotherapy, the tumor becomes more sensitive to radiation. This combination of treatments is more successful than radiotherapy alone. Furthermore, the most common treatment for GBM is surgery, which is followed by radiation therapy and chemotherapy.

Global Glioblastoma Market Competitive Analysis:
Key players in the Global Glioblastoma market are Merck & Co., Inc., Teva Pharmaceutical Industries, Ltd., Arbor Pharmaceuticals LLC., Sun Pharmaceutical Industries, Ltd., and F. Hoffmann-Le Roche AG among other players.

*All our reports are customizable as per customer requirements
This study forecasts revenue and volume growth at global, regional, and country levels from 2018 to 2029. Global Glioblastoma market is distributed on the basis of the below-mentioned segments:
 
Glioblastoma Market, By Treatment
 
·       Surgery
·       Radiation Therapy
·       Chemotherapy
·       Targeted Therapy
·       Tumor Treating Field (TTF) Therapy
·       Immunotherapy
 
Glioblastoma Market, By Drug Class
 
·       Temozolomide
·       Bevacizumab
·       Lomustine
·       Carmustine Wafers
·       Others
Glioblastoma Market, By End User
 
·       Hospitals
·       Clinics
·       Ambulatory Surgical Centers
 
Glioblastoma Market Regional Overview

Geographically, North America is the most prominent region for the Glioblastoma market. The region is anticipated to continue its domination in the coming years. This is due to the presence and rise of several pharmaceutical companies dedicated to the development of glioblastoma-curing drugs. Moreover, due to several factors such as the introduction of generic temozolomide, an improved economy, a growing senior population, and increased healthcare investment, Asia Pacific is predicted to grow at the quickest rate over the projection period.

Glioblastoma Market, By Geography

·       North America (US & Canada)
·       Europe (UK, Germany, France, Italy, Spain, Russia & Rest of Europe)
·       Asia-Pacific (Japan, China, India, Australia, & South Korea, & Rest of Asia-Pacific)
·       LAMEA (Brazil, Saudi Arabia, UAE & Rest of LAMEA)


Glioblastoma MARKET STUDY GLOBAL MARKET ANALYSIS, INSIGHTS AND FORECAST, 2020-2027

    1. Introduction

    • 1.1. Research Scope
    • 1.2. Market Segmentation
    • 1.3. Research Methodology
    • 1.4. Definitions and Assumptions

    2. Executive Summary

      3. Market Dynamics

      • 3.1. Market Drivers
      • 3.2. Market Restraints
      • 3.3. Market Opportunities

      4. Key Insights

      • 4.1. Key Emerging Trends – For Major Countries
      • 4.2. Latest Technological Advancement
      • 4.3. Regulatory Landscape
      • 4.4. Industry SWOT Analysis
      • 4.5. Porters Five Forces Analysis

      5. Global Glioblastoma Market Analysis (USD Billion), Insights and Forecast, 2016-2027

      • 5.1. Key Findings / Summary
      • 5.2. Market Analysis, Insights and Forecast – By Segment 1
        • 5.2.1. Sub-Segment 1
        • 5.2.2. Sub-Segment 2
      • 5.3. Market Analysis, Insights and Forecast – By Segment 2
        • 5.3.1. Sub-Segment 1
        • 5.3.2. Sub-Segment 2
        • 5.3.3. Sub-Segment 3
        • 5.3.4. Others
      • 5.4. Market Analysis, Insights and Forecast – By Segment 3
        • 5.4.1. Sub-Segment 1
        • 5.4.2. Sub-Segment 2
        • 5.4.3. Sub-Segment 3
        • 5.4.4. Others
      • 5.5. Market Analysis, Insights and Forecast – By Region
        • 5.5.1. North America
        • 5.5.2. Latin America
        • 5.5.3. Europe
        • 5.5.4. Asia Pacific
        • 5.5.5. Middle East and Africa

      6. North America Glioblastoma Market Analysis (USD Billion), Insights and Forecast, 2016-2027

      • 6.1. Key Findings / Summary
      • 6.2. Market Analysis, Insights and Forecast – By Segment 1
        • 6.2.1. Sub-Segment 1
        • 6.2.2. Sub-Segment 2
      • 6.3. Market Analysis, Insights and Forecast – By Segment 2
        • 6.3.1. Sub-Segment 1
        • 6.3.2. Sub-Segment 2
        • 6.3.3. Sub-Segment 3
        • 6.3.4. Others
      • 6.4. Market Analysis, Insights and Forecast – By Segment 3
        • 6.4.1. Sub-Segment 1
        • 6.4.2. Sub-Segment 2
        • 6.4.3. Sub-Segment 3
        • 6.4.4. Others
      • 6.5. Market Analysis, Insights and Forecast – By Country
        • 6.5.1. U.S.
        • 6.5.2. Canada

      7. Latin America Glioblastoma Market Analysis (USD Billion), Insights and Forecast, 2016-2027

      • 7.1. Key Findings / Summary
      • 7.2. Market Analysis, Insights and Forecast – By Segment 1
        • 7.2.1. Sub-Segment 1
        • 7.2.2. Sub-Segment 2
      • 7.3. Market Analysis, Insights and Forecast – By Segment 2
        • 7.3.1. Sub-Segment 1
        • 7.3.2. Sub-Segment 2
        • 7.3.3. Sub-Segment 3
        • 7.3.4. Others
      • 7.4. Market Analysis, Insights and Forecast – By Segment 3
        • 7.4.1. Sub-Segment 1
        • 7.4.2. Sub-Segment 2
        • 7.4.3. Sub-Segment 3
        • 7.4.4. Others
      • 7.5. Insights and Forecast – By Country
        • 7.5.1. Brazil
        • 7.5.2. Mexico
        • 7.5.3. Rest of Latin America

      8. Europe Glioblastoma Market Analysis (USD Billion), Insights and Forecast, 2016-2027

      • 8.1. Key Findings / Summary
      • 8.2. Market Analysis, Insights and Forecast – By Segment 1
        • 8.2.1. Sub-Segment 1
        • 8.2.2. Sub-Segment 2
      • 8.3. Market Analysis, Insights and Forecast – By Segment 2
        • 8.3.1. Sub-Segment 1
        • 8.3.2. Sub-Segment 2
        • 8.3.3. Sub-Segment 3
        • 8.3.4. Others
      • 8.4. Market Analysis, Insights and Forecast – By Segment 3
        • 8.4.1. Sub-Segment 1
        • 8.4.2. Sub-Segment 2
        • 8.4.3. Sub-Segment 3
        • 8.4.4. Others
      • 8.5. Market Analysis, Insights and Forecast – By Country
        • 8.5.1. UK
        • 8.5.2. Germany
        • 8.5.3. France
        • 8.5.4. Italy
        • 8.5.5. Spain
        • 8.5.6. Russia
        • 8.5.7. Rest of Europe

      9. Asia Pacific Glioblastoma Market Analysis (USD Billion), Insights and Forecast, 2016-2027

      • 9.1. Key Findings / Summary
      • 9.2. Market Analysis, Insights and Forecast – By Segment 1
        • 9.2.1. Sub-Segment 1
        • 9.2.2. Sub-Segment 2
      • 9.3. Market Analysis, Insights and Forecast – By Segment 2
        • 9.3.1. Sub-Segment 1
        • 9.3.2. Sub-Segment 2
        • 9.3.3. Sub-Segment 3
        • 9.3.4. Others
      • 9.4. Market Analysis, Insights and Forecast – By Segment 3
        • 9.4.1. Sub-Segment 1
        • 9.4.2. Sub-Segment 2
        • 9.4.3. Sub-Segment 3
        • 9.4.4. Others
      • 9.5. Market Analysis, Insights and Forecast – By Country
        • 9.5.1. China
        • 9.5.2. India
        • 9.5.3. Japan
        • 9.5.4. Australia
        • 9.5.5. South East Asia
        • 9.5.6. Rest of Asia Pacific

      10. Middle East & Africa Glioblastoma Market Analysis (USD Billion), Insights and Forecast, 2016-2027

      • 10.1. Key Findings / Summary
      • 10.2. Market Analysis, Insights and Forecast – By Segment 1
        • 10.2.1. Sub-Segment 1
        • 10.2.2. Sub-Segment 2
      • 10.3. Market Analysis, Insights and Forecast – By Segment 2
        • 10.3.1. Sub-Segment 1
        • 10.3.2. Sub-Segment 2
        • 10.3.3. Sub-Segment 3
        • 10.3.4. Others
      • 10.4. Market Analysis, Insights and Forecast – By Segment 3
        • 10.4.1. Sub-Segment 1
        • 10.4.2. Sub-Segment 2
        • 10.4.3. Sub-Segment 3
        • 10.4.4. Others
      • 10.5. Market Analysis, Insights and Forecast – By Country
        • 10.5.1. GCC
        • 10.5.2. South Africa
        • 10.5.3. Rest of Middle East & Africa

      11. Competitive Analysis

      • 11.1. Company Market Share Analysis, 2018
      • 11.2. Key Industry Developments
      • 11.3. Company Profile
        • 11.3.1. Company 1
          • 11.3.1.1. Business Overview
          • 11.3.1.2. Segment 1 & Service Offering
          • 11.3.1.3. Overall Revenue
          • 11.3.1.4. Geographic Presence
          • 11.3.1.5. Recent Development
        *Similar details will be provided for the following companies
        • 11.3.2. Company 2
        • 11.3.3. Company 3
        • 11.3.4. Company 4
        • 11.3.5. Company 5
        • 11.3.6. Company 6
        • 11.3.7. Company 7
        • 11.3.8. Company 8
        • 11.3.9. Company 9
        • 11.3.10. Company 10
        • 11.3.11. Company 11
        • 11.3.12. Company 12
      List of Figures

      Figure 1: Global Glioblastoma Market Revenue Breakdown (USD Billion, %) by Region, 2019 & 2027
      Figure 2: Global Glioblastoma Market Value Share (%), By Segment 1, 2019 & 2027
      Figure 3: Global Glioblastoma Market Forecast (USD Billion), by Sub-Segment 1, 2016-2027
      Figure 4: Global Glioblastoma Market Forecast (USD Billion), by Sub-Segment 2, 2016-2027
      Figure 5: Global Glioblastoma Market Value Share (%), By Segment 2, 2019 & 2027
      Figure 6: Global Glioblastoma Market Forecast (USD Billion), by Sub-Segment 1, 2016-2027
      Figure 7: Global Glioblastoma Market Forecast (USD Billion), by Sub-Segment 2, 2016-2027
      Figure 8: Global Glioblastoma Market Forecast (USD Billion), by Sub-Segment 3, 2016-2027
      Figure 9: Global Glioblastoma Market Forecast (USD Billion), by Others, 2016-2027
      Figure 10: Global Glioblastoma Market Value Share (%), By Segment 3, 2019 & 2027
      Figure 11: Global Glioblastoma Market Forecast (USD Billion), by Sub-Segment 1, 2016-2027
      Figure 12: Global Glioblastoma Market Forecast (USD Billion), by Sub-Segment 2, 2016-2027
      Figure 13: Global Glioblastoma Market Forecast (USD Billion), by Sub-Segment 3, 2016-2027
      Figure 14: Global Glioblastoma Market Forecast (USD Billion), by Others, 2016-2027
      Figure 15: Global Glioblastoma Market Value (USD Billion), by Region, 2019 & 2027
      Figure 16: North America Glioblastoma Market Value Share (%), By Segment 1, 2019 & 2027
      Figure 17: North America Glioblastoma Market Forecast (USD Billion), by Sub-Segment 1, 2016-2027
      Figure 18: North America Glioblastoma Market Forecast (USD Billion), by Sub-Segment 2, 2016-2027
      Figure 19: North America Glioblastoma Market Value Share (%), By Segment 2, 2019 & 2027
      Figure 20: North America Glioblastoma Market Forecast (USD Billion), by Sub-Segment 1, 2016-2027
      Figure 21: North America Glioblastoma Market Forecast (USD Billion), by Sub-Segment 2, 2016-2027
      Figure 22: North America Glioblastoma Market Forecast (USD Billion), by Sub-Segment 3, 2016-2027
      Figure 23: North America Glioblastoma Market Forecast (USD Billion), by Others, 2016-2027
      Figure 24: North America Glioblastoma Market Value Share (%), By Segment 3, 2019 & 2027
      Figure 25: North America Glioblastoma Market Forecast (USD Billion), by Sub-Segment 1, 2016-2027
      Figure 26: North America Glioblastoma Market Forecast (USD Billion), by Sub-Segment 2, 2016-2027
      Figure 27: North America Glioblastoma Market Forecast (USD Billion), by Sub-Segment 3, 2016-2027
      Figure 28: North America Glioblastoma Market Forecast (USD Billion), by Others, 2016-2027
      Figure 29: North America Glioblastoma Market Forecast (USD Billion), by U.S., 2016-2027
      Figure 30: North America Glioblastoma Market Forecast (USD Billion), by Canada, 2016-2027
      Figure 31: Latin America Glioblastoma Market Value Share (%), By Segment 1, 2019 & 2027
      Figure 32: Latin America Glioblastoma Market Forecast (USD Billion), by Sub-Segment 1, 2016-2027
      Figure 33: Latin America Glioblastoma Market Forecast (USD Billion), by Sub-Segment 2, 2016-2027
      Figure 34: Latin America Glioblastoma Market Value Share (%), By Segment 2, 2019 & 2027
      Figure 35: Latin America Glioblastoma Market Forecast (USD Billion), by Sub-Segment 1, 2016-2027
      Figure 36: Latin America Glioblastoma Market Forecast (USD Billion), by Sub-Segment 2, 2016-2027
      Figure 37: Latin America Glioblastoma Market Forecast (USD Billion), by Sub-Segment 3, 2016-2027
      Figure 38: Latin America Glioblastoma Market Forecast (USD Billion), by Others, 2016-2027
      Figure 39: Latin America Glioblastoma Market Value Share (%), By Segment 3, 2019 & 2027
      Figure 40: Latin America Glioblastoma Market Forecast (USD Billion), by Sub-Segment 1, 2016-2027
      Figure 41: Latin America Glioblastoma Market Forecast (USD Billion), by Sub-Segment 2, 2016-2027
      Figure 42: Latin America Glioblastoma Market Forecast (USD Billion), by Sub-Segment 3, 2016-2027
      Figure 43: Latin America Glioblastoma Market Forecast (USD Billion), by Others, 2016-2027
      Figure 44: Latin America Glioblastoma Market Forecast (USD Billion), by Brazil, 2016-2027
      Figure 45: Latin America Glioblastoma Market Forecast (USD Billion), by Mexico, 2016-2027
      Figure 46: Latin America Glioblastoma Market Forecast (USD Billion), by Rest of Latin America, 2016-2027
      Figure 47: Europe Glioblastoma Market Value Share (%), By Segment 1, 2019 & 2027
      Figure 48: Europe Glioblastoma Market Forecast (USD Billion), by Sub-Segment 1, 2016-2027
      Figure 49: Europe Glioblastoma Market Forecast (USD Billion), by Sub-Segment 2, 2016-2027
      Figure 50: Europe Glioblastoma Market Value Share (%), By Segment 2, 2019 & 2027
      Figure 51: Europe Glioblastoma Market Forecast (USD Billion), by Sub-Segment 1, 2016-2027
      Figure 52: Europe Glioblastoma Market Forecast (USD Billion), by Sub-Segment 2, 2016-2027
      Figure 53: Europe Glioblastoma Market Forecast (USD Billion), by Sub-Segment 3, 2016-2027
      Figure 54: Europe Glioblastoma Market Forecast (USD Billion), by Others, 2016-2027
      Figure 55: Europe Glioblastoma Market Value Share (%), By Segment 3, 2019 & 2027
      Figure 56: Europe Glioblastoma Market Forecast (USD Billion), by Sub-Segment 1, 2016-2027
      Figure 57: Europe Glioblastoma Market Forecast (USD Billion), by Sub-Segment 2, 2016-2027
      Figure 58: Europe Glioblastoma Market Forecast (USD Billion), by Sub-Segment 3, 2016-2027
      Figure 59: Europe Glioblastoma Market Forecast (USD Billion), by Others, 2016-2027
      Figure 60: Europe Glioblastoma Market Forecast (USD Billion), by U.K., 2016-2027
      Figure 61: Europe Glioblastoma Market Forecast (USD Billion), by Germany, 2016-2027
      Figure 62: Europe Glioblastoma Market Forecast (USD Billion), by France, 2016-2027
      Figure 63: Europe Glioblastoma Market Forecast (USD Billion), by Italy, 2016-2027
      Figure 64: Europe Glioblastoma Market Forecast (USD Billion), by Spain, 2016-2027
      Figure 65: Europe Glioblastoma Market Forecast (USD Billion), by Russia, 2016-2027
      Figure 66: Europe Glioblastoma Market Forecast (USD Billion), by Rest of Europe, 2016-2027
      Figure 67: Asia Pacific Glioblastoma Market Value Share (%), By Segment 1, 2019 & 2027
      Figure 68: Asia Pacific Glioblastoma Market Forecast (USD Billion), by Sub-Segment 1, 2016-2027
      Figure 69: Asia Pacific Glioblastoma Market Forecast (USD Billion), by Sub-Segment 2, 2016-2027
      Figure 70: Asia Pacific Glioblastoma Market Value Share (%), By Segment 2, 2019 & 2027
      Figure 71: Asia Pacific Glioblastoma Market Forecast (USD Billion), by Sub-Segment 1, 2016-2027
      Figure 72: Asia Pacific Glioblastoma Market Forecast (USD Billion), by Sub-Segment 2, 2016-2027
      Figure 73: Asia Pacific Glioblastoma Market Forecast (USD Billion), by Sub-Segment 3, 2016-2027
      Figure 74: Asia Pacific Glioblastoma Market Forecast (USD Billion), by Others, 2016-2027
      Figure 75: Asia Pacific Glioblastoma Market Value Share (%), By Segment 3, 2019 & 2027
      Figure 76: Asia Pacific Glioblastoma Market Forecast (USD Billion), by Sub-Segment 1, 2016-2027
      Figure 77: Asia Pacific Glioblastoma Market Forecast (USD Billion), by Sub-Segment 2, 2016-2027
      Figure 78: Asia Pacific Glioblastoma Market Forecast (USD Billion), by Sub-Segment 3, 2016-2027
      Figure 79: Asia Pacific Glioblastoma Market Forecast (USD Billion), by Others, 2016-2027
      Figure 80: Asia Pacific Glioblastoma Market Forecast (USD Billion), by China, 2016-2027
      Figure 81: Asia Pacific Glioblastoma Market Forecast (USD Billion), by India, 2016-2027
      Figure 82: Asia Pacific Glioblastoma Market Forecast (USD Billion), by Japan, 2016-2027
      Figure 83: Asia Pacific Glioblastoma Market Forecast (USD Billion), by Australia, 2016-2027
      Figure 84: Asia Pacific Glioblastoma Market Forecast (USD Billion), by Southeast Asia, 2016-2027
      Figure 85: Asia Pacific Glioblastoma Market Forecast (USD Billion), by Rest of Asia Pacific, 2016-2027
      Figure 86: Middle East & Africa Glioblastoma Market Value Share (%), By Segment 1, 2019 & 2027
      Figure 87: Middle East & Africa Glioblastoma Market Forecast (USD Billion), by Sub-Segment 1, 2016-2027
      Figure 88: Middle East & Africa Glioblastoma Market Forecast (USD Billion), by Sub-Segment 2, 2016-2027
      Figure 89: Middle East & Africa Glioblastoma Market Value Share (%), By Segment 2, 2019 & 2027
      Figure 90: Middle East & Africa Glioblastoma Market Forecast (USD Billion), by Sub-Segment 1, 2016-2027
      Figure 91: Middle East & Africa Glioblastoma Market Forecast (USD Billion), by Sub-Segment 2, 2016-2027
      Figure 92: Middle East & Africa Glioblastoma Market Forecast (USD Billion), by Sub-Segment 3, 2016-2027
      Figure 93: Middle East & Africa Glioblastoma Market Forecast (USD Billion), by Others, 2016-2027
      Figure 94: Middle East & Africa Glioblastoma Market Value Share (%), By Segment 3, 2019 & 2027
      Figure 95: Middle East & Africa Glioblastoma Market Forecast (USD Billion), by Sub-Segment 1, 2016-2027
      Figure 96: Middle East & Africa Glioblastoma Market Forecast (USD Billion), by Sub-Segment 2, 2016-2027
      Figure 97: Middle East & Africa Glioblastoma Market Forecast (USD Billion), by Sub-Segment 3, 2016-2027
      Figure 98: Middle East & Africa Glioblastoma Market Forecast (USD Billion), by Others, 2016-2027
      Figure 99: Middle East & Africa Glioblastoma Market Forecast (USD Billion), by GCC, 2016-2027
      Figure 100: Middle East & Africa Glioblastoma Market Forecast (USD Billion), by South Africa, 2016-2027
      Figure 101: Middle East & Africa Glioblastoma Market Forecast (USD Billion), by Rest of Middle East & Africa, 2016-2027 
      List of Tables
      Table 1: Global Glioblastoma Market Revenue (USD Billion) Forecast, by Segment 1, 2016-2027
      Table 2: Global Glioblastoma Market Revenue (USD Billion) Forecast, by Segment 2, 2016-2027
      Table 3: Global Glioblastoma Market Revenue (USD Billion) Forecast, by Segment 3, 2016-2027
      Table 4: Global Glioblastoma Market Revenue (USD Billion) Forecast, by Region, 2016-2027
      Table 5: North America Glioblastoma Market Revenue (USD Billion) Forecast, by Segment 1, 2016-2027
      Table 6: North America Glioblastoma Market Revenue (USD Billion) Forecast, by Segment 2, 2016-2027
      Table 7: North America Glioblastoma Market Revenue (USD Billion) Forecast, by Segment 3, 2016-2027
      Table 8: North America Glioblastoma Market Revenue (USD Billion) Forecast, by Country, 2016-2027
      Table 9: Europe Glioblastoma Market Revenue (USD Billion) Forecast, by Segment 1, 2016-2027
      Table 10: Europe Glioblastoma Market Revenue (USD Billion) Forecast, by Segment 2, 2016-2027
      Table 11: Europe Glioblastoma Market Revenue (USD Billion) Forecast, by Segment 3, 2016-2027
      Table 12: Europe Glioblastoma Market Revenue (USD Billion) Forecast, by Country, 2016-2027
      Table 13: Latin America Glioblastoma Market Revenue (USD Billion) Forecast, by Segment 1, 2016-2027
      Table 14: Latin America Glioblastoma Market Revenue (USD Billion) Forecast, by Segment 2, 2016-2027
      Table 15: Latin America Glioblastoma Market Revenue (USD Billion) Forecast, by Segment 3, 2016-2027
      Table 16: Latin America Glioblastoma Market Revenue (USD Billion) Forecast, by Country, 2016-2027
      Table 17: Asia Pacific Glioblastoma Market Revenue (USD Billion) Forecast, by Segment 1, 2016-2027
      Table 18: Asia Pacific Glioblastoma Market Revenue (USD Billion) Forecast, by Segment 2, 2016-2027
      Table 19: Asia Pacific Glioblastoma Market Revenue (USD Billion) Forecast, by Segment 3, 2016-2027
      Table 20: Asia Pacific Glioblastoma Market Revenue (USD Billion) Forecast, by Country, 2016-2027
      Table 21: Middle East & Africa Glioblastoma Market Revenue (USD Billion) Forecast, by Segment 1, 2016-2027
      Table 22: Middle East & Africa Glioblastoma Market Revenue (USD Billion) Forecast, by Segment 2, 2016-2027
      Table 23: Middle East & Africa Glioblastoma Market Revenue (USD Billion) Forecast, by Segment 3, 2016-2027
      Table 24: Middle East & Africa Glioblastoma Market Revenue (USD Billion) Forecast, by Country, 2016-2027
      Research Process

      Data Library Research are conducted by industry experts who offer insight on industry structure, market segmentations technology assessment and competitive landscape (CL), and penetration, as well as on emerging trends. Their analysis is based on primary interviews (~ 80%) and secondary research (~ 20%) as well as years of professional expertise in their respective industries. Adding to this, by analysing historical trends and current market positions, our analysts predict where the market will be headed for the next five years. Furthermore, the varying trends of segment & categories geographically presented are also studied and the estimated based on the primary & secondary research.

      In this particular report from the supply side Data Library Research has conducted primary surveys (interviews) with the key level executives (VP, CEO’s, Marketing Director, Business Development Manager and SOFT) of the companies that active & prominent as well as the midsized organization

      FIGURE 1: DLR RESEARH PROCESS

      research-methodology1

      Primary Research

      Extensive primary research was conducted to gain a deeper insight of the market and industry performance. The analysis is based on both primary and secondary research as well as years of professional expertise in the respective industries.

      In addition to analysing current and historical trends, our analysts predict where the market is headed over the next five years.

      It varies by segment for these categories geographically presented in the list of market tables. Speaking about this particular report we have conducted primary surveys (interviews) with the key level executives (VP, CEO’s, Marketing Director, Business Development Manager and many more) of the major players active in the market.

      Secondary Research

      Secondary research was mainly used to collect and identify information useful for the extensive, technical, market-oriented, and Friend’s study of the Global Extra Neutral Alcohol. It was also used to obtain key information about major players, market classification and segmentation according to the industry trends, geographical markets, and developments related to the market and technology perspectives. For this study, analysts have gathered information from various credible sources, such as annual reports, sec filings, journals, white papers, SOFT presentations, and company web sites.

      Market Size Estimation

      Both, top-down and bottom-up approaches were used to estimate and validate the size of the Global market and to estimate the size of various other dependent submarkets in the overall Extra Neutral Alcohol. The key players in the market were identified through secondary research and their market contributions in the respective geographies were determined through primary and secondary research.

      Forecast Model

      research-methodology2