Tax Software Market Overview
The global tax software market is influenced by a number of factors, including the convergence of digital devices and technologies with traditional business processes, as well as a rapidly changing industrial environment, all of which are gradually increasing demand for tax software and thus accelerating global growth.
The tax market is undergoing a digital change. Today, people manage their tax affairs using a variety of digital platforms, with more than 85 percent of self-assessment tax returns completed online. Large and small businesses are working together to produce digital accounts in order to create a bold vision for the future of the tax system. This is predicted to be one of the major factors propelling the tax software market forward.
Taxpayers will gain a real-time view of their tax affairs and will be able to see how their tax is computed as a result of the use of digital solutions. They can also see how much tax they owe or need to be refunded, as well as track their payment decisions. During the projected period, this is also expected to further drive the expansion of the tax software market.
| Report Metric |
Details |
| Market size available for years |
2023–2030 |
| Base year considered |
2023 |
| Forecast period |
2024–2030 |
| Forecast unit |
Value (USD Million) |
| Segments covered |
Component, Software Deployment, Industry, and Region. |
| Regions covered |
North America (the U.S. and Canada), Europe (UK, Germany, France, Italy, Spain, Russia, Rest of Europe), Asia-Pacific (China, India, Japan, Australia, South East Asia, Rest of Asia Pacific), Latin America and the Middle East and Africa (Brazil, Saudi Arabia, UAE, Rest of LAMEA) |
| Companies covered |
Automatic Data Processing, Inc., Avalara Blucora, Inc., Chetu, Inc., Drake Software, H&R Block, Intuit Inc., Sage Tax & Financial Solutions, TaxSlayer LLC, Thomson Reuters Corporation, Vertex, Inc., Wolters Kluwer N.V. (Kluwer Publishers and Wolters Samsom), and Xero Limited. |
Covid-19 Impact on Tax Software Market
Like many other industries, COVID-19 badly knocked the electronic and semiconductor industries. This unprecedented event has impacted nearly 230 countries in just a few weeks, resulting in the forced shutdown of manufacturing and transportation activities within and across the countries. This has directly affected the overall sector's growth. It is estimated that COVID-19 to leave more than USD 30 billion impacts on the electronics and semiconductor industry. The sector is majorly affected due to transport restrictions on major electronics and semiconductor raw material providers. However, the emerging need for semiconductors in several industries will offer rapid market recovery over the future period.
Tax Software Market Segment Overview
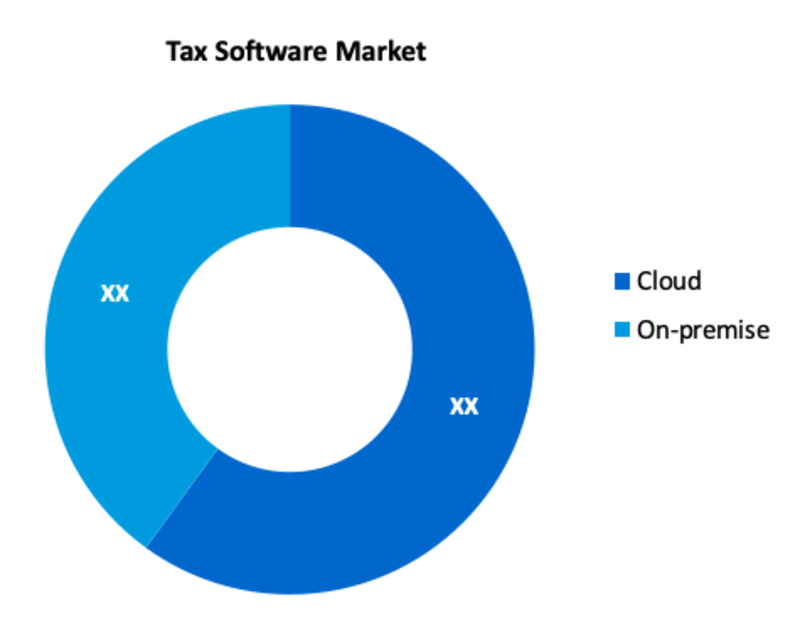
According to Software Deployment, Cloud is one of the largest segments in the global Tax Software Market. Businesses benefit from the scalability and flexibility of cloud-based software solutions. Companies are developing software that makes co-sourcing and adhering to industry standards easier. They are developing software to assist users in calculating taxes based on the appropriate area and service. Cloud-based software aids in the recording of real-time changes in work papers.
Tax Software Market, By Component
· Tax Software
· Services
Tax Software Market, By Software Deployment
· Cloud
· On-premise
Tax Software Market, By Industry
· BFSI
· Telecom & IT
· Government
· Healthcare
· Retail & Consumer Goods
· Transportation
· Manufacturing
· Energy & Utilities
· Others
Tax Software Regional Overview
In terms of geography, the global Tax Software market is classified into North America, South America, Europe, Asia Pacific, and Middle East & Africa. Because North America is a developed region, new technologies and innovations are projected to be major trends in the next years. Because of the presence of key companies and government support for installing tax software to provide security and tax management solutions, North America held a significant share of the global tax software market in 2020 and is likely to keep its dominance in the industry.
The tax software market in Europe is expected to grow at a healthy rate over the forecast period, thanks to rising awareness of tax software and the development of tax processes and reporting frameworks through the use of information and communication technology.
Furthermore, during the forecast period, the Asia Pacific market is expected to increase significantly. This is owing to the widespread use of tax software in Singapore, China, India, Malaysia, Taiwan, and other countries. Furthermore, Asia Pacific is the fastest expanding market, owing to the increasing use of tax software by small and medium companies.
Tax Software Market, By Geography
· North America (US & Canada)
· Europe (UK, Germany, France, Italy, Spain, Russia & Rest of Europe)
· Asia-Pacific (Japan, China, India, Australia, & South Korea, & Rest of Asia-Pacific)
· LAMEA (Brazil, Saudi Arabia, UAE & Rest of LAMEA)
Tax Software Market Competitor overview
· In February 2022, startup Clear (formerly ClearTax) launched a crypto tax platform to track and manage portfolios across exchanges and wallets. Clear aims to help users track their crypto returns, market value and taxes on their transactions.
Tax Software Market, Key Players
· Automatic Data Processing, Inc.
· Avalara Blucora, Inc.
· Chetu, Inc.
· Drake Software
· H&R Block
· Intuit Inc.
· Sage Tax & Financial Solutions
· TaxSlayer LLC
· Thomson Reuters Corporation
· Vertex, Inc.
· Wolters Kluwer N.V. (Kluwer Publishers and Wolters Samsom)
· Xero Limited
Frequently Asked Questions (FAQ) :
Q1. What are the driving factors for the global Tax Software market?
Large and small businesses are working together to produce digital accounts in order to create a bold vision for the future of the tax system. This is predicted to be one of the major factors propelling the tax software market forward
Q2. Which Segments are covered in the global Tax Software market report?
Component, Software Deployment, Industry, and Region. these segments are covered in the global Tax Software market report
Q3. Which segment is projected to hold the largest share in the global Tax Software market?
The cloud segment is projected to hold the largest share in the global Tax Software market.
Q4. Which region holds the largest share in the global Tax Software market?
North America holds the largest share in the global Tax Software market.
Q5. Which are the prominent players in the global Tax Software market?
Automatic Data Processing, Inc., Avalara Blucora, Inc., Chetu, Inc., Drake Software, H&R Block, Intuit Inc., Sage Tax & Financial Solutions, TaxSlayer LLC, Thomson Reuters Corporation, Vertex, Inc., Wolters Kluwer N.V. (Kluwer Publishers and Wolters Samsom), and Xero Limited. are some key players in the global Tax Software market.
List of Figures
Figure 1: Global Sales Tax Software Market Revenue Breakdown (USD Billion, %) by Region, 2019 & 2027
Figure 2: Global Sales Tax Software Market Value Share (%), By Segment 1, 2019 & 2027
Figure 3: Global Sales Tax Software Market Forecast (USD Billion), by Sub-Segment 1, 2016-2027
Figure 4: Global Sales Tax Software Market Forecast (USD Billion), by Sub-Segment 2, 2016-2027
Figure 5: Global Sales Tax Software Market Value Share (%), By Segment 2, 2019 & 2027
Figure 6: Global Sales Tax Software Market Forecast (USD Billion), by Sub-Segment 1, 2016-2027
Figure 7: Global Sales Tax Software Market Forecast (USD Billion), by Sub-Segment 2, 2016-2027
Figure 8: Global Sales Tax Software Market Forecast (USD Billion), by Sub-Segment 3, 2016-2027
Figure 9: Global Sales Tax Software Market Forecast (USD Billion), by Others, 2016-2027
Figure 10: Global Sales Tax Software Market Value Share (%), By Segment 3, 2019 & 2027
Figure 11: Global Sales Tax Software Market Forecast (USD Billion), by Sub-Segment 1, 2016-2027
Figure 12: Global Sales Tax Software Market Forecast (USD Billion), by Sub-Segment 2, 2016-2027
Figure 13: Global Sales Tax Software Market Forecast (USD Billion), by Sub-Segment 3, 2016-2027
Figure 14: Global Sales Tax Software Market Forecast (USD Billion), by Others, 2016-2027
Figure 15: Global Sales Tax Software Market Value (USD Billion), by Region, 2019 & 2027
Figure 16: North America Sales Tax Software Market Value Share (%), By Segment 1, 2019 & 2027
Figure 17: North America Sales Tax Software Market Forecast (USD Billion), by Sub-Segment 1, 2016-2027
Figure 18: North America Sales Tax Software Market Forecast (USD Billion), by Sub-Segment 2, 2016-2027
Figure 19: North America Sales Tax Software Market Value Share (%), By Segment 2, 2019 & 2027
Figure 20: North America Sales Tax Software Market Forecast (USD Billion), by Sub-Segment 1, 2016-2027
Figure 21: North America Sales Tax Software Market Forecast (USD Billion), by Sub-Segment 2, 2016-2027
Figure 22: North America Sales Tax Software Market Forecast (USD Billion), by Sub-Segment 3, 2016-2027
Figure 23: North America Sales Tax Software Market Forecast (USD Billion), by Others, 2016-2027
Figure 24: North America Sales Tax Software Market Value Share (%), By Segment 3, 2019 & 2027
Figure 25: North America Sales Tax Software Market Forecast (USD Billion), by Sub-Segment 1, 2016-2027
Figure 26: North America Sales Tax Software Market Forecast (USD Billion), by Sub-Segment 2, 2016-2027
Figure 27: North America Sales Tax Software Market Forecast (USD Billion), by Sub-Segment 3, 2016-2027
Figure 28: North America Sales Tax Software Market Forecast (USD Billion), by Others, 2016-2027
Figure 29: North America Sales Tax Software Market Forecast (USD Billion), by U.S., 2016-2027
Figure 30: North America Sales Tax Software Market Forecast (USD Billion), by Canada, 2016-2027
Figure 31: Latin America Sales Tax Software Market Value Share (%), By Segment 1, 2019 & 2027
Figure 32: Latin America Sales Tax Software Market Forecast (USD Billion), by Sub-Segment 1, 2016-2027
Figure 33: Latin America Sales Tax Software Market Forecast (USD Billion), by Sub-Segment 2, 2016-2027
Figure 34: Latin America Sales Tax Software Market Value Share (%), By Segment 2, 2019 & 2027
Figure 35: Latin America Sales Tax Software Market Forecast (USD Billion), by Sub-Segment 1, 2016-2027
Figure 36: Latin America Sales Tax Software Market Forecast (USD Billion), by Sub-Segment 2, 2016-2027
Figure 37: Latin America Sales Tax Software Market Forecast (USD Billion), by Sub-Segment 3, 2016-2027
Figure 38: Latin America Sales Tax Software Market Forecast (USD Billion), by Others, 2016-2027
Figure 39: Latin America Sales Tax Software Market Value Share (%), By Segment 3, 2019 & 2027
Figure 40: Latin America Sales Tax Software Market Forecast (USD Billion), by Sub-Segment 1, 2016-2027
Figure 41: Latin America Sales Tax Software Market Forecast (USD Billion), by Sub-Segment 2, 2016-2027
Figure 42: Latin America Sales Tax Software Market Forecast (USD Billion), by Sub-Segment 3, 2016-2027
Figure 43: Latin America Sales Tax Software Market Forecast (USD Billion), by Others, 2016-2027
Figure 44: Latin America Sales Tax Software Market Forecast (USD Billion), by Brazil, 2016-2027
Figure 45: Latin America Sales Tax Software Market Forecast (USD Billion), by Mexico, 2016-2027
Figure 46: Latin America Sales Tax Software Market Forecast (USD Billion), by Rest of Latin America, 2016-2027
Figure 47: Europe Sales Tax Software Market Value Share (%), By Segment 1, 2019 & 2027
Figure 48: Europe Sales Tax Software Market Forecast (USD Billion), by Sub-Segment 1, 2016-2027
Figure 49: Europe Sales Tax Software Market Forecast (USD Billion), by Sub-Segment 2, 2016-2027
Figure 50: Europe Sales Tax Software Market Value Share (%), By Segment 2, 2019 & 2027
Figure 51: Europe Sales Tax Software Market Forecast (USD Billion), by Sub-Segment 1, 2016-2027
Figure 52: Europe Sales Tax Software Market Forecast (USD Billion), by Sub-Segment 2, 2016-2027
Figure 53: Europe Sales Tax Software Market Forecast (USD Billion), by Sub-Segment 3, 2016-2027
Figure 54: Europe Sales Tax Software Market Forecast (USD Billion), by Others, 2016-2027
Figure 55: Europe Sales Tax Software Market Value Share (%), By Segment 3, 2019 & 2027
Figure 56: Europe Sales Tax Software Market Forecast (USD Billion), by Sub-Segment 1, 2016-2027
Figure 57: Europe Sales Tax Software Market Forecast (USD Billion), by Sub-Segment 2, 2016-2027
Figure 58: Europe Sales Tax Software Market Forecast (USD Billion), by Sub-Segment 3, 2016-2027
Figure 59: Europe Sales Tax Software Market Forecast (USD Billion), by Others, 2016-2027
Figure 60: Europe Sales Tax Software Market Forecast (USD Billion), by U.K., 2016-2027
Figure 61: Europe Sales Tax Software Market Forecast (USD Billion), by Germany, 2016-2027
Figure 62: Europe Sales Tax Software Market Forecast (USD Billion), by France, 2016-2027
Figure 63: Europe Sales Tax Software Market Forecast (USD Billion), by Italy, 2016-2027
Figure 64: Europe Sales Tax Software Market Forecast (USD Billion), by Spain, 2016-2027
Figure 65: Europe Sales Tax Software Market Forecast (USD Billion), by Russia, 2016-2027
Figure 66: Europe Sales Tax Software Market Forecast (USD Billion), by Rest of Europe, 2016-2027
Figure 67: Asia Pacific Sales Tax Software Market Value Share (%), By Segment 1, 2019 & 2027
Figure 68: Asia Pacific Sales Tax Software Market Forecast (USD Billion), by Sub-Segment 1, 2016-2027
Figure 69: Asia Pacific Sales Tax Software Market Forecast (USD Billion), by Sub-Segment 2, 2016-2027
Figure 70: Asia Pacific Sales Tax Software Market Value Share (%), By Segment 2, 2019 & 2027
Figure 71: Asia Pacific Sales Tax Software Market Forecast (USD Billion), by Sub-Segment 1, 2016-2027
Figure 72: Asia Pacific Sales Tax Software Market Forecast (USD Billion), by Sub-Segment 2, 2016-2027
Figure 73: Asia Pacific Sales Tax Software Market Forecast (USD Billion), by Sub-Segment 3, 2016-2027
Figure 74: Asia Pacific Sales Tax Software Market Forecast (USD Billion), by Others, 2016-2027
Figure 75: Asia Pacific Sales Tax Software Market Value Share (%), By Segment 3, 2019 & 2027
Figure 76: Asia Pacific Sales Tax Software Market Forecast (USD Billion), by Sub-Segment 1, 2016-2027
Figure 77: Asia Pacific Sales Tax Software Market Forecast (USD Billion), by Sub-Segment 2, 2016-2027
Figure 78: Asia Pacific Sales Tax Software Market Forecast (USD Billion), by Sub-Segment 3, 2016-2027
Figure 79: Asia Pacific Sales Tax Software Market Forecast (USD Billion), by Others, 2016-2027
Figure 80: Asia Pacific Sales Tax Software Market Forecast (USD Billion), by China, 2016-2027
Figure 81: Asia Pacific Sales Tax Software Market Forecast (USD Billion), by India, 2016-2027
Figure 82: Asia Pacific Sales Tax Software Market Forecast (USD Billion), by Japan, 2016-2027
Figure 83: Asia Pacific Sales Tax Software Market Forecast (USD Billion), by Australia, 2016-2027
Figure 84: Asia Pacific Sales Tax Software Market Forecast (USD Billion), by Southeast Asia, 2016-2027
Figure 85: Asia Pacific Sales Tax Software Market Forecast (USD Billion), by Rest of Asia Pacific, 2016-2027
Figure 86: Middle East & Africa Sales Tax Software Market Value Share (%), By Segment 1, 2019 & 2027
Figure 87: Middle East & Africa Sales Tax Software Market Forecast (USD Billion), by Sub-Segment 1, 2016-2027
Figure 88: Middle East & Africa Sales Tax Software Market Forecast (USD Billion), by Sub-Segment 2, 2016-2027
Figure 89: Middle East & Africa Sales Tax Software Market Value Share (%), By Segment 2, 2019 & 2027
Figure 90: Middle East & Africa Sales Tax Software Market Forecast (USD Billion), by Sub-Segment 1, 2016-2027
Figure 91: Middle East & Africa Sales Tax Software Market Forecast (USD Billion), by Sub-Segment 2, 2016-2027
Figure 92: Middle East & Africa Sales Tax Software Market Forecast (USD Billion), by Sub-Segment 3, 2016-2027
Figure 93: Middle East & Africa Sales Tax Software Market Forecast (USD Billion), by Others, 2016-2027
Figure 94: Middle East & Africa Sales Tax Software Market Value Share (%), By Segment 3, 2019 & 2027
Figure 95: Middle East & Africa Sales Tax Software Market Forecast (USD Billion), by Sub-Segment 1, 2016-2027
Figure 96: Middle East & Africa Sales Tax Software Market Forecast (USD Billion), by Sub-Segment 2, 2016-2027
Figure 97: Middle East & Africa Sales Tax Software Market Forecast (USD Billion), by Sub-Segment 3, 2016-2027
Figure 98: Middle East & Africa Sales Tax Software Market Forecast (USD Billion), by Others, 2016-2027
Figure 99: Middle East & Africa Sales Tax Software Market Forecast (USD Billion), by GCC, 2016-2027
Figure 100: Middle East & Africa Sales Tax Software Market Forecast (USD Billion), by South Africa, 2016-2027
Figure 101: Middle East & Africa Sales Tax Software Market Forecast (USD Billion), by Rest of Middle East & Africa, 2016-2027
List of Tables
Table 1: Global Sales Tax Software Market Revenue (USD Billion) Forecast, by Segment 1, 2016-2027
Table 2: Global Sales Tax Software Market Revenue (USD Billion) Forecast, by Segment 2, 2016-2027
Table 3: Global Sales Tax Software Market Revenue (USD Billion) Forecast, by Segment 3, 2016-2027
Table 4: Global Sales Tax Software Market Revenue (USD Billion) Forecast, by Region, 2016-2027
Table 5: North America Sales Tax Software Market Revenue (USD Billion) Forecast, by Segment 1, 2016-2027
Table 6: North America Sales Tax Software Market Revenue (USD Billion) Forecast, by Segment 2, 2016-2027
Table 7: North America Sales Tax Software Market Revenue (USD Billion) Forecast, by Segment 3, 2016-2027
Table 8: North America Sales Tax Software Market Revenue (USD Billion) Forecast, by Country, 2016-2027
Table 9: Europe Sales Tax Software Market Revenue (USD Billion) Forecast, by Segment 1, 2016-2027
Table 10: Europe Sales Tax Software Market Revenue (USD Billion) Forecast, by Segment 2, 2016-2027
Table 11: Europe Sales Tax Software Market Revenue (USD Billion) Forecast, by Segment 3, 2016-2027
Table 12: Europe Sales Tax Software Market Revenue (USD Billion) Forecast, by Country, 2016-2027
Table 13: Latin America Sales Tax Software Market Revenue (USD Billion) Forecast, by Segment 1, 2016-2027
Table 14: Latin America Sales Tax Software Market Revenue (USD Billion) Forecast, by Segment 2, 2016-2027
Table 15: Latin America Sales Tax Software Market Revenue (USD Billion) Forecast, by Segment 3, 2016-2027
Table 16: Latin America Sales Tax Software Market Revenue (USD Billion) Forecast, by Country, 2016-2027
Table 17: Asia Pacific Sales Tax Software Market Revenue (USD Billion) Forecast, by Segment 1, 2016-2027
Table 18: Asia Pacific Sales Tax Software Market Revenue (USD Billion) Forecast, by Segment 2, 2016-2027
Table 19: Asia Pacific Sales Tax Software Market Revenue (USD Billion) Forecast, by Segment 3, 2016-2027
Table 20: Asia Pacific Sales Tax Software Market Revenue (USD Billion) Forecast, by Country, 2016-2027
Table 21: Middle East & Africa Sales Tax Software Market Revenue (USD Billion) Forecast, by Segment 1, 2016-2027
Table 22: Middle East & Africa Sales Tax Software Market Revenue (USD Billion) Forecast, by Segment 2, 2016-2027
Table 23: Middle East & Africa Sales Tax Software Market Revenue (USD Billion) Forecast, by Segment 3, 2016-2027
Table 24: Middle East & Africa Sales Tax Software Market Revenue (USD Billion) Forecast, by Country, 2016-2027
Research Process
Data Library Research are conducted by industry experts who offer insight on
industry structure, market segmentations technology assessment and competitive landscape (CL), and penetration, as well as on emerging trends. Their analysis is based on primary interviews (~ 80%) and secondary research (~ 20%) as well as years of professional expertise in their respective industries. Adding to this, by analysing historical trends and current market positions, our analysts predict where the market will be headed for the next five years. Furthermore, the varying trends of segment & categories geographically presented are also studied and the estimated based on the primary & secondary research.
In this particular report from the supply side Data Library Research has conducted primary surveys (interviews) with the key level executives (VP, CEO’s, Marketing Director, Business Development Manager
and SOFT) of the companies that active & prominent as well as the midsized organization
FIGURE 1: DLR RESEARH PROCESS

Primary Research
Extensive primary research was conducted to gain a deeper insight of the market and industry performance. The analysis is based on both primary and secondary research as well as years of professional expertise in the respective industries.
In addition to analysing current and historical trends, our analysts predict where the market is headed over the next five years.
It varies by segment for these categories geographically presented in the list of market tables. Speaking about this particular report we have conducted primary surveys (interviews) with the key level executives (VP, CEO’s, Marketing Director, Business Development Manager and many more) of the major players active in the market.
Secondary Research
Secondary research was mainly used to collect and identify information useful for the extensive, technical, market-oriented, and Friend’s study of the Global Extra Neutral Alcohol. It was also used to obtain key information about major players, market classification and segmentation according to the industry trends, geographical markets, and developments related to the market and technology perspectives. For this study, analysts have gathered information from various credible sources, such as annual reports, sec filings, journals, white papers, SOFT presentations, and company web sites.
Market Size Estimation
Both, top-down and bottom-up approaches were used to estimate and validate the size of the Global market and to estimate the size of various other dependent submarkets in the overall Extra Neutral Alcohol. The key players in the market were identified through secondary research and their market contributions in the respective geographies were determined through primary and secondary research.
Forecast Model
