Sodium Carbonate Market Overview and Analysis:

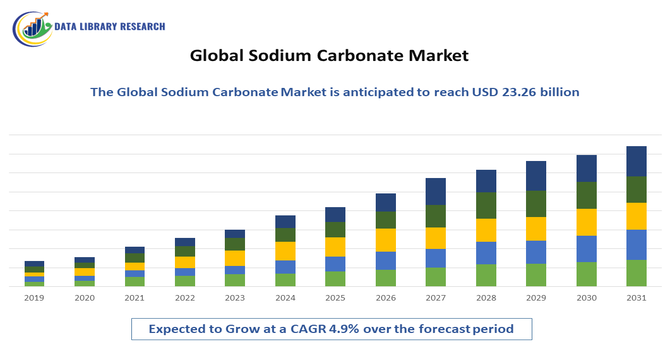
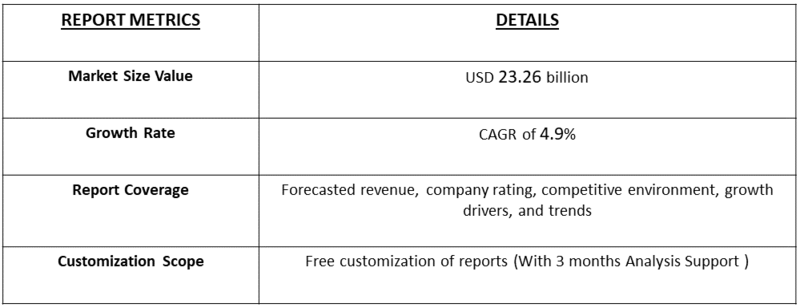
The global sodium carbonate market size is estimated at USD 14.02 billion in 2025 and is anticipated to reach around USD 23.26 billion by 2035, growing with a CAGR of 4.9%.

Sodium carbonate, also known as soda ash, is a versatile inorganic compound with a wide range of industrial and commercial applications. The key driving factors for the sodium carbonate market include the growing demand from the glass, detergent, and chemical industries. In the glass industry, sodium carbonate is used as a key raw material in the production of flat, container, and specialty glass. In the detergent industry, it is used as a builder to enhance the cleaning effectiveness of detergents. Additionally, the compound is widely used in the production of various chemicals, such as sodium silicate, sodium bicarbonate, and hydrogen peroxide, further contributing to the market's growth. The increasing emphasis on sustainability and the development of eco-friendly products are also expected to drive the demand for sodium carbonate in the coming years.

Sodium Carbonate Market Latest Trends:

The sodium carbonate market is currently experiencing several defining trends. A significant and steady driver is the robust global demand from the glass manufacturing sector, which remains the largest consumer. This is closely tied to growth in the construction and automotive industries, both of which rely heavily on flat and container glass. Alongside this, there's a noticeable uptick in demand from the detergent industry, particularly within emerging economies where rising disposable incomes are changing consumption patterns. Furthermore, the market is seeing an increased application of soda ash in environmental technologies, such as in water treatment and flue gas desulfurization processes, as industries seek more effective solutions for meeting stricter environmental regulations. This diversification of use is helping to stabilize and gradually grow the market overall.

Segmentation:

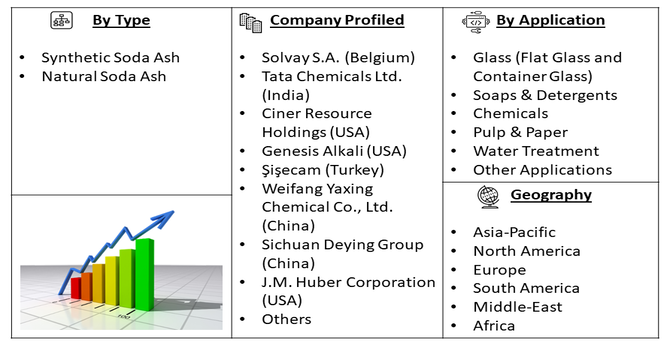
The global sodium carbonate market is segmented by Type (Synthetic Soda Ash and Natural Soda Ash), Application (Glass (Flat Glass and Container Glass), Soaps & Detergents, Chemicals, Pulp & Paper, Water Treatment, and Other Applications), and Geography (North America, Europe, Asia-Pacific, South America, and Middle East & Africa). The report offers market size and forecasts in terms of value (USD million) for all the aforementioned segments.

Market Drivers

  • Surging Demand from the Glass Industry

The sodium carbonate market is being propelled by strong demand from the glass industry, helped by smarter, more sustainable production methods. As infrastructure and construction pick up in emerging economies, soda ash usage rises for traditional glassmaking, while glass plays a bigger role in automotive design and packaging keeps steady, fueling ongoing demand.

New growth is also coming from specialized glass for solar panels and high tech displays, which opens additional opportunities for producers. Furthermore, Fraunhofer’s 2024 Green Soda project showcases an eco-friendly production route using bipolar electrodialysis of brine with CO₂ addition, enabling greener, locally produced soda. This combination of expanding applications and greener manufacturing strengthens long-term resilience and competitiveness for soda ash players. Moreover, clearer sustainability credentials may attract investment and unlock new partnerships across industries.

  • Growth in Chemical and Emerging Applications

A significant secondary driver is the expanding application of sodium carbonate in the production of soaps, detergents, and various chemicals. As disposable incomes rise, particularly in Asia-Pacific and Latin America, consumer demand for cleaning and personal care products continues to grow, with sodium carbonate serving as a key builder in powdered detergents and as an essential intermediate for compounds like sodium bicarbonate and sodium silicates. Beyond these established uses, new opportunities are emerging in advanced technologies. For instance, in 2022, Reliance Industries acquired UK-based Faradion to accelerate the commercialization of sodium-ion batteries—an affordable, safer alternative to lithium-ion batteries. Large-scale sodium-ion battery production will require sodium-based compounds, creating a promising new demand avenue for soda ash in the renewable energy and electric vehicle sectors.

Market Restraints:

  • Environmental Regulations and Energy-Intensive Production

A primary restraint on the market growth is the highly energy-intensive nature of the synthetic soda ash production process, primarily the Solvay process, which faces increasing scrutiny under stringent global environmental regulations. This process consumes large amounts of limestone and energy, resulting in substantial carbon dioxide emissions and the generation of calcium chloride as a by-product. Governments worldwide are implementing stricter carbon emission targets and pollution control policies, which directly increase operational compliance costs for manufacturers. These regulations can constrain production capacity expansions, especially in regions with rigorous environmental frameworks, and incentivize a shift towards more sustainable alternatives, thereby potentially limiting the market's growth trajectory.

Social Economic Impact On Sodium Carbonate Market

The sodium carbonate market significantly impacts socio-economic landscapes by supporting foundational industries crucial for infrastructure, consumer goods, and emerging technologies like EVs. Its production creates direct and indirect employment opportunities in mining, chemical processing, and logistics, contributing to regional economic development.

Furthermore, its use in water treatment directly benefits public health. Post-COVID-19, the market experienced initial supply chain disruptions and fluctuating demand, particularly from the automotive sector. However, the subsequent rebound in construction and the surge in demand for materials supporting the green energy transition have bolstered its economic importance. The drive towards sustainable production methods, exemplified by greener manufacturing initiatives, also offers potential for reduced environmental impact and improved community well-being in production areas, further solidifying its socio-economic relevance.

Segmental Analysis:

  • Synthetic Soda Ash Segment is Expected to Witness Significant Growth Over the Forecast Period

The synthetic soda ash segment is poised for robust expansion throughout the forecast period, driven by its increasing adoption in regions where natural trona deposits are scarce or less economically viable. While natural soda ash production is geographically concentrated, synthetic methods offer greater flexibility in terms of location and production scale, allowing manufacturers to establish plants closer to end-user markets and reduce logistical costs. Furthermore, advancements in production technologies are enhancing the efficiency and cost-effectiveness of synthetic processes, making them increasingly competitive. This segment's growth is also supported by a consistent demand from various chemical applications that require high purity soda ash, which can be more readily achieved through synthetic routes, thereby positioning it for substantial market penetration and growth.

  • Glass Application Segment is Expected to Witness Significant Growth Over the Forecast Period

The glass application segment is anticipated to experience considerable growth in the coming years, serving as a primary growth engine for the sodium carbonate market. The escalating global demand for glass, fueled by a surge in construction and infrastructure development worldwide, is a major contributor. Furthermore, the automotive industry's increasing reliance on glass for enhanced safety, fuel efficiency, and aesthetic design continues to drive consumption. Innovations in specialized glass, such as those used in solar panels for renewable energy and advanced displays for electronics, are opening up new and expanding markets. This sustained and diversified demand from various glass manufacturing sub-sectors ensures that the glass application segment will remain a cornerstone of growth for sodium carbonate producers throughout the forecast period.

  • Asia Pacific Region is Expected to Witness Significant Growth Over the Forecast Period

The Asia Pacific region is set to remain the engine of demand growth for the global sodium carbonate market, supported by industrialization, infrastructure expansion, and consumer-driven sectors like detergents and chemicals.

In January 2025, Sisecam, took a major step toward strengthening its position in the soda ash industry by acquiring all shares of its partner Ciner Group in the U.S. soda investments. With this deal, Sisecam’s ownership in Pacific Soda LLC increased to 100%, giving it full control of a large-scale natural soda ash project in Wyoming. Once completed, the Pacific Soda facility will add 5 million tons of annual production capacity, boosting Sisecam’s global scale, supply chain strength, and sustainability profile. For Asia Pacific, this development assures supply, pricing stability, and access to sustainable, large-scale production—critical enablers of continued growth. Also, favorable demand conditions at home and robust supply security from global leaders, the Asia Pacific sodium carbonate market is expected to witness highest growth over the forecast period.

Sodium Carbonate Market Competitive Landscape:

The competitive landscape for the sodium carbonate market is characterized by a mix of large multinational producers, regional players, and integrated chemical groups that compete on scale, vertical integration, and sustainability credentials. Leading incumbents leverage diversified product portfolios, stable supply agreements, and advanced production technologies, including greener, lower-emission methods, to lock in long-term contracts with glass, packaging, and solar/electronics manufacturers. Regional players often compete on near-term pricing, responsive logistics, and customized grade specifications, while niche suppliers focus on specialty grades and rapid customization. Key competitive differentiators include cost efficiency, access to raw materials, energy management, and environmental performance disclosures. Growth tends to favor firms investing in transparent supply chains, digitalized operations, and partnerships across end-use sectors to mitigate cyclicality and capitalize on green production trends.

Here are 10 key players in the sodium carbonate market:

  • Solvay S.A. (Belgium)
  • Tata Chemicals Ltd. (India)
  • Ciner Resource Holdings (USA)
  • Genesis Alkali (USA)
  • Şişecam (Turkey)
  • Weifang Yaxing Chemical Co., Ltd. (China)
  • Sichuan Deying Group (China)
  • J.M. Huber Corporation (USA)
  • National Soda Products Company (Saudi Arabia)
  • GHCL Limited (India)

Recent Developments:

  • In March 2025, WE Soda Ltd., backed by Ciner Enterprises, completed a US$1.425 billion acquisition of Genesis Alkali, the largest natural soda ash producer in the US. This deal positions WE Soda as the world’s largest soda ash producer with a total capacity of around 9.5 million metric tonnes annually. The acquisition not only strengthens its production scale and global footprint but also enhances supply chain resilience and customer reach. With its leadership in low-emission soda ash production, WE Soda is well-placed to meet rising demand across glass, chemicals, and emerging green technologies, driving growth in the global sodium carbonate market.
  • In December 2024, Tata Chemicals North America announced plans to transform its Green River soda ash mining site in Wyoming into a hub for clean nuclear power generation. The company has signed an agreement with BWXT Advanced Technologies to deploy up to eight advanced microreactors (BANRs) at the site by the early 2030s. This initiative aims to replace conventional energy sources with carbon-free nuclear power, significantly reducing emissions from soda ash production. By integrating sustainable energy into operations, Tata Chemicals not only lowers its environmental footprint but also enhances long-term competitiveness and resilience in the global sodium carbonate market. @@


Frequently Asked Questions (FAQ) :

Q1. What are the main growth driving factors for this market?

The primary growth drivers for the sodium carbonate market are the strong demand from the glass industry, which accounts for the majority of consumption, particularly in flat, container, and solar glass. Rising construction and infrastructure projects, growing use of glass in the automotive sector, and the rapid expansion of solar panel installations are boosting demand. In addition, steady consumption from detergents, soaps, and other chemical intermediates continues to support market growth. Emerging applications, such as sodium-ion batteries for renewable energy storage and electric vehicles, are also opening new long-term opportunities.

Q2. What are the main restraining factors for this market?

The market faces restraints due to persistent oversupply, particularly from China, which has led to regional price pressures and lower profitability. Environmental regulations related to emissions, waste management, and water use also increase production and compliance costs, especially in synthetic soda ash production. Furthermore, volatility in energy prices, raw material availability, and logistics costs creates challenges for producers in maintaining stable margins.

Q3. Which segment is expected to witness high growth?

The glass segment, especially flat glass and solar glass, is expected to witness the highest growth, supported by demand from construction, architectural applications, and renewable energy installations. In addition, the emerging use of sodium carbonate in sodium-ion battery production for energy storage and electric vehicles represents a fast-developing segment with strong growth potential in the coming years.

Q4. Who are the top major players for this market?

The leading players in the global sodium carbonate market include Tata Chemicals, Ciner Group, Solvay, Nirma, DCW Ltd., Shandong Haihua Group, Sisecam, Genesis Alkali (Tronox), and WE Soda, among others. These companies dominate the market through large-scale production capacities, technological advancements, and global supply networks.

Q5. Which country is the largest player?

China is the largest producer of sodium carbonate globally, contributing close to 29 million tonnes in 2023. It is followed by Turkey and the United States, with these three countries together accounting for nearly 78% of global production.

Sodium Carbonate Market Study Global Market Analysis, Insights and Forecast, 2023-2030

    1. Introduction

    • 1.1. Research Scope
    • 1.2. Market Segmentation
    • 1.3. Research Methodology
    • 1.4. Definitions and Assumptions

    2. Executive Summary

      3. Market Dynamics

      • 3.1. Market Drivers
      • 3.2. Market Restraints
      • 3.3. Market Opportunities

      4. Key Insights

      • 4.1. Key Emerging Trends – For Major Countries
      • 4.2. Latest Technological Advancement
      • 4.3. Regulatory Landscape
      • 4.4. Industry SWOT Analysis
      • 4.5. Porters Five Forces Analysis

      5. Global Sodium Carbonate Market Analysis (USD Billion), Insights and Forecast, 2023-2030

      • 5.1. Key Findings / Summary
      • 5.2. Market Analysis, Insights and Forecast – By Product
        • 5.2.1. Natural
        • 5.2.2. Synthetic
      • 5.3. Market Analysis, Insights and Forecast – By Application
        • 5.3.1. Glass
        • 5.3.2. Detergents
        • 5.3.3. Water Treatment
        • 5.3.4. Sodium Chemicals
        • 5.3.5. Pulp & Paper
        • 5.3.6. Carbonate Chemicals
        • 5.3.7. Others
      • 5.4. Market Analysis, Insights and Forecast – By Region
        • 5.4.1. North America
        • 5.4.2. Europe
        • 5.4.3. Asia Pacific
        • 5.4.4. Latin America, Middle East, and Africa

      6. North America Sodium Carbonate Market Analysis (USD Billion), Insights and Forecast, 2023-2030

      • 6.1. Key Findings / Summary
      • 6.2. Market Analysis, Insights and Forecast – By Product
        • 6.2.1. Natural
        • 6.2.2. Synthetic
      • 6.3. Market Analysis, Insights and Forecast – By Application
        • 6.3.1. Glass
        • 6.3.2. Detergents
        • 6.3.3. Water Treatment
        • 6.3.4. Sodium Chemicals
        • 6.3.5. Pulp & Paper
        • 6.3.6. Carbonate Chemicals
        • 6.3.7. Others
      • 6.4. Market Analysis, Insights and Forecast – By Country
        • 6.4.1. U.S.
        • 6.4.2. Canada

      7. Europe Sodium Carbonate Market Analysis (USD Billion), Insights and Forecast, 2023-2030

      • 7.1. Key Findings / Summary
      • 7.2. Market Analysis, Insights and Forecast – By Product
        • 7.2.1. Natural
        • 7.2.2. Synthetic
      • 7.3. Market Analysis, Insights and Forecast – By Application
        • 7.3.1. Glass
        • 7.3.2. Detergents
        • 7.3.3. Water Treatment
        • 7.3.4. Sodium Chemicals
        • 7.3.5. Pulp & Paper
        • 7.3.6. Carbonate Chemicals
        • 7.3.7. Others
      • 7.4. Market Analysis, Insights and Forecast – By Country
        • 7.4.1. UK
        • 7.4.2. Germany
        • 7.4.3. France
        • 7.4.4. Italy
        • 7.4.5. Spain
        • 7.4.6. Russia
        • 7.4.7. Rest of Europe

      8. Asia Pacific Sodium Carbonate Market Analysis (USD Billion), Insights and Forecast, 2023-2030

      • 8.1. Key Findings / Summary
      • 8.2. Market Analysis, Insights and Forecast – By Product
        • 8.2.1. Natural
        • 8.2.2. Synthetic
      • 8.3. Market Analysis, Insights and Forecast – By Application
        • 8.3.1. Glass
        • 8.3.2. Detergents
        • 8.3.3. Water Treatment
        • 8.3.4. Sodium Chemicals
        • 8.3.5. Pulp & Paper
        • 8.3.6. Carbonate Chemicals
        • 8.3.7. Others
      • 8.4. Market Analysis, Insights and Forecast – By Country
        • 8.4.1. China
        • 8.4.2. India
        • 8.4.3. Japan
        • 8.4.4. Australia
        • 8.4.5. South East Asia
        • 8.4.6. Rest of Asia Pacific

      9. Latin America, Middle East, and Africa Sodium Carbonate Market Analysis (USD Billion), Insights and Forecast, 2023-2030

      • 9.1. Key Findings / Summary
      • 9.2. Market Analysis, Insights and Forecast – By Product
        • 9.2.1. Natural
        • 9.2.2. Synthetic
      • 9.3. Market Analysis, Insights and Forecast – By Application
        • 9.3.1. Glass
        • 9.3.2. Detergents
        • 9.3.3. Water Treatment
        • 9.3.4. Sodium Chemicals
        • 9.3.5. Pulp & Paper
        • 9.3.6. Carbonate Chemicals
        • 9.3.7. Others
      • 9.4. Market Analysis, Insights and Forecast – By Country
        • 9.4.1. Brazil
        • 9.4.2. Saudi Arabia
        • 9.4.3. UAE
        • 9.4.4. Rest of LAMEA

      10. Competitive Analysis

      • 10.1. Company Market Share Analysis, 2018
      • 10.2. Key Industry Developments
      • 10.3. Company Profile
      • 10.4. CIECH S.A.
        • 10.4.1. Business Overview
        • 10.4.2. Segment 1 & Service Offering
        • 10.4.3. Overall Revenue
        • 10.4.4. Geographic Presence
        • 10.4.5. Recent Development
      *Similar details will be provided for the following companies
      • 10.5. Solvay S.A.
      • 10.6. OCI Chemical Corporation
      • 10.7. Tata Chemicals Limited
      • 10.8. Genesis Energy Limited
      • 10.9. Nirma
      • 10.10. GHCL Limited
      • 10.11. Orison Chemicals Limited
      • 10.12. WE Soda Ltd
      • 10.13. Haohua Honghe Chemical Co Ltd
      • 10.14. FMC Corporation
      List of Figures

      Figure 1: Global Sodium Carbonate Market Revenue Breakdown (USD Billion, %) by Region, 2023 & 2030
      Figure 2: Global Sodium Carbonate Market Value Share (%), By Segment 1, 2023 & 2030
      Figure 3: Global Sodium Carbonate Market Forecast (USD Billion), by Sub-Segment 1, 2018-2030
      Figure 4: Global Sodium Carbonate Market Forecast (USD Billion), by Sub-Segment 2, 2018-2030
      Figure 5: Global Sodium Carbonate Market Value Share (%), By Segment 2, 2023 & 2030
      Figure 6: Global Sodium Carbonate Market Forecast (USD Billion), by Sub-Segment 1, 2018-2030
      Figure 7: Global Sodium Carbonate Market Forecast (USD Billion), by Sub-Segment 2, 2018-2030
      Figure 8: Global Sodium Carbonate Market Forecast (USD Billion), by Sub-Segment 3, 2018-2030
      Figure 9: Global Sodium Carbonate Market Forecast (USD Billion), by Others, 2018-2030
      Figure 10: Global Sodium Carbonate Market Value Share (%), By Segment 3, 2023 & 2030
      Figure 11: Global Sodium Carbonate Market Forecast (USD Billion), by Sub-Segment 1, 2018-2030
      Figure 12: Global Sodium Carbonate Market Forecast (USD Billion), by Sub-Segment 2, 2018-2030
      Figure 13: Global Sodium Carbonate Market Forecast (USD Billion), by Sub-Segment 3, 2018-2030
      Figure 14: Global Sodium Carbonate Market Forecast (USD Billion), by Others, 2018-2030
      Figure 15: Global Sodium Carbonate Market Value (USD Billion), by Region, 2023 & 2030
      Figure 16: North America Sodium Carbonate Market Value Share (%), By Segment 1, 2023 & 2030
      Figure 17: North America Sodium Carbonate Market Forecast (USD Billion), by Sub-Segment 1, 2018-2030
      Figure 18: North America Sodium Carbonate Market Forecast (USD Billion), by Sub-Segment 2, 2018-2030
      Figure 19: North America Sodium Carbonate Market Value Share (%), By Segment 2, 2023 & 2030
      Figure 20: North America Sodium Carbonate Market Forecast (USD Billion), by Sub-Segment 1, 2018-2030
      Figure 21: North America Sodium Carbonate Market Forecast (USD Billion), by Sub-Segment 2, 2018-2030
      Figure 22: North America Sodium Carbonate Market Forecast (USD Billion), by Sub-Segment 3, 2018-2030
      Figure 23: North America Sodium Carbonate Market Forecast (USD Billion), by Others, 2018-2030
      Figure 24: North America Sodium Carbonate Market Value Share (%), By Segment 3, 2023 & 2030
      Figure 25: North America Sodium Carbonate Market Forecast (USD Billion), by Sub-Segment 1, 2018-2030
      Figure 26: North America Sodium Carbonate Market Forecast (USD Billion), by Sub-Segment 2, 2018-2030
      Figure 27: North America Sodium Carbonate Market Forecast (USD Billion), by Sub-Segment 3, 2018-2030
      Figure 28: North America Sodium Carbonate Market Forecast (USD Billion), by Others, 2018-2030
      Figure 29: North America Sodium Carbonate Market Forecast (USD Billion), by U.S., 2018-2030
      Figure 30: North America Sodium Carbonate Market Forecast (USD Billion), by Canada, 2018-2030
      Figure 31: Latin America Sodium Carbonate Market Value Share (%), By Segment 1, 2023 & 2030
      Figure 32: Latin America Sodium Carbonate Market Forecast (USD Billion), by Sub-Segment 1, 2018-2030
      Figure 33: Latin America Sodium Carbonate Market Forecast (USD Billion), by Sub-Segment 2, 2018-2030
      Figure 34: Latin America Sodium Carbonate Market Value Share (%), By Segment 2, 2023 & 2030
      Figure 35: Latin America Sodium Carbonate Market Forecast (USD Billion), by Sub-Segment 1, 2018-2030
      Figure 36: Latin America Sodium Carbonate Market Forecast (USD Billion), by Sub-Segment 2, 2018-2030
      Figure 37: Latin America Sodium Carbonate Market Forecast (USD Billion), by Sub-Segment 3, 2018-2030
      Figure 38: Latin America Sodium Carbonate Market Forecast (USD Billion), by Others, 2018-2030
      Figure 39: Latin America Sodium Carbonate Market Value Share (%), By Segment 3, 2023 & 2030
      Figure 40: Latin America Sodium Carbonate Market Forecast (USD Billion), by Sub-Segment 1, 2018-2030
      Figure 41: Latin America Sodium Carbonate Market Forecast (USD Billion), by Sub-Segment 2, 2018-2030
      Figure 42: Latin America Sodium Carbonate Market Forecast (USD Billion), by Sub-Segment 3, 2018-2030
      Figure 43: Latin America Sodium Carbonate Market Forecast (USD Billion), by Others, 2018-2030
      Figure 44: Latin America Sodium Carbonate Market Forecast (USD Billion), by Brazil, 2018-2030
      Figure 45: Latin America Sodium Carbonate Market Forecast (USD Billion), by Mexico, 2018-2030
      Figure 46: Latin America Sodium Carbonate Market Forecast (USD Billion), by Rest of Latin America, 2018-2030
      Figure 47: Europe Sodium Carbonate Market Value Share (%), By Segment 1, 2023 & 2030
      Figure 48: Europe Sodium Carbonate Market Forecast (USD Billion), by Sub-Segment 1, 2018-2030
      Figure 49: Europe Sodium Carbonate Market Forecast (USD Billion), by Sub-Segment 2, 2018-2030
      Figure 50: Europe Sodium Carbonate Market Value Share (%), By Segment 2, 2023 & 2030
      Figure 51: Europe Sodium Carbonate Market Forecast (USD Billion), by Sub-Segment 1, 2018-2030
      Figure 52: Europe Sodium Carbonate Market Forecast (USD Billion), by Sub-Segment 2, 2018-2030
      Figure 53: Europe Sodium Carbonate Market Forecast (USD Billion), by Sub-Segment 3, 2018-2030
      Figure 54: Europe Sodium Carbonate Market Forecast (USD Billion), by Others, 2018-2030
      Figure 55: Europe Sodium Carbonate Market Value Share (%), By Segment 3, 2023 & 2030
      Figure 56: Europe Sodium Carbonate Market Forecast (USD Billion), by Sub-Segment 1, 2018-2030
      Figure 57: Europe Sodium Carbonate Market Forecast (USD Billion), by Sub-Segment 2, 2018-2030
      Figure 58: Europe Sodium Carbonate Market Forecast (USD Billion), by Sub-Segment 3, 2018-2030
      Figure 59: Europe Sodium Carbonate Market Forecast (USD Billion), by Others, 2018-2030
      Figure 60: Europe Sodium Carbonate Market Forecast (USD Billion), by U.K., 2018-2030
      Figure 61: Europe Sodium Carbonate Market Forecast (USD Billion), by Germany, 2018-2030
      Figure 62: Europe Sodium Carbonate Market Forecast (USD Billion), by France, 2018-2030
      Figure 63: Europe Sodium Carbonate Market Forecast (USD Billion), by Italy, 2018-2030
      Figure 64: Europe Sodium Carbonate Market Forecast (USD Billion), by Spain, 2018-2030
      Figure 65: Europe Sodium Carbonate Market Forecast (USD Billion), by Russia, 2018-2030
      Figure 66: Europe Sodium Carbonate Market Forecast (USD Billion), by Rest of Europe, 2018-2030
      Figure 67: Asia Pacific Sodium Carbonate Market Value Share (%), By Segment 1, 2023 & 2030
      Figure 68: Asia Pacific Sodium Carbonate Market Forecast (USD Billion), by Sub-Segment 1, 2018-2030
      Figure 69: Asia Pacific Sodium Carbonate Market Forecast (USD Billion), by Sub-Segment 2, 2018-2030
      Figure 70: Asia Pacific Sodium Carbonate Market Value Share (%), By Segment 2, 2023 & 2030
      Figure 71: Asia Pacific Sodium Carbonate Market Forecast (USD Billion), by Sub-Segment 1, 2018-2030
      Figure 72: Asia Pacific Sodium Carbonate Market Forecast (USD Billion), by Sub-Segment 2, 2018-2030
      Figure 73: Asia Pacific Sodium Carbonate Market Forecast (USD Billion), by Sub-Segment 3, 2018-2030
      Figure 74: Asia Pacific Sodium Carbonate Market Forecast (USD Billion), by Others, 2018-2030
      Figure 75: Asia Pacific Sodium Carbonate Market Value Share (%), By Segment 3, 2023 & 2030
      Figure 76: Asia Pacific Sodium Carbonate Market Forecast (USD Billion), by Sub-Segment 1, 2018-2030
      Figure 77: Asia Pacific Sodium Carbonate Market Forecast (USD Billion), by Sub-Segment 2, 2018-2030
      Figure 78: Asia Pacific Sodium Carbonate Market Forecast (USD Billion), by Sub-Segment 3, 2018-2030
      Figure 79: Asia Pacific Sodium Carbonate Market Forecast (USD Billion), by Others, 2018-2030
      Figure 80: Asia Pacific Sodium Carbonate Market Forecast (USD Billion), by China, 2018-2030
      Figure 81: Asia Pacific Sodium Carbonate Market Forecast (USD Billion), by India, 2018-2030
      Figure 82: Asia Pacific Sodium Carbonate Market Forecast (USD Billion), by Japan, 2018-2030
      Figure 83: Asia Pacific Sodium Carbonate Market Forecast (USD Billion), by Australia, 2018-2030
      Figure 84: Asia Pacific Sodium Carbonate Market Forecast (USD Billion), by Southeast Asia, 2018-2030
      Figure 85: Asia Pacific Sodium Carbonate Market Forecast (USD Billion), by Rest of Asia Pacific, 2018-2030
      Figure 86: Middle East & Africa Sodium Carbonate Market Value Share (%), By Segment 1, 2023 & 2030
      Figure 87: Middle East & Africa Sodium Carbonate Market Forecast (USD Billion), by Sub-Segment 1, 2018-2030
      Figure 88: Middle East & Africa Sodium Carbonate Market Forecast (USD Billion), by Sub-Segment 2, 2018-2030
      Figure 89: Middle East & Africa Sodium Carbonate Market Value Share (%), By Segment 2, 2023 & 2030
      Figure 90: Middle East & Africa Sodium Carbonate Market Forecast (USD Billion), by Sub-Segment 1, 2018-2030
      Figure 91: Middle East & Africa Sodium Carbonate Market Forecast (USD Billion), by Sub-Segment 2, 2018-2030
      Figure 92: Middle East & Africa Sodium Carbonate Market Forecast (USD Billion), by Sub-Segment 3, 2018-2030
      Figure 93: Middle East & Africa Sodium Carbonate Market Forecast (USD Billion), by Others, 2018-2030
      Figure 94: Middle East & Africa Sodium Carbonate Market Value Share (%), By Segment 3, 2023 & 2030
      Figure 95: Middle East & Africa Sodium Carbonate Market Forecast (USD Billion), by Sub-Segment 1, 2018-2030
      Figure 96: Middle East & Africa Sodium Carbonate Market Forecast (USD Billion), by Sub-Segment 2, 2018-2030
      Figure 97: Middle East & Africa Sodium Carbonate Market Forecast (USD Billion), by Sub-Segment 3, 2018-2030
      Figure 98: Middle East & Africa Sodium Carbonate Market Forecast (USD Billion), by Others, 2018-2030
      Figure 99: Middle East & Africa Sodium Carbonate Market Forecast (USD Billion), by GCC, 2018-2030
      Figure 100: Middle East & Africa Sodium Carbonate Market Forecast (USD Billion), by South Africa, 2018-2030
      Figure 101: Middle East & Africa Sodium Carbonate Market Forecast (USD Billion), by Rest of Middle East & Africa, 2018-2030 
      List of Tables
      Table 1: Global Sodium Carbonate Market Revenue (USD Billion) Forecast, by Segment 1, 2018-2030
      Table 2: Global Sodium Carbonate Market Revenue (USD Billion) Forecast, by Segment 2, 2018-2030
      Table 3: Global Sodium Carbonate Market Revenue (USD Billion) Forecast, by Segment 3, 2018-2030
      Table 4: Global Sodium Carbonate Market Revenue (USD Billion) Forecast, by Region, 2018-2030
      Table 5: North America Sodium Carbonate Market Revenue (USD Billion) Forecast, by Segment 1, 2018-2030
      Table 6: North America Sodium Carbonate Market Revenue (USD Billion) Forecast, by Segment 2, 2018-2030
      Table 7: North America Sodium Carbonate Market Revenue (USD Billion) Forecast, by Segment 3, 2018-2030
      Table 8: North America Sodium Carbonate Market Revenue (USD Billion) Forecast, by Country, 2018-2030
      Table 9: Europe Sodium Carbonate Market Revenue (USD Billion) Forecast, by Segment 1, 2018-2030
      Table 10: Europe Sodium Carbonate Market Revenue (USD Billion) Forecast, by Segment 2, 2018-2030
      Table 11: Europe Sodium Carbonate Market Revenue (USD Billion) Forecast, by Segment 3, 2018-2030
      Table 12: Europe Sodium Carbonate Market Revenue (USD Billion) Forecast, by Country, 2018-2030
      Table 13: Latin America Sodium Carbonate Market Revenue (USD Billion) Forecast, by Segment 1, 2018-2030
      Table 14: Latin America Sodium Carbonate Market Revenue (USD Billion) Forecast, by Segment 2, 2018-2030
      Table 15: Latin America Sodium Carbonate Market Revenue (USD Billion) Forecast, by Segment 3, 2018-2030
      Table 16: Latin America Sodium Carbonate Market Revenue (USD Billion) Forecast, by Country, 2018-2030
      Table 17: Asia Pacific Sodium Carbonate Market Revenue (USD Billion) Forecast, by Segment 1, 2018-2030
      Table 18: Asia Pacific Sodium Carbonate Market Revenue (USD Billion) Forecast, by Segment 2, 2018-2030
      Table 19: Asia Pacific Sodium Carbonate Market Revenue (USD Billion) Forecast, by Segment 3, 2018-2030
      Table 20: Asia Pacific Sodium Carbonate Market Revenue (USD Billion) Forecast, by Country, 2018-2030
      Table 21: Middle East & Africa Sodium Carbonate Market Revenue (USD Billion) Forecast, by Segment 1, 2018-2030
      Table 22: Middle East & Africa Sodium Carbonate Market Revenue (USD Billion) Forecast, by Segment 2, 2018-2030
      Table 23: Middle East & Africa Sodium Carbonate Market Revenue (USD Billion) Forecast, by Segment 3, 2018-2030
      Table 24: Middle East & Africa Sodium Carbonate Market Revenue (USD Billion) Forecast, by Country, 2018-2030
      Research Process

      Data Library Research are conducted by industry experts who offer insight on industry structure, market segmentations technology assessment and competitive landscape (CL), and penetration, as well as on emerging trends. Their analysis is based on primary interviews (~ 80%) and secondary research (~ 20%) as well as years of professional expertise in their respective industries. Adding to this, by analysing historical trends and current market positions, our analysts predict where the market will be headed for the next five years. Furthermore, the varying trends of segment & categories geographically presented are also studied and the estimated based on the primary & secondary research.

      In this particular report from the supply side Data Library Research has conducted primary surveys (interviews) with the key level executives (VP, CEO’s, Marketing Director, Business Development Manager and SOFT) of the companies that active & prominent as well as the midsized organization

      FIGURE 1: DLR RESEARH PROCESS

      research-methodology1

      Primary Research

      Extensive primary research was conducted to gain a deeper insight of the market and industry performance. The analysis is based on both primary and secondary research as well as years of professional expertise in the respective industries.

      In addition to analysing current and historical trends, our analysts predict where the market is headed over the next five years.

      It varies by segment for these categories geographically presented in the list of market tables. Speaking about this particular report we have conducted primary surveys (interviews) with the key level executives (VP, CEO’s, Marketing Director, Business Development Manager and many more) of the major players active in the market.

      Secondary Research

      Secondary research was mainly used to collect and identify information useful for the extensive, technical, market-oriented, and Friend’s study of the Global Extra Neutral Alcohol. It was also used to obtain key information about major players, market classification and segmentation according to the industry trends, geographical markets, and developments related to the market and technology perspectives. For this study, analysts have gathered information from various credible sources, such as annual reports, sec filings, journals, white papers, SOFT presentations, and company web sites.

      Market Size Estimation

      Both, top-down and bottom-up approaches were used to estimate and validate the size of the Global market and to estimate the size of various other dependent submarkets in the overall Extra Neutral Alcohol. The key players in the market were identified through secondary research and their market contributions in the respective geographies were determined through primary and secondary research.

      Forecast Model

      research-methodology2

      Happy to Assist You

      If you have a question?

      info@datalibraryresearch.com

      IND : +91 955 279 0357

      Browse Related Reports