Virtual Simulation Driving Simulators Market Overview :
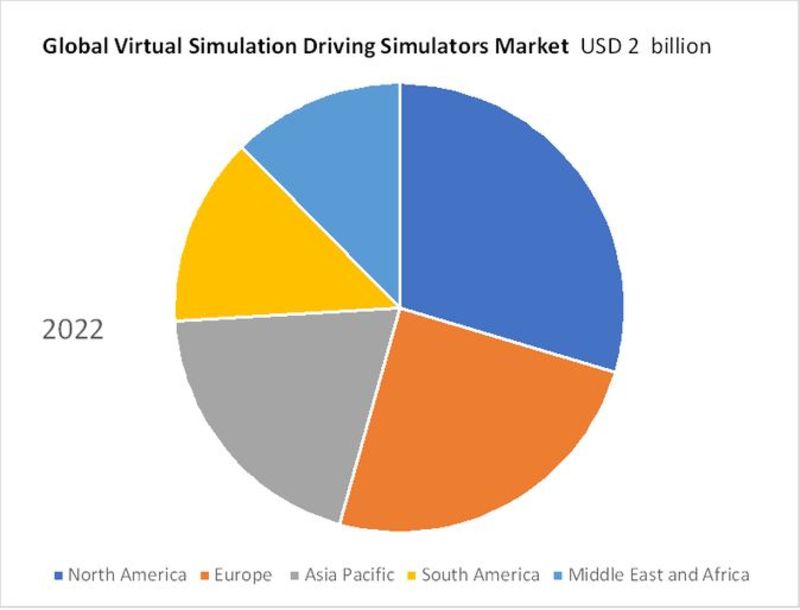
Analysis of the "Virtual Simulation Driving Simulators Market" through 2023 with respect to Types (Modular Design Simulator, Multi Station Driving Simulator, Bus Simulator, Physical Simulator, Other), Applications (Entertainment, Training Institutions, Transport Authorities, Other), Regions, and Forecast to 2030, Driving simulators for virtual environments have been experiencing steady growth. The market was estimated to be worth USD 1.5 billion in 2020, and it is anticipated to increase at a compound annual growth rate (CAGR) of over 9% from 2021 to 2028.
Driving simulators for virtual environments are computer-based programs that simulate the feeling of operating a vehicle. These simulators, which are frequently used for instruction, research, and entertainment, employ cutting-edge technologies to produce a realistic driving experience. Simulators produce a virtual environment that closely resembles actual driving conditions. The settings may include different types of roads, climatic conditions, traffic patterns, and scenery. The sophistication of the simulator will determine the degree of detail and realism. Simulators offer a variety of controls similar to those used in real automobiles. This may include a steering wheel, brake and gas pedals, gear shifters, and dashboard displays. The controls allow Users to interact with the virtual world and have a realistic driving experience.
A sizeable component of the market for virtual driving simulators is made up of businesses that provide driver training and instruction. Simulators are used by driving schools, business fleets, and public transportation firms to offer specialized training programs (such as emergency response and commercial vehicle operation), safe and effective training for new drivers, and to hone the abilities of experienced drivers.
| Report Metric |
Details |
| Market size available for years |
2023–2030 |
| Base year considered |
2023 |
| Forecast period |
2024–2030 |
| Forecast unit |
Value (USD Million) |
| CAGR |
9% |
| Reports Coverage |
Revenue Forecast, Competitive Landscape, Growth Factors and Trends |
| Segments Covered |
Type, Application, and Region |
| Regions covered |
North America (the U.S. and Canada), Europe (UK, Germany, France, Italy, Spain, Russia, Rest of Europe), Asia-Pacific (China, India, Japan, Australia, South East Asia, Rest of Asia Pacific), Latin America and the Middle East and Africa (Brazil, Saudi Arabia, UAE, Rest of LAMEA) |
| Companies covered |
ECA Group, AV Simulation,VI-Grade,L3Harris Technologies, Cruden, Zen Technologies, Ansible Motion, XPI Simulation, Virage Simulation, AB Dynamics, IPG Automotive, AutoSim, Tecknotrove System, Tianjin Zhonggong Intelligent. |
Driving Simulator Market Dynamics:
Increased Focus on Driver Safety:
With growing concerns about traffic safety, there is an increased focus on driver education and training. Driving simulators provide students with a secure and regulated environment in which to practice and improve their driving abilities. The need for efficient training tools that can improve driver safety and lower accidents is what drives the market.
Technological developments:
The market for driving simulators has been significantly impacted by technological developments. Driving simulators are becoming increasingly complex as technology advances, with realistic landscapes, cutting-edge visuals, motion platforms, and haptic feedback systems. These developments boost simulators' effectiveness and immersive experience, spurring market expansion.
Government policies and efforts:
The market for driving simulators is significantly impacted by government policies and efforts pertaining to driver training and road safety. For various sorts of driving licenses, many nations have established legislation requiring a set number of training hours or simulator-based training. The development of the market is aided by government programs, assistance for driver safety, and cutting-edge training techniques. Regional variables: Market dynamics for driving simulators might differ by location. Regional laws governing traffic safety, the state of the economy, the availability of new technologies, and cultural perceptions of driver education all have an impact on the market's expansion in a given location.
Applications in Industry: Driving simulators are used for more than just driving education. The performance of vehicles, user interfaces, and Virtual Simulation Driving Simulators are all tested and evaluated using them by car manufacturers as part of their research and development efforts. The need for simulators in research, product development, and testing applications is what is driving the market. The market for driving simulators is benefited by the expansion of racing simulations and video games in the entertainment and gaming sectors. Simulators give gamers, auto enthusiasts, and motorsport fans an immersive experience. The demand for interesting and realistic virtual driving experiences on gaming platforms has an impact on market growth.
Segmentation Analysis:
The global Virtual Simulation Driving Simulators market is segmented based on By Type, Application, and Region.
Global Virtual Simulation Driving Simulators Market Competitive Analysis:
Key players in the Global Virtual Simulation Driving Simulators market are
- ECA Group
- AV Simulation
- VI-Grade
- L3Harris Technologies
- Cruden
- Zen Technologies
- Ansible Motion
- XPI Simulation
- Virage Simulation
- AB Dynamics
- IPG Automotive
- AutoSim
- Tecknotrove System
- Tianjin Zhonggong Intelligent
- Beijing Ziguang Legacy Science and Education
- Beijing KingFar
- Fujian Couder Technology
- Shenzhen Zhongzhi Simulation
*All our reports are customizable as per customer requirements
This study forecasts revenue and volume growth at global, regional, and country levels from 2018 to 2029. Global Virtual Simulation Driving Simulators market is distributed on the basis of the below-mentioned segments:
Global Virtual Simulation Driving Simulators Market, By Type:
- Truck Simulator
- Bus Simulator
- Others
Global Virtual Simulation Driving Simulators Market, By Application:
- Testing
- Entertainment
- Education
- Others
Global Virtual Simulation Driving Simulators Market, By Region:
- North America
- Europe
- UK
- Germany
- France
- Italy
- Spain
- Rest of Europe
- Asia-Pacific
- Japan
- China
- India
- Australia
- South Korea
- Rest of Asia-Pacific
- LAMEA
- Brazil
- Saudi Arabia
- UAE
- Rest of LAMEA
List of Figures
Figure 1: Global Virtual Simulation Driving Simulators Market Revenue Breakdown (USD Billion, %) by Region, 2023 & 2029
Figure 2: Global Virtual Simulation Driving Simulators Market Value Share (%), By Segment 1, 2023 & 2029
Figure 3: Global Virtual Simulation Driving Simulators Market Forecast (USD Billion), by Sub-Segment 1, 2018-2029
Figure 4: Global Virtual Simulation Driving Simulators Market Forecast (USD Billion), by Sub-Segment 2, 2018-2029
Figure 5: Global Virtual Simulation Driving Simulators Market Value Share (%), By Segment 2, 2023 & 2029
Figure 6: Global Virtual Simulation Driving Simulators Market Forecast (USD Billion), by Sub-Segment 1, 2018-2029
Figure 7: Global Virtual Simulation Driving Simulators Market Forecast (USD Billion), by Sub-Segment 2, 2018-2029
Figure 8: Global Virtual Simulation Driving Simulators Market Forecast (USD Billion), by Sub-Segment 3, 2018-2029
Figure 9: Global Virtual Simulation Driving Simulators Market Forecast (USD Billion), by Others, 2018-2029
Figure 10: Global Virtual Simulation Driving Simulators Market Value Share (%), By Segment 3, 2023 & 2029
Figure 11: Global Virtual Simulation Driving Simulators Market Forecast (USD Billion), by Sub-Segment 1, 2018-2029
Figure 12: Global Virtual Simulation Driving Simulators Market Forecast (USD Billion), by Sub-Segment 2, 2018-2029
Figure 13: Global Virtual Simulation Driving Simulators Market Forecast (USD Billion), by Sub-Segment 3, 2018-2029
Figure 14: Global Virtual Simulation Driving Simulators Market Forecast (USD Billion), by Others, 2018-2029
Figure 15: Global Virtual Simulation Driving Simulators Market Value (USD Billion), by Region, 2023 & 2029
Figure 16: North America Virtual Simulation Driving Simulators Market Value Share (%), By Segment 1, 2023 & 2029
Figure 17: North America Virtual Simulation Driving Simulators Market Forecast (USD Billion), by Sub-Segment 1, 2018-2029
Figure 18: North America Virtual Simulation Driving Simulators Market Forecast (USD Billion), by Sub-Segment 2, 2018-2029
Figure 19: North America Virtual Simulation Driving Simulators Market Value Share (%), By Segment 2, 2023 & 2029
Figure 20: North America Virtual Simulation Driving Simulators Market Forecast (USD Billion), by Sub-Segment 1, 2018-2029
Figure 21: North America Virtual Simulation Driving Simulators Market Forecast (USD Billion), by Sub-Segment 2, 2018-2029
Figure 22: North America Virtual Simulation Driving Simulators Market Forecast (USD Billion), by Sub-Segment 3, 2018-2029
Figure 23: North America Virtual Simulation Driving Simulators Market Forecast (USD Billion), by Others, 2018-2029
Figure 24: North America Virtual Simulation Driving Simulators Market Value Share (%), By Segment 3, 2023 & 2029
Figure 25: North America Virtual Simulation Driving Simulators Market Forecast (USD Billion), by Sub-Segment 1, 2018-2029
Figure 26: North America Virtual Simulation Driving Simulators Market Forecast (USD Billion), by Sub-Segment 2, 2018-2029
Figure 27: North America Virtual Simulation Driving Simulators Market Forecast (USD Billion), by Sub-Segment 3, 2018-2029
Figure 28: North America Virtual Simulation Driving Simulators Market Forecast (USD Billion), by Others, 2018-2029
Figure 29: North America Virtual Simulation Driving Simulators Market Forecast (USD Billion), by U.S., 2018-2029
Figure 30: North America Virtual Simulation Driving Simulators Market Forecast (USD Billion), by Canada, 2018-2029
Figure 31: Latin America Virtual Simulation Driving Simulators Market Value Share (%), By Segment 1, 2023 & 2029
Figure 32: Latin America Virtual Simulation Driving Simulators Market Forecast (USD Billion), by Sub-Segment 1, 2018-2029
Figure 33: Latin America Virtual Simulation Driving Simulators Market Forecast (USD Billion), by Sub-Segment 2, 2018-2029
Figure 34: Latin America Virtual Simulation Driving Simulators Market Value Share (%), By Segment 2, 2023 & 2029
Figure 35: Latin America Virtual Simulation Driving Simulators Market Forecast (USD Billion), by Sub-Segment 1, 2018-2029
Figure 36: Latin America Virtual Simulation Driving Simulators Market Forecast (USD Billion), by Sub-Segment 2, 2018-2029
Figure 37: Latin America Virtual Simulation Driving Simulators Market Forecast (USD Billion), by Sub-Segment 3, 2018-2029
Figure 38: Latin America Virtual Simulation Driving Simulators Market Forecast (USD Billion), by Others, 2018-2029
Figure 39: Latin America Virtual Simulation Driving Simulators Market Value Share (%), By Segment 3, 2023 & 2029
Figure 40: Latin America Virtual Simulation Driving Simulators Market Forecast (USD Billion), by Sub-Segment 1, 2018-2029
Figure 41: Latin America Virtual Simulation Driving Simulators Market Forecast (USD Billion), by Sub-Segment 2, 2018-2029
Figure 42: Latin America Virtual Simulation Driving Simulators Market Forecast (USD Billion), by Sub-Segment 3, 2018-2029
Figure 43: Latin America Virtual Simulation Driving Simulators Market Forecast (USD Billion), by Others, 2018-2029
Figure 44: Latin America Virtual Simulation Driving Simulators Market Forecast (USD Billion), by Brazil, 2018-2029
Figure 45: Latin America Virtual Simulation Driving Simulators Market Forecast (USD Billion), by Mexico, 2018-2029
Figure 46: Latin America Virtual Simulation Driving Simulators Market Forecast (USD Billion), by Rest of Latin America, 2018-2029
Figure 47: Europe Virtual Simulation Driving Simulators Market Value Share (%), By Segment 1, 2023 & 2029
Figure 48: Europe Virtual Simulation Driving Simulators Market Forecast (USD Billion), by Sub-Segment 1, 2018-2029
Figure 49: Europe Virtual Simulation Driving Simulators Market Forecast (USD Billion), by Sub-Segment 2, 2018-2029
Figure 50: Europe Virtual Simulation Driving Simulators Market Value Share (%), By Segment 2, 2023 & 2029
Figure 51: Europe Virtual Simulation Driving Simulators Market Forecast (USD Billion), by Sub-Segment 1, 2018-2029
Figure 52: Europe Virtual Simulation Driving Simulators Market Forecast (USD Billion), by Sub-Segment 2, 2018-2029
Figure 53: Europe Virtual Simulation Driving Simulators Market Forecast (USD Billion), by Sub-Segment 3, 2018-2029
Figure 54: Europe Virtual Simulation Driving Simulators Market Forecast (USD Billion), by Others, 2018-2029
Figure 55: Europe Virtual Simulation Driving Simulators Market Value Share (%), By Segment 3, 2023 & 2029
Figure 56: Europe Virtual Simulation Driving Simulators Market Forecast (USD Billion), by Sub-Segment 1, 2018-2029
Figure 57: Europe Virtual Simulation Driving Simulators Market Forecast (USD Billion), by Sub-Segment 2, 2018-2029
Figure 58: Europe Virtual Simulation Driving Simulators Market Forecast (USD Billion), by Sub-Segment 3, 2018-2029
Figure 59: Europe Virtual Simulation Driving Simulators Market Forecast (USD Billion), by Others, 2018-2029
Figure 60: Europe Virtual Simulation Driving Simulators Market Forecast (USD Billion), by U.K., 2018-2029
Figure 61: Europe Virtual Simulation Driving Simulators Market Forecast (USD Billion), by Germany, 2018-2029
Figure 62: Europe Virtual Simulation Driving Simulators Market Forecast (USD Billion), by France, 2018-2029
Figure 63: Europe Virtual Simulation Driving Simulators Market Forecast (USD Billion), by Italy, 2018-2029
Figure 64: Europe Virtual Simulation Driving Simulators Market Forecast (USD Billion), by Spain, 2018-2029
Figure 65: Europe Virtual Simulation Driving Simulators Market Forecast (USD Billion), by Russia, 2018-2029
Figure 66: Europe Virtual Simulation Driving Simulators Market Forecast (USD Billion), by Rest of Europe, 2018-2029
Figure 67: Asia Pacific Virtual Simulation Driving Simulators Market Value Share (%), By Segment 1, 2023 & 2029
Figure 68: Asia Pacific Virtual Simulation Driving Simulators Market Forecast (USD Billion), by Sub-Segment 1, 2018-2029
Figure 69: Asia Pacific Virtual Simulation Driving Simulators Market Forecast (USD Billion), by Sub-Segment 2, 2018-2029
Figure 70: Asia Pacific Virtual Simulation Driving Simulators Market Value Share (%), By Segment 2, 2023 & 2029
Figure 71: Asia Pacific Virtual Simulation Driving Simulators Market Forecast (USD Billion), by Sub-Segment 1, 2018-2029
Figure 72: Asia Pacific Virtual Simulation Driving Simulators Market Forecast (USD Billion), by Sub-Segment 2, 2018-2029
Figure 73: Asia Pacific Virtual Simulation Driving Simulators Market Forecast (USD Billion), by Sub-Segment 3, 2018-2029
Figure 74: Asia Pacific Virtual Simulation Driving Simulators Market Forecast (USD Billion), by Others, 2018-2029
Figure 75: Asia Pacific Virtual Simulation Driving Simulators Market Value Share (%), By Segment 3, 2023 & 2029
Figure 76: Asia Pacific Virtual Simulation Driving Simulators Market Forecast (USD Billion), by Sub-Segment 1, 2018-2029
Figure 77: Asia Pacific Virtual Simulation Driving Simulators Market Forecast (USD Billion), by Sub-Segment 2, 2018-2029
Figure 78: Asia Pacific Virtual Simulation Driving Simulators Market Forecast (USD Billion), by Sub-Segment 3, 2018-2029
Figure 79: Asia Pacific Virtual Simulation Driving Simulators Market Forecast (USD Billion), by Others, 2018-2029
Figure 80: Asia Pacific Virtual Simulation Driving Simulators Market Forecast (USD Billion), by China, 2018-2029
Figure 81: Asia Pacific Virtual Simulation Driving Simulators Market Forecast (USD Billion), by India, 2018-2029
Figure 82: Asia Pacific Virtual Simulation Driving Simulators Market Forecast (USD Billion), by Japan, 2018-2029
Figure 83: Asia Pacific Virtual Simulation Driving Simulators Market Forecast (USD Billion), by Australia, 2018-2029
Figure 84: Asia Pacific Virtual Simulation Driving Simulators Market Forecast (USD Billion), by Southeast Asia, 2018-2029
Figure 85: Asia Pacific Virtual Simulation Driving Simulators Market Forecast (USD Billion), by Rest of Asia Pacific, 2018-2029
Figure 86: Middle East & Africa Virtual Simulation Driving Simulators Market Value Share (%), By Segment 1, 2023 & 2029
Figure 87: Middle East & Africa Virtual Simulation Driving Simulators Market Forecast (USD Billion), by Sub-Segment 1, 2018-2029
Figure 88: Middle East & Africa Virtual Simulation Driving Simulators Market Forecast (USD Billion), by Sub-Segment 2, 2018-2029
Figure 89: Middle East & Africa Virtual Simulation Driving Simulators Market Value Share (%), By Segment 2, 2023 & 2029
Figure 90: Middle East & Africa Virtual Simulation Driving Simulators Market Forecast (USD Billion), by Sub-Segment 1, 2018-2029
Figure 91: Middle East & Africa Virtual Simulation Driving Simulators Market Forecast (USD Billion), by Sub-Segment 2, 2018-2029
Figure 92: Middle East & Africa Virtual Simulation Driving Simulators Market Forecast (USD Billion), by Sub-Segment 3, 2018-2029
Figure 93: Middle East & Africa Virtual Simulation Driving Simulators Market Forecast (USD Billion), by Others, 2018-2029
Figure 94: Middle East & Africa Virtual Simulation Driving Simulators Market Value Share (%), By Segment 3, 2023 & 2029
Figure 95: Middle East & Africa Virtual Simulation Driving Simulators Market Forecast (USD Billion), by Sub-Segment 1, 2018-2029
Figure 96: Middle East & Africa Virtual Simulation Driving Simulators Market Forecast (USD Billion), by Sub-Segment 2, 2018-2029
Figure 97: Middle East & Africa Virtual Simulation Driving Simulators Market Forecast (USD Billion), by Sub-Segment 3, 2018-2029
Figure 98: Middle East & Africa Virtual Simulation Driving Simulators Market Forecast (USD Billion), by Others, 2018-2029
Figure 99: Middle East & Africa Virtual Simulation Driving Simulators Market Forecast (USD Billion), by GCC, 2018-2029
Figure 100: Middle East & Africa Virtual Simulation Driving Simulators Market Forecast (USD Billion), by South Africa, 2018-2029
Figure 101: Middle East & Africa Virtual Simulation Driving Simulators Market Forecast (USD Billion), by Rest of Middle East & Africa, 2018-2029
List of Tables
Table 1: Global Virtual Simulation Driving Simulators Market Revenue (USD Billion) Forecast, by Segment 1, 2018-2029
Table 2: Global Virtual Simulation Driving Simulators Market Revenue (USD Billion) Forecast, by Segment 2, 2018-2029
Table 3: Global Virtual Simulation Driving Simulators Market Revenue (USD Billion) Forecast, by Segment 3, 2018-2029
Table 4: Global Virtual Simulation Driving Simulators Market Revenue (USD Billion) Forecast, by Region, 2018-2029
Table 5: North America Virtual Simulation Driving Simulators Market Revenue (USD Billion) Forecast, by Segment 1, 2018-2029
Table 6: North America Virtual Simulation Driving Simulators Market Revenue (USD Billion) Forecast, by Segment 2, 2018-2029
Table 7: North America Virtual Simulation Driving Simulators Market Revenue (USD Billion) Forecast, by Segment 3, 2018-2029
Table 8: North America Virtual Simulation Driving Simulators Market Revenue (USD Billion) Forecast, by Country, 2018-2029
Table 9: Europe Virtual Simulation Driving Simulators Market Revenue (USD Billion) Forecast, by Segment 1, 2018-2029
Table 10: Europe Virtual Simulation Driving Simulators Market Revenue (USD Billion) Forecast, by Segment 2, 2018-2029
Table 11: Europe Virtual Simulation Driving Simulators Market Revenue (USD Billion) Forecast, by Segment 3, 2018-2029
Table 12: Europe Virtual Simulation Driving Simulators Market Revenue (USD Billion) Forecast, by Country, 2018-2029
Table 13: Latin America Virtual Simulation Driving Simulators Market Revenue (USD Billion) Forecast, by Segment 1, 2018-2029
Table 14: Latin America Virtual Simulation Driving Simulators Market Revenue (USD Billion) Forecast, by Segment 2, 2018-2029
Table 15: Latin America Virtual Simulation Driving Simulators Market Revenue (USD Billion) Forecast, by Segment 3, 2018-2029
Table 16: Latin America Virtual Simulation Driving Simulators Market Revenue (USD Billion) Forecast, by Country, 2018-2029
Table 17: Asia Pacific Virtual Simulation Driving Simulators Market Revenue (USD Billion) Forecast, by Segment 1, 2018-2029
Table 18: Asia Pacific Virtual Simulation Driving Simulators Market Revenue (USD Billion) Forecast, by Segment 2, 2018-2029
Table 19: Asia Pacific Virtual Simulation Driving Simulators Market Revenue (USD Billion) Forecast, by Segment 3, 2018-2029
Table 20: Asia Pacific Virtual Simulation Driving Simulators Market Revenue (USD Billion) Forecast, by Country, 2018-2029
Table 21: Middle East & Africa Virtual Simulation Driving Simulators Market Revenue (USD Billion) Forecast, by Segment 1, 2018-2029
Table 22: Middle East & Africa Virtual Simulation Driving Simulators Market Revenue (USD Billion) Forecast, by Segment 2, 2018-2029
Table 23: Middle East & Africa Virtual Simulation Driving Simulators Market Revenue (USD Billion) Forecast, by Segment 3, 2018-2029
Table 24: Middle East & Africa Virtual Simulation Driving Simulators Market Revenue (USD Billion) Forecast, by Country, 2018-2029
Research Process
Data Library Research are conducted by industry experts who offer insight on
industry structure, market segmentations technology assessment and competitive landscape (CL), and penetration, as well as on emerging trends. Their analysis is based on primary interviews (~ 80%) and secondary research (~ 20%) as well as years of professional expertise in their respective industries. Adding to this, by analysing historical trends and current market positions, our analysts predict where the market will be headed for the next five years. Furthermore, the varying trends of segment & categories geographically presented are also studied and the estimated based on the primary & secondary research.
In this particular report from the supply side Data Library Research has conducted primary surveys (interviews) with the key level executives (VP, CEO’s, Marketing Director, Business Development Manager
and SOFT) of the companies that active & prominent as well as the midsized organization
FIGURE 1: DLR RESEARH PROCESS
![research-methodology1]()
Primary Research
Extensive primary research was conducted to gain a deeper insight of the market and industry performance. The analysis is based on both primary and secondary research as well as years of professional expertise in the respective industries.
In addition to analysing current and historical trends, our analysts predict where the market is headed over the next five years.
It varies by segment for these categories geographically presented in the list of market tables. Speaking about this particular report we have conducted primary surveys (interviews) with the key level executives (VP, CEO’s, Marketing Director, Business Development Manager and many more) of the major players active in the market.
Secondary Research
Secondary research was mainly used to collect and identify information useful for the extensive, technical, market-oriented, and Friend’s study of the Global Extra Neutral Alcohol. It was also used to obtain key information about major players, market classification and segmentation according to the industry trends, geographical markets, and developments related to the market and technology perspectives. For this study, analysts have gathered information from various credible sources, such as annual reports, sec filings, journals, white papers, SOFT presentations, and company web sites.
Market Size Estimation
Both, top-down and bottom-up approaches were used to estimate and validate the size of the Global market and to estimate the size of various other dependent submarkets in the overall Extra Neutral Alcohol. The key players in the market were identified through secondary research and their market contributions in the respective geographies were determined through primary and secondary research.
Forecast Model
![research-methodology2]()