3D Metrology Market Overview
3D metrology is the scientific study of physical measurement. However, in looser terms, it's often referred to as the general field of precision measurement within the industry. In its basic form, applying 3D metrology is very accurately acquiring an object's geometrical data in 3 axes (x, y, z). The rising adoption of 3D metrology equipment by several industries such as aerospace, automotive, construction and engineering, energy and power, and heavy machinery to maintain the quality of the product is the prime factor that escalates the growth of the 3D Metrology market.
Furthermore, the growing demand for industry 4.0 plays an important role in the market development. Industry 4.0 focuses on digitizing the physical assets and their integration into digital ecosystems with several value chain members. In addition, notable developments in software-driven process automation and portable metrology equipment for customized services have also intensified the growth of the 3D Metrology market. Moreover, other key aspects such as increased R&D spending on 3D metrology, focus on quality control while manufacturing goods, and demand for higher productivity by electronics manufacturing services companies are majorly contributes to the market’s expansion to a large extent. In addition, the growing adoption of cloud computing services is anticipated to offer various growth opportunities to players in the 3D metrology market.
On the downside, the high cost is incurred in maintaining and regulating 3D metrology tools, metrology software, and software updates, and hiring metrologists, and providing regular training. Hence, the high cost associated with setting up a 3D metrology facility is the major factor that restrains the growth of the global 3D Metrology market.
| Report Metric |
Details |
| Market size available for years |
2023–2030 |
| Base year considered |
2023 |
| Forecast period |
2024–2030 |
| Forecast unit |
Value (USD Million) |
| Segments covered |
Offering, Product Type, Application, End-user Industry, and Region |
| Regions covered |
North America (the U.S. and Canada), Europe (UK, Germany, France, Italy, Spain, Russia, Rest of Europe), Asia-Pacific (China, India, Japan, Australia, South East Asia, Rest of Asia Pacific), Latin America and the Middle East and Africa (Brazil, Saudi Arabia, UAE, Rest of LAMEA) |
| Companies covered |
Hexagon, FARO Technologies, KEYENCE Corp., Jenoptik, Nikon Corp., Mitutoyo Corp., ZEISS Group, KLA Corp., Perceptron, Renishaw, Creaform, Baker Hughes Company, CyberOptics Corp., Trimble, Inc., 3D Systems, Inc., Automated Precision, Inc., Metrologic Group. |
Covid-19 Impact on 3D Metrology Market
Like many other industries, COVID-19 badly knocked the electronic and semiconductor industries. This unprecedented event has impacted nearly 230 countries in just a few weeks, resulting in the forced shutdown of manufacturing and transportation activities within and across the countries. This has directly affected the overall sector's growth. It is estimated that COVID-19 to leave more than USD 30 billion impacts on the electronics and semiconductor industry. The sector is majorly affected due to transport restrictions on major electronics and semiconductor raw material providers. However, the emerging need for semiconductors in several industries will offer rapid market recovery over the future period.
3D Metrology Market Segment Overview
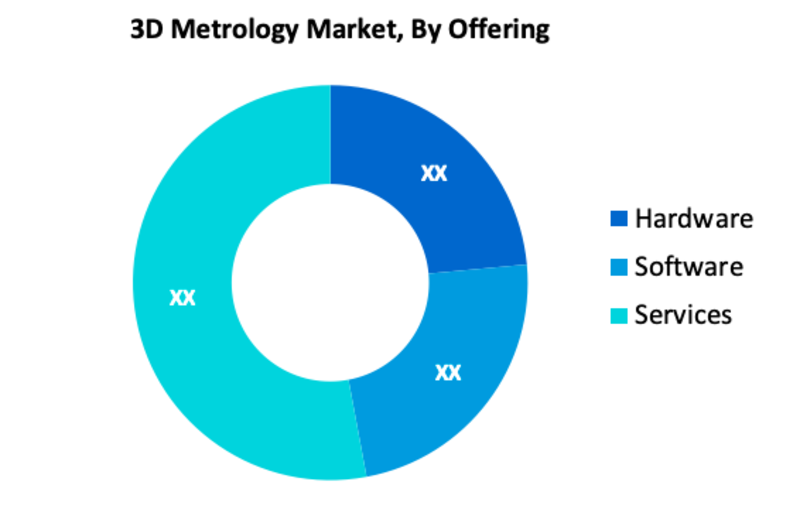
Based on Offering, the Services segment is expected to hold the largest share in the global 3D Metrology market in the forecast period. The high cost acquired in setting up a 3D metrology facility and the lack of 3D metrology experts are the key aspects for the growth of the 3D metrology services segment. In addition to this, manufacturing companies are outsourcing their 3D metrology measurement and inspection work to service providers to achieve short measuring times, reduced measurement uncertainty, and process stability, this key factor propels the growth of the 3D metrology services segment. According to End-user Industry, the Automotive industry is the largest segment in the market. 3D metrology is used in the automotive industry in the initial stages of the design, production, and installation of single components and finished products, and the installation of automated production lines.
3D Metrology Market, By Offering
· Hardware
· Software
· Services
3D Metrology Market, By Product Type
· Coordinate measuring machine (CMM)
· Optical digitizer and scanner (ODS)
· Form Measurement Equipment
· Video Measuring Machine (VMM)
· 3D Automated Optical Inspection System (AOI)
· Others
3D Metrology Market, By Application
· Quality Control and Inspection
· Reverse Engineering
· Virtual Simulation
· Others
3D Metrology Market, By End-user Industry
· Aerospace & Defense
· Automotive
· Architecture and Construction
· Medical
· Semiconductor and Electronics
· Energy and Power
· Heavy Machinery
· Mining
· Others
3D Metrology Market Regional Overview
In terms of region, North America dominated the global 3D Metrology market. The strong presence of aerospace, automotive, and pharmaceutical equipment manufacturers in the U.S. and rapid automation of the automotive manufacturing facilities, are noteworthy factors that boost the growth of the market in this region. Similarly, the market in the Asia Pacific is expected to witness significant growth in the forecast period. This is because of the presence of booming industrial economies such as China, India, and Japan. In addition to this, The Asia Pacific region is the manufacturing hub for most industrial products. 3D metrology is used in different industrial and power generation applications, such as forging inspection, raw casting, die, and mold design, as well as to inspect power generation components. All these crucial factors escalating the growth of the market in this region.
3D Metrology Market, By Geography
· North America (US & Canada)
· Europe (UK, Germany, France, Italy, Spain, Russia & Rest of Europe)
· Asia-Pacific (Japan, China, India, Australia, & South Korea, & Rest of Asia-Pacific)
· LAMEA (Brazil, Saudi Arabia, UAE & Rest of LAMEA)
3D Metrology Market, Key Players
· Hexagon
· FARO Technologies
· KEYENCE Corp.
· Jenoptik
· Nikon Corp.
· Mitutoyo Corp.
· ZEISS Group
· KLA Corp.
· Perceptron
· Renishaw
· Creaform
· Baker Hughes Company
· CyberOptics Corp.
· Trimble, Inc.
· 3D Systems, Inc.
· Automated Precision, Inc.
· Metrologic Group
Frequently Asked Questions (FAQ) :
Q1. What is the total CAGR expected to be recorded for the 3D Metrology market during the forecast period?
The 3D Metrology market is expected to record a CAGR of ~ 7 % during the forecast period.
Q2. Which segment is projected to hold the largest share in the 3D Metrology Market. ?
The Services segment is projected to hold the largest share in the 3D Metrology Market.
Q3. What are the driving factors for the 3D Metrology market?
The increased R&D spending on 3D metrology, focus on quality control while manufacturing goods, and demand for higher productivity by electronics manufacturing services, growing demand for industry 4.0, and growing adoption of cloud computing services are significant factors that boost the growth of the 3D Metrology market.
Q4. What are the restraining factors for the 3D Metrology market?
The high cost associated with setting up a 3D metrology facility is the major factor that restrains the growth of the global 3D Metrology market.
Q5. Which are the prominent players offering 3D Metrology?
Hexagon, FARO Technologies, KEYENCE Corp., Jenoptik, Nikon Corp., Mitutoyo Corp., ZEISS Group, KLA Corp., Perceptron, Renishaw, Creaform, Baker Hughes Company, CyberOptics Corp., Trimble, Inc., 3D Systems, Inc., Automated Precision, Inc., Metrologic Group. are some of the key players offering 3D Metrology.
List of Figures
Figure 1: Global 3D Metrology Market Revenue Breakdown (USD Billion, %) by Region, 2019 & 2027
Figure 2: Global 3D Metrology Market Value Share (%), By Segment 1, 2019 & 2027
Figure 3: Global 3D Metrology Market Forecast (USD Billion), by Sub-Segment 1, 2016-2027
Figure 4: Global 3D Metrology Market Forecast (USD Billion), by Sub-Segment 2, 2016-2027
Figure 5: Global 3D Metrology Market Value Share (%), By Segment 2, 2019 & 2027
Figure 6: Global 3D Metrology Market Forecast (USD Billion), by Sub-Segment 1, 2016-2027
Figure 7: Global 3D Metrology Market Forecast (USD Billion), by Sub-Segment 2, 2016-2027
Figure 8: Global 3D Metrology Market Forecast (USD Billion), by Sub-Segment 3, 2016-2027
Figure 9: Global 3D Metrology Market Forecast (USD Billion), by Others, 2016-2027
Figure 10: Global 3D Metrology Market Value Share (%), By Segment 3, 2019 & 2027
Figure 11: Global 3D Metrology Market Forecast (USD Billion), by Sub-Segment 1, 2016-2027
Figure 12: Global 3D Metrology Market Forecast (USD Billion), by Sub-Segment 2, 2016-2027
Figure 13: Global 3D Metrology Market Forecast (USD Billion), by Sub-Segment 3, 2016-2027
Figure 14: Global 3D Metrology Market Forecast (USD Billion), by Others, 2016-2027
Figure 15: Global 3D Metrology Market Value (USD Billion), by Region, 2019 & 2027
Figure 16: North America 3D Metrology Market Value Share (%), By Segment 1, 2019 & 2027
Figure 17: North America 3D Metrology Market Forecast (USD Billion), by Sub-Segment 1, 2016-2027
Figure 18: North America 3D Metrology Market Forecast (USD Billion), by Sub-Segment 2, 2016-2027
Figure 19: North America 3D Metrology Market Value Share (%), By Segment 2, 2019 & 2027
Figure 20: North America 3D Metrology Market Forecast (USD Billion), by Sub-Segment 1, 2016-2027
Figure 21: North America 3D Metrology Market Forecast (USD Billion), by Sub-Segment 2, 2016-2027
Figure 22: North America 3D Metrology Market Forecast (USD Billion), by Sub-Segment 3, 2016-2027
Figure 23: North America 3D Metrology Market Forecast (USD Billion), by Others, 2016-2027
Figure 24: North America 3D Metrology Market Value Share (%), By Segment 3, 2019 & 2027
Figure 25: North America 3D Metrology Market Forecast (USD Billion), by Sub-Segment 1, 2016-2027
Figure 26: North America 3D Metrology Market Forecast (USD Billion), by Sub-Segment 2, 2016-2027
Figure 27: North America 3D Metrology Market Forecast (USD Billion), by Sub-Segment 3, 2016-2027
Figure 28: North America 3D Metrology Market Forecast (USD Billion), by Others, 2016-2027
Figure 29: North America 3D Metrology Market Forecast (USD Billion), by U.S., 2016-2027
Figure 30: North America 3D Metrology Market Forecast (USD Billion), by Canada, 2016-2027
Figure 31: Latin America 3D Metrology Market Value Share (%), By Segment 1, 2019 & 2027
Figure 32: Latin America 3D Metrology Market Forecast (USD Billion), by Sub-Segment 1, 2016-2027
Figure 33: Latin America 3D Metrology Market Forecast (USD Billion), by Sub-Segment 2, 2016-2027
Figure 34: Latin America 3D Metrology Market Value Share (%), By Segment 2, 2019 & 2027
Figure 35: Latin America 3D Metrology Market Forecast (USD Billion), by Sub-Segment 1, 2016-2027
Figure 36: Latin America 3D Metrology Market Forecast (USD Billion), by Sub-Segment 2, 2016-2027
Figure 37: Latin America 3D Metrology Market Forecast (USD Billion), by Sub-Segment 3, 2016-2027
Figure 38: Latin America 3D Metrology Market Forecast (USD Billion), by Others, 2016-2027
Figure 39: Latin America 3D Metrology Market Value Share (%), By Segment 3, 2019 & 2027
Figure 40: Latin America 3D Metrology Market Forecast (USD Billion), by Sub-Segment 1, 2016-2027
Figure 41: Latin America 3D Metrology Market Forecast (USD Billion), by Sub-Segment 2, 2016-2027
Figure 42: Latin America 3D Metrology Market Forecast (USD Billion), by Sub-Segment 3, 2016-2027
Figure 43: Latin America 3D Metrology Market Forecast (USD Billion), by Others, 2016-2027
Figure 44: Latin America 3D Metrology Market Forecast (USD Billion), by Brazil, 2016-2027
Figure 45: Latin America 3D Metrology Market Forecast (USD Billion), by Mexico, 2016-2027
Figure 46: Latin America 3D Metrology Market Forecast (USD Billion), by Rest of Latin America, 2016-2027
Figure 47: Europe 3D Metrology Market Value Share (%), By Segment 1, 2019 & 2027
Figure 48: Europe 3D Metrology Market Forecast (USD Billion), by Sub-Segment 1, 2016-2027
Figure 49: Europe 3D Metrology Market Forecast (USD Billion), by Sub-Segment 2, 2016-2027
Figure 50: Europe 3D Metrology Market Value Share (%), By Segment 2, 2019 & 2027
Figure 51: Europe 3D Metrology Market Forecast (USD Billion), by Sub-Segment 1, 2016-2027
Figure 52: Europe 3D Metrology Market Forecast (USD Billion), by Sub-Segment 2, 2016-2027
Figure 53: Europe 3D Metrology Market Forecast (USD Billion), by Sub-Segment 3, 2016-2027
Figure 54: Europe 3D Metrology Market Forecast (USD Billion), by Others, 2016-2027
Figure 55: Europe 3D Metrology Market Value Share (%), By Segment 3, 2019 & 2027
Figure 56: Europe 3D Metrology Market Forecast (USD Billion), by Sub-Segment 1, 2016-2027
Figure 57: Europe 3D Metrology Market Forecast (USD Billion), by Sub-Segment 2, 2016-2027
Figure 58: Europe 3D Metrology Market Forecast (USD Billion), by Sub-Segment 3, 2016-2027
Figure 59: Europe 3D Metrology Market Forecast (USD Billion), by Others, 2016-2027
Figure 60: Europe 3D Metrology Market Forecast (USD Billion), by U.K., 2016-2027
Figure 61: Europe 3D Metrology Market Forecast (USD Billion), by Germany, 2016-2027
Figure 62: Europe 3D Metrology Market Forecast (USD Billion), by France, 2016-2027
Figure 63: Europe 3D Metrology Market Forecast (USD Billion), by Italy, 2016-2027
Figure 64: Europe 3D Metrology Market Forecast (USD Billion), by Spain, 2016-2027
Figure 65: Europe 3D Metrology Market Forecast (USD Billion), by Russia, 2016-2027
Figure 66: Europe 3D Metrology Market Forecast (USD Billion), by Rest of Europe, 2016-2027
Figure 67: Asia Pacific 3D Metrology Market Value Share (%), By Segment 1, 2019 & 2027
Figure 68: Asia Pacific 3D Metrology Market Forecast (USD Billion), by Sub-Segment 1, 2016-2027
Figure 69: Asia Pacific 3D Metrology Market Forecast (USD Billion), by Sub-Segment 2, 2016-2027
Figure 70: Asia Pacific 3D Metrology Market Value Share (%), By Segment 2, 2019 & 2027
Figure 71: Asia Pacific 3D Metrology Market Forecast (USD Billion), by Sub-Segment 1, 2016-2027
Figure 72: Asia Pacific 3D Metrology Market Forecast (USD Billion), by Sub-Segment 2, 2016-2027
Figure 73: Asia Pacific 3D Metrology Market Forecast (USD Billion), by Sub-Segment 3, 2016-2027
Figure 74: Asia Pacific 3D Metrology Market Forecast (USD Billion), by Others, 2016-2027
Figure 75: Asia Pacific 3D Metrology Market Value Share (%), By Segment 3, 2019 & 2027
Figure 76: Asia Pacific 3D Metrology Market Forecast (USD Billion), by Sub-Segment 1, 2016-2027
Figure 77: Asia Pacific 3D Metrology Market Forecast (USD Billion), by Sub-Segment 2, 2016-2027
Figure 78: Asia Pacific 3D Metrology Market Forecast (USD Billion), by Sub-Segment 3, 2016-2027
Figure 79: Asia Pacific 3D Metrology Market Forecast (USD Billion), by Others, 2016-2027
Figure 80: Asia Pacific 3D Metrology Market Forecast (USD Billion), by China, 2016-2027
Figure 81: Asia Pacific 3D Metrology Market Forecast (USD Billion), by India, 2016-2027
Figure 82: Asia Pacific 3D Metrology Market Forecast (USD Billion), by Japan, 2016-2027
Figure 83: Asia Pacific 3D Metrology Market Forecast (USD Billion), by Australia, 2016-2027
Figure 84: Asia Pacific 3D Metrology Market Forecast (USD Billion), by Southeast Asia, 2016-2027
Figure 85: Asia Pacific 3D Metrology Market Forecast (USD Billion), by Rest of Asia Pacific, 2016-2027
Figure 86: Middle East & Africa 3D Metrology Market Value Share (%), By Segment 1, 2019 & 2027
Figure 87: Middle East & Africa 3D Metrology Market Forecast (USD Billion), by Sub-Segment 1, 2016-2027
Figure 88: Middle East & Africa 3D Metrology Market Forecast (USD Billion), by Sub-Segment 2, 2016-2027
Figure 89: Middle East & Africa 3D Metrology Market Value Share (%), By Segment 2, 2019 & 2027
Figure 90: Middle East & Africa 3D Metrology Market Forecast (USD Billion), by Sub-Segment 1, 2016-2027
Figure 91: Middle East & Africa 3D Metrology Market Forecast (USD Billion), by Sub-Segment 2, 2016-2027
Figure 92: Middle East & Africa 3D Metrology Market Forecast (USD Billion), by Sub-Segment 3, 2016-2027
Figure 93: Middle East & Africa 3D Metrology Market Forecast (USD Billion), by Others, 2016-2027
Figure 94: Middle East & Africa 3D Metrology Market Value Share (%), By Segment 3, 2019 & 2027
Figure 95: Middle East & Africa 3D Metrology Market Forecast (USD Billion), by Sub-Segment 1, 2016-2027
Figure 96: Middle East & Africa 3D Metrology Market Forecast (USD Billion), by Sub-Segment 2, 2016-2027
Figure 97: Middle East & Africa 3D Metrology Market Forecast (USD Billion), by Sub-Segment 3, 2016-2027
Figure 98: Middle East & Africa 3D Metrology Market Forecast (USD Billion), by Others, 2016-2027
Figure 99: Middle East & Africa 3D Metrology Market Forecast (USD Billion), by GCC, 2016-2027
Figure 100: Middle East & Africa 3D Metrology Market Forecast (USD Billion), by South Africa, 2016-2027
Figure 101: Middle East & Africa 3D Metrology Market Forecast (USD Billion), by Rest of Middle East & Africa, 2016-2027
List of Tables
Table 1: Global 3D Metrology Market Revenue (USD Billion) Forecast, by Segment 1, 2016-2027
Table 2: Global 3D Metrology Market Revenue (USD Billion) Forecast, by Segment 2, 2016-2027
Table 3: Global 3D Metrology Market Revenue (USD Billion) Forecast, by Segment 3, 2016-2027
Table 4: Global 3D Metrology Market Revenue (USD Billion) Forecast, by Region, 2016-2027
Table 5: North America 3D Metrology Market Revenue (USD Billion) Forecast, by Segment 1, 2016-2027
Table 6: North America 3D Metrology Market Revenue (USD Billion) Forecast, by Segment 2, 2016-2027
Table 7: North America 3D Metrology Market Revenue (USD Billion) Forecast, by Segment 3, 2016-2027
Table 8: North America 3D Metrology Market Revenue (USD Billion) Forecast, by Country, 2016-2027
Table 9: Europe 3D Metrology Market Revenue (USD Billion) Forecast, by Segment 1, 2016-2027
Table 10: Europe 3D Metrology Market Revenue (USD Billion) Forecast, by Segment 2, 2016-2027
Table 11: Europe 3D Metrology Market Revenue (USD Billion) Forecast, by Segment 3, 2016-2027
Table 12: Europe 3D Metrology Market Revenue (USD Billion) Forecast, by Country, 2016-2027
Table 13: Latin America 3D Metrology Market Revenue (USD Billion) Forecast, by Segment 1, 2016-2027
Table 14: Latin America 3D Metrology Market Revenue (USD Billion) Forecast, by Segment 2, 2016-2027
Table 15: Latin America 3D Metrology Market Revenue (USD Billion) Forecast, by Segment 3, 2016-2027
Table 16: Latin America 3D Metrology Market Revenue (USD Billion) Forecast, by Country, 2016-2027
Table 17: Asia Pacific 3D Metrology Market Revenue (USD Billion) Forecast, by Segment 1, 2016-2027
Table 18: Asia Pacific 3D Metrology Market Revenue (USD Billion) Forecast, by Segment 2, 2016-2027
Table 19: Asia Pacific 3D Metrology Market Revenue (USD Billion) Forecast, by Segment 3, 2016-2027
Table 20: Asia Pacific 3D Metrology Market Revenue (USD Billion) Forecast, by Country, 2016-2027
Table 21: Middle East & Africa 3D Metrology Market Revenue (USD Billion) Forecast, by Segment 1, 2016-2027
Table 22: Middle East & Africa 3D Metrology Market Revenue (USD Billion) Forecast, by Segment 2, 2016-2027
Table 23: Middle East & Africa 3D Metrology Market Revenue (USD Billion) Forecast, by Segment 3, 2016-2027
Table 24: Middle East & Africa 3D Metrology Market Revenue (USD Billion) Forecast, by Country, 2016-2027
Research Process
Data Library Research are conducted by industry experts who offer insight on
industry structure, market segmentations technology assessment and competitive landscape (CL), and penetration, as well as on emerging trends. Their analysis is based on primary interviews (~ 80%) and secondary research (~ 20%) as well as years of professional expertise in their respective industries. Adding to this, by analysing historical trends and current market positions, our analysts predict where the market will be headed for the next five years. Furthermore, the varying trends of segment & categories geographically presented are also studied and the estimated based on the primary & secondary research.
In this particular report from the supply side Data Library Research has conducted primary surveys (interviews) with the key level executives (VP, CEO’s, Marketing Director, Business Development Manager
and SOFT) of the companies that active & prominent as well as the midsized organization
FIGURE 1: DLR RESEARH PROCESS
![research-methodology1]()
Primary Research
Extensive primary research was conducted to gain a deeper insight of the market and industry performance. The analysis is based on both primary and secondary research as well as years of professional expertise in the respective industries.
In addition to analysing current and historical trends, our analysts predict where the market is headed over the next five years.
It varies by segment for these categories geographically presented in the list of market tables. Speaking about this particular report we have conducted primary surveys (interviews) with the key level executives (VP, CEO’s, Marketing Director, Business Development Manager and many more) of the major players active in the market.
Secondary Research
Secondary research was mainly used to collect and identify information useful for the extensive, technical, market-oriented, and Friend’s study of the Global Extra Neutral Alcohol. It was also used to obtain key information about major players, market classification and segmentation according to the industry trends, geographical markets, and developments related to the market and technology perspectives. For this study, analysts have gathered information from various credible sources, such as annual reports, sec filings, journals, white papers, SOFT presentations, and company web sites.
Market Size Estimation
Both, top-down and bottom-up approaches were used to estimate and validate the size of the Global market and to estimate the size of various other dependent submarkets in the overall Extra Neutral Alcohol. The key players in the market were identified through secondary research and their market contributions in the respective geographies were determined through primary and secondary research.
Forecast Model
![research-methodology2]()