Get Complete Analysis Of The Report - Download Updated Free Sample PDF
The niche 3D SLC segment is specifically forecasted for robust expansion due to its superior performance in mission-critical, low-latency applications. The growth of the Global 3D SLC NAND Flash Market is primarily driven by the increasing demand for high-performance, reliable, and durable memory solutions across consumer electronics, data centers, automotive, and industrial applications. 3D SLC NAND flash offers faster read/write speeds, higher endurance, and superior data retention compared to multi-level cell (MLC) and triple-level cell (TLC) NAND, making it ideal for mission-critical and enterprise-grade storage solutions.
The Global 3D SLC NAND Flash Market is witnessing several key trends driven by technological innovation and increasing demand for high-performance storage solutions. There is a growing focus on higher-density 3D SLC architectures, which improve storage capacity while maintaining speed and endurance. Adoption of advanced packaging techniques, such as 3D stacking and chip-on-wafer technologies, is enhancing performance and form factor efficiency for consumer electronics, data centers, and automotive applications. Additionally, the market is seeing increased integration of SLC NAND in industrial IoT, AI, and edge computing devices, where reliability, low latency, and long lifespan are critical.
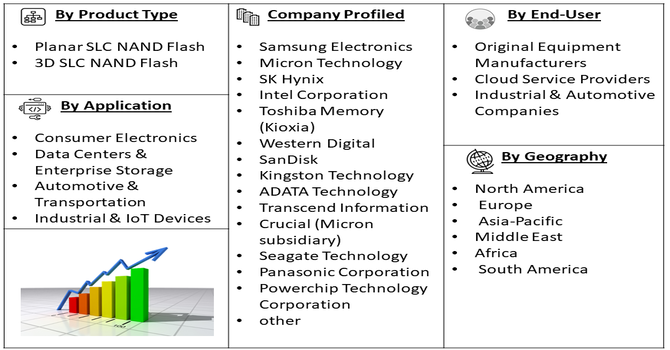
Segmentation: Global 3D SLC NAND Flash Market is segmented By Type (Planar SLC NAND Flash, 3D SLC NAND Flash), Application (Consumer Electronics, Data Centers & Enterprise Storage, Automotive & Transportation, Industrial & IoT Devices), End-User (Original Equipment Manufacturers, Cloud Service Providers, Industrial & Automotive Companies), and Geography (North America, Europe, Asia-Pacific, Middle East and Africa, and South America). The report provides the value (in USD million) for the above segments.
For Detailed Market Segmentation - Get a Free Sample PDF
Market Drivers:
The growing need for fast, durable, and reliable memory solutions across consumer electronics, enterprise systems, and industrial applications is a major driver for 3D SLC NAND flash. Compared to multi-level cell (MLC) and triple-level cell (TLC) NAND, SLC NAND offers higher write/erase cycles, lower latency, and superior data retention, making it ideal for mission-critical applications such as data centers, automotive systems, and industrial IoT devices. Rising adoption of high-performance computing, AI, and cloud services is fueling the need for robust storage solutions that can withstand heavy workloads and frequent data access.
The proliferation of smartphones, tablets, laptops, wearables, and IoT devices is driving the demand for 3D SLC NAND flash. These devices require compact, high-speed, and energy-efficient storage solutions to support applications like multimedia streaming, real-time data processing, and secure data storage. Additionally, the rise of connected devices in smart homes, industrial IoT, and automotive systems further increases the need for reliable SLC NAND flash, as these applications demand high endurance, consistent performance, and low power consumption, reinforcing market growth globally.
Market Restraints:
A significant restraint for the market is the higher cost of 3D SLC NAND flash compared to MLC, TLC, and QLC NAND technologies. The single-level cell architecture, while offering superior speed, endurance, and reliability, involves complex manufacturing processes and lower storage density per chip, which increases production costs. This price factor limits adoption in cost-sensitive applications, particularly in consumer electronics and large-scale storage deployments where lower-cost alternatives may be preferred, thereby restraining overall market growth.
The global 3D SLC NAND flash market has had significant socioeconomic impacts by driving advancements in data storage, computing, and electronic device performance. High-speed, reliable memory solutions have enabled innovation across industries such as smartphones, consumer electronics, automotive, and cloud computing, supporting economic growth and technological development. The market has generated employment opportunities in semiconductor manufacturing, R&D, and supply chain management, while fostering investment in cutting-edge fabrication facilities and high-tech infrastructure. Enhanced data storage efficiency has improved business productivity, reduced operational costs, and supported digital transformation initiatives worldwide. Additionally, widespread adoption of 3D SLC NAND flash has facilitated education, healthcare, and communication technologies, improving quality of life, bridging digital divides, and contributing to broader socioeconomic progress.
Segmental Analysis:
The Global 3D SLC NAND Flash segment is expected to witness the highest growth over the forecast period, driven by the increasing demand for high-performance, reliable, and durable storage solutions across consumer electronics, data centers, industrial applications, and automotive systems. 3D SLC NAND flash offers faster read/write speeds, superior endurance, and enhanced data retention compared to multi-level cell (MLC) and triple-level cell (TLC) NAND, making it ideal for mission-critical applications. Additionally, the growing adoption of IoT devices, AI-driven systems, edge computing, and cloud services is fueling strong demand, further accelerating the segment’s expansion globally.
3D SLC NAND flash is increasingly preferred due to its high endurance, faster read/write speeds, and superior reliability compared to planar SLC NAND. Its three-dimensional architecture allows for higher storage density and improved performance, making it suitable for mission-critical applications such as enterprise storage, industrial automation, and automotive electronics. The architecture also supports longer data retention and better resistance to wear, which is essential for high-performance computing and applications requiring frequent write cycles.
The data centers and enterprise storage segment is a major driver for 3D SLC NAND flash adoption. Growing demand for cloud computing, big data analytics, and AI-driven applications necessitates storage solutions that are highly reliable, low-latency, and capable of handling heavy workloads. 3D SLC NAND flash meets these requirements by providing consistent performance and a longer lifespan, making it ideal for enterprise-grade servers, storage arrays, and high-traffic data centers.
Original equipment manufacturers are key end-users of 3D SLC NAND flash, integrating it into consumer electronics, industrial systems, automotive applications, and networking devices. OEMs prioritize components that offer high speed, durability, and low failure rates, ensuring product quality and customer satisfaction. The demand from OEMs is further driven by rapid technological advancements and the need for reliable embedded memory solutions in smart devices, IoT systems, and automotive electronics.
North America is expected to lead the 3D SLC NAND flash market due to high adoption of advanced technologies, established semiconductor manufacturing infrastructure, and strong demand for cloud and enterprise storage solutions.
The presence of major technology companies, coupled with increased investment in AI, IoT, and edge computing applications, drives the adoption of high-performance SLC NAND flash. For instance, February 2025 demonstration by Kioxia and SanDisk showcased a high-speed memory interface using a 332-layer die. The demonstration featured the 4.8 Gb/s Toggle DDR 6.0 standard. This collaboration is designed to quickly develop and bring to market high-bandwidth flash solutions, specifically intended to enhance data transfer speeds required by modern AI accelerators and machine learning applications. Regulatory support and consumer preference for reliable, high-speed memory solutions further reinforce the region’s dominance in the global market.
Thus, the 3D SLC NAND flash market is poised for robust growth, driven by technological advancements, increasing demand for high-speed, reliable storage, and expanding applications across consumer electronics, cloud computing, and enterprise solutions. Continued innovation, investment in manufacturing capacity, and strategic collaborations are expected to sustain market momentum globally.
| Report Matrics | Details |
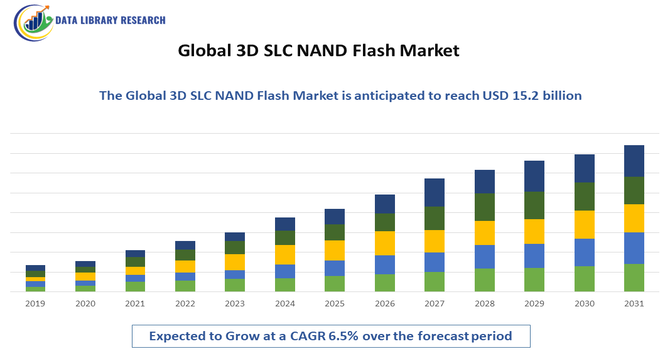
| Market Size Value | USD 15.2 billion |
| Growth Rate | CAGR of 6.5 % |
| Forecast | 2026-2033 |
| Historical data | 2021-2024 |
| Base Year | 2025 |
| Report Coverage | Forecasted revenue, company rating, competitive environment, growth drivers, and trends |
| Segment Coverage | Type, Application, End-User, Geography |
| Regional Scope | North America, Europe, Asia Pacific, Middle East |
| Customized scope | Free customization of reports (With 3 months' analysis support) |
| To Learn More About This Report | Request a Free Sample Copy |
The competitive landscape of the Global 3D SLC NAND Flash Market is characterized by the presence of leading semiconductor manufacturers and memory solution providers focusing on high-performance, durable, and reliable storage products. Companies compete on technological innovation, storage density, read/write speeds, and product reliability, while also emphasizing strategic partnerships, R&D investments, and expansion into emerging applications such as automotive electronics, IoT, and data centers. The market is moderately consolidated, with several global players dominating production and supply chains. Companies are also leveraging advanced 3D stacking technologies and energy-efficient designs to strengthen their market position.
Key Players:
Recent News
Q1. What are the main growth-driving factors for this market?
The market is driven by the explosive growth of data centers, cloud computing, and the proliferation of IoT devices requiring high-speed, reliable storage. 3D SLC (Single-Level Cell) is preferred for its superior endurance, longevity, and high-performance, which are critical for enterprise and industrial applications where data integrity is paramount.
Q2. What are the main restraining factors for this market?
A significant restraint is the high manufacturing cost of SLC compared to other NAND types like TLC and QLC, making it less economical for general consumer products. Additionally, global supply chain vulnerabilities, coupled with volatile raw material pricing and geopolitical tensions impacting trade, pose challenges to stable production and growth.
Q3. Which segment is expected to witness high growth?
The OEMs segment is expected to witness the highest growth over the forecast period as manufacturers increasingly integrate 3D SLC NAND flash into smartphones, laptops, and enterprise storage solutions. Rising demand for reliable, high-speed memory in consumer electronics and industrial applications has boosted adoption, fostering innovation and strengthening supplier-OEM collaborations globally.
Q4. Who are the top major players for this market?
The 3D NAND market is dominated by a few large semiconductor manufacturers who invest heavily in R&D and fabrication. Key players include Samsung Electronics, KIOXIA Corporation, SK Hynix, Micron Technology, and Western Digital. These companies continually compete to achieve higher layer counts and improved storage density.
Q5. Which country is the largest player?
United States, in North America is expected to witness the highest growth over the forecast period due to its advanced semiconductor manufacturing infrastructure, high adoption of consumer electronics, and strong demand for high-performance storage solutions. Supportive government policies, substantial R&D investment, and the presence of major technology companies further drive market expansion.
Data Library Research are conducted by industry experts who offer insight on industry structure, market segmentations technology assessment and competitive landscape (CL), and penetration, as well as on emerging trends. Their analysis is based on primary interviews (~ 80%) and secondary research (~ 20%) as well as years of professional expertise in their respective industries. Adding to this, by analysing historical trends and current market positions, our analysts predict where the market will be headed for the next five years. Furthermore, the varying trends of segment & categories geographically presented are also studied and the estimated based on the primary & secondary research.
In this particular report from the supply side Data Library Research has conducted primary surveys (interviews) with the key level executives (VP, CEO’s, Marketing Director, Business Development Manager and SOFT) of the companies that active & prominent as well as the midsized organization
FIGURE 1: DLR RESEARH PROCESS
Extensive primary research was conducted to gain a deeper insight of the market and industry performance. The analysis is based on both primary and secondary research as well as years of professional expertise in the respective industries.
In addition to analysing current and historical trends, our analysts predict where the market is headed over the next five years.
It varies by segment for these categories geographically presented in the list of market tables. Speaking about this particular report we have conducted primary surveys (interviews) with the key level executives (VP, CEO’s, Marketing Director, Business Development Manager and many more) of the major players active in the market.
Secondary ResearchSecondary research was mainly used to collect and identify information useful for the extensive, technical, market-oriented, and Friend’s study of the Global Extra Neutral Alcohol. It was also used to obtain key information about major players, market classification and segmentation according to the industry trends, geographical markets, and developments related to the market and technology perspectives. For this study, analysts have gathered information from various credible sources, such as annual reports, sec filings, journals, white papers, SOFT presentations, and company web sites.
Market Size EstimationBoth, top-down and bottom-up approaches were used to estimate and validate the size of the Global market and to estimate the size of various other dependent submarkets in the overall Extra Neutral Alcohol. The key players in the market were identified through secondary research and their market contributions in the respective geographies were determined through primary and secondary research.
Forecast Model