Advanced Glass Market Overview
The Advanced Glass Market is anticipated to increase at a CAGR of 10.9% from its current value of USD 74.85 billion in 2023 to USD 162.62 billion by 2030.
A superior grade of glass is advanced glass. It is built with certain features and can be used in a variety of ways. Soda ash, natural gas, and silica sand are used to make advanced glass. This glass is made with cutting-edge technology and materials. Depending on the application, advanced glasses go through a variety of mechanical and chemical procedures. UV management, safety, sound reduction, and security are just a few of the benefits and applications of advanced glass. The global Advanced Glass market is expected to grow at a sound pace in the times to follow.
Several factors such as growing urbanization and industrialization, the growth of the automotive industry and its manufacturing bases, and an increase in infrastructure development spending are majorly contributing towards the growth of the global Advanced Glass market. Moreover, the market is projected to be propelled by an increase in demand for household appliances and electronic gadgets. This glass is long-lasting, resistant to thermal shock, and dependable. Additionally, during the forecast period, the market is expected to be driven by an increase in energy-efficient towers and a growth in the use of mirrors and windscreens in the automobile sector.
On the downside, the market is expected to be hampered by an increase in the cost of advanced glass as a result of the widening gap between supply and demand, as well as the unpredictability of raw material availability. Furthermore, the advanced glass market is anticipated to be hindered in the coming years by rising raw material prices. Besides this, the increased use of sophisticated glass in the commercial, automotive, and electrics industries is likely to open up various attractive opportunities for the development of the market.
| Report Metric |
Details |
| Market size available for years |
2023–2030 |
| Base year considered |
2023 |
| Forecast period |
2024–2030 |
| Forecast unit |
Value (USD Million) |
| Segments covered |
Raw Material, Function, Product Type, End-user, and Region |
| Regions covered |
North America (the U.S. and Canada), Europe (UK, Germany, France, Italy, Spain, Russia, Rest of Europe), Asia-Pacific (China, India, Japan, Australia, South East Asia, Rest of Asia Pacific), Latin America and the Middle East and Africa (Brazil, Saudi Arabia, UAE, Rest of LAMEA) |
| Companies covered |
SCHOTT AG, Guardian Industries, Huihua Glass Co. Ltd., Sisecam Group, Fuyao Glass Industry Group Co., Ltd., American Precision Glass Corp, PPG Industries, Gentex Corporation, Schott AG and NSG Co, Xinyi Glass Holdings Limited, Sangalli Vetro Manfredonia, Glaze-Tech Industries, AGC, Occipital Inc, Saint-Gobain, Abrisa Technologies, Murata Manufacturing Co Ltd, CoorsTek, Inc., Nippon Sheet Glass Co., Ltd., Atheer, Inc., Packerland Glass Products Inc., Vurix Corporation, Thermoseal Industries LLC., Zeel Product. |
Covid-19 Impact on Advanced Glass Market
The ongoing COVID-19 pandemic conditions have severely affected every sector around the world. Whereas, the chemicals and materials sectors were moderately affected during the pandemic. This is primarily due to the uncut demand for chemicals for healthcare, life science, and cleaning agents. However, other elements of chemical and material sectors such as paints, industrial oil, construction materials are facing diminution in demand. Strict lockdown resulted in a nearly 50-60% reduction in supply for raw materials, which directly affected the manufacturing process. Further, halt on many end-use industries directly affected the chemical demand all around the world.
Advanced Glass Market Segment Overview
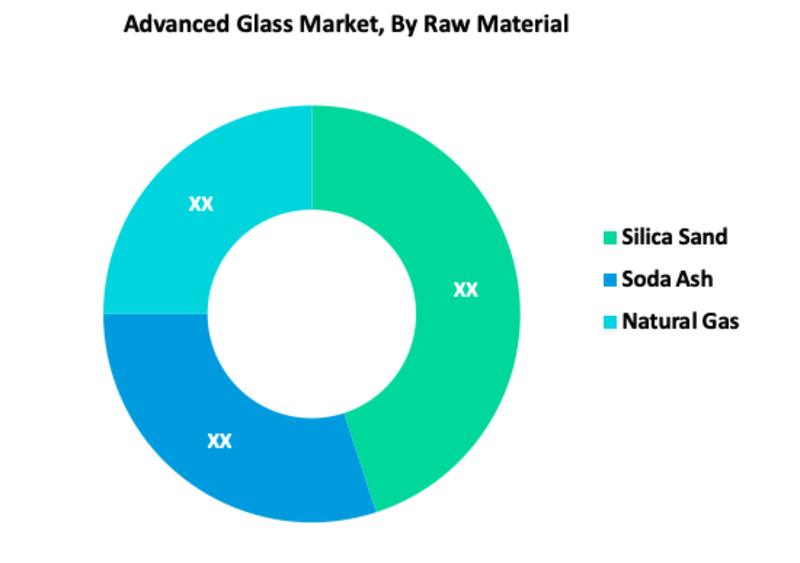
Based on Raw Material, Silica Sand is the most prominent segment in the global Advanced Glass market. It is expected to grow due to the product's good homogeneity, lack of bubbles and inclusions, and high working temperature capabilities. By Product Type, Tempered glass and Laminated glass are major segments in the market. Tempered glass is used in construction (commercial, residential, and industrial buildings), car mirrors and windows (side and rearview), greenhouses, household appliances (microwaves, refrigerators, cookware, and dishwashers), and gadgets (such as computers, tablets, and mobile phones). Additionally, windscreens and the construction of hospitals, workplaces, and organizations can all benefit from laminated glass.
Advanced Glass Market, By Raw Material
· Silica Sand
· Soda Ash
· Natural Gas
Advanced Glass Market, By Function
· Solar Control
· Safety & Security
· High Performance
· Optics & Lighting
Advanced Glass Market, By Product Type
· Laminated Glass
· Ceramic Glass
· Tempered glass
· Ceramic Glass
Advanced Glass Market, By End-user
· Aerospace & Defense
· Electronics
· Building & Construction
· Automotive
· Optical
· Sports & Leisure
Advanced Glass Market Regional Overview
In terms of region, Asia Pacific is expected to be the fastest-growing region of the global Advanced Glass market. This is owing to an increase in demand for advanced glass products as well as increased public knowledge of the benefits of using advanced glass. Japan and China are putting more emphasis on solar panels for power generation. The advanced glass market is predicted to increase as a result of this. In 2020, North America was the second-largest advanced glass market region. The development in the use of glass in the building, construction, and infrastructure industries can be attributed to the market's growth in this region. Likewise, Europe is a significant part of the global advanced glass market. The usage of sophisticated glass in a variety of applications, from electronics to automobiles, is boosting demand in the region. Furthermore, during the projection period, the market in Latin America and the Middle East, and Africa is predicted to increase moderately, owing to the expansion of end-use sectors such as electronics and automotive production facilities.
Advanced Glass Market, By Geography
· North America (US & Canada)
· Europe (UK, Germany, France, Italy, Spain, Russia & Rest of Europe)
· Asia-Pacific (Japan, China, India, Australia, & South Korea, & Rest of Asia-Pacific)
· LAMEA (Brazil, Saudi Arabia, UAE & Rest of LAMEA)
Advanced Glass Market, Key Players
· SCHOTT AG
· Guardian Industries
· Huihua Glass Co. Ltd.
· Sisecam Group
· Fuyao Glass Industry Group Co., Ltd.
· American Precision Glass Corp
· PPG Industries
· Gentex Corporation
· Schott AG and NSG Co
· Xinyi Glass Holdings Limited
· Sangalli Vetro Manfredonia
· Glaze-Tech Industries
· AGC, Occipital Inc
· Saint-Gobain
· Abrisa Technologies
· Murata Manufacturing Co Ltd
· CoorsTek, Inc.
· Nippon Sheet Glass Co., Ltd.
· Atheer, Inc.
· Packerland Glass Products Inc.
· Vurix Corporation
· Thermoseal Industries LLC.
· Zeel Product
Frequently Asked Questions (FAQ) :
Q1. What are the driving factors for the Advanced Glass market?
The growing urbanisation and industrialization, the growth of the automotive industry and its manufacturing bases, and an increase in infrastructure development spending are some major factors that boosting the growth of the Advanced Glass market.
Q2. What are the restraining factors for the Advanced Glass market?
The cost of advanced glass as a result of the widening gap between supply and demand, as well as the unpredictability of raw material availability are major factor that hamper the growth of the global Advanced Glass market.
Q3. Which Segments are covered in the Advanced Glass market report?
Raw Material, Function, Product Type, End-user, and Region, these segments are covered in the Advanced Glass market report.
Q4. Which segment is projected to hold the largest share in the Advanced Glass Market. ?
SCHOTT AG, Guardian Industries, Huihua Glass Co. Ltd., Sisecam Group, Fuyao Glass Industry Group Co., Ltd., American Precision Glass Corp, PPG Industries, Gentex Corporation, Schott AG and NSG Co, Xinyi Glass Holdings Limited, Sangalli Vetro Manfredonia, Glaze-Tech Industries, AGC, Occipital Inc, Saint-Gobain, Abrisa Technologies, Murata Manufacturing Co Ltd, CoorsTek, Inc., Nippon Sheet Glass Co., Ltd., Atheer, Inc., Packerland Glass Products Inc., Vurix Corporation, Thermoseal Industries LLC., Zeel Product. are some key players in the Advanced Glass Market.
List of Figures
Figure 1: Global Advanced Glass Market Revenue Breakdown (USD Billion, %) by Region, 2023 & 2030
Figure 2: Global Advanced Glass Market Value Share (%), By Segment 1, 2023 & 2030
Figure 3: Global Advanced Glass Market Forecast (USD Billion), by Sub-Segment 1, 2021-2030
Figure 4: Global Advanced Glass Market Forecast (USD Billion), by Sub-Segment 2, 2021-2030
Figure 5: Global Advanced Glass Market Value Share (%), By Segment 2, 2023 & 2030
Figure 6: Global Advanced Glass Market Forecast (USD Billion), by Sub-Segment 1, 2021-2030
Figure 7: Global Advanced Glass Market Forecast (USD Billion), by Sub-Segment 2, 2021-2030
Figure 8: Global Advanced Glass Market Forecast (USD Billion), by Sub-Segment 3, 2021-2030
Figure 9: Global Advanced Glass Market Forecast (USD Billion), by Others, 2021-2030
Figure 10: Global Advanced Glass Market Value Share (%), By Segment 3, 2023 & 2030
Figure 11: Global Advanced Glass Market Forecast (USD Billion), by Sub-Segment 1, 2021-2030
Figure 12: Global Advanced Glass Market Forecast (USD Billion), by Sub-Segment 2, 2021-2030
Figure 13: Global Advanced Glass Market Forecast (USD Billion), by Sub-Segment 3, 2021-2030
Figure 14: Global Advanced Glass Market Forecast (USD Billion), by Others, 2021-2030
Figure 15: Global Advanced Glass Market Value (USD Billion), by Region, 2023 & 2030
Figure 16: North America Advanced Glass Market Value Share (%), By Segment 1, 2023 & 2030
Figure 17: North America Advanced Glass Market Forecast (USD Billion), by Sub-Segment 1, 2021-2030
Figure 18: North America Advanced Glass Market Forecast (USD Billion), by Sub-Segment 2, 2021-2030
Figure 19: North America Advanced Glass Market Value Share (%), By Segment 2, 2023 & 2030
Figure 20: North America Advanced Glass Market Forecast (USD Billion), by Sub-Segment 1, 2021-2030
Figure 21: North America Advanced Glass Market Forecast (USD Billion), by Sub-Segment 2, 2021-2030
Figure 22: North America Advanced Glass Market Forecast (USD Billion), by Sub-Segment 3, 2021-2030
Figure 23: North America Advanced Glass Market Forecast (USD Billion), by Others, 2021-2030
Figure 24: North America Advanced Glass Market Value Share (%), By Segment 3, 2023 & 2030
Figure 25: North America Advanced Glass Market Forecast (USD Billion), by Sub-Segment 1, 2021-2030
Figure 26: North America Advanced Glass Market Forecast (USD Billion), by Sub-Segment 2, 2021-2030
Figure 27: North America Advanced Glass Market Forecast (USD Billion), by Sub-Segment 3, 2021-2030
Figure 28: North America Advanced Glass Market Forecast (USD Billion), by Others, 2021-2030
Figure 29: North America Advanced Glass Market Forecast (USD Billion), by U.S., 2021-2030
Figure 30: North America Advanced Glass Market Forecast (USD Billion), by Canada, 2021-2030
Figure 31: Latin America Advanced Glass Market Value Share (%), By Segment 1, 2023 & 2030
Figure 32: Latin America Advanced Glass Market Forecast (USD Billion), by Sub-Segment 1, 2021-2030
Figure 33: Latin America Advanced Glass Market Forecast (USD Billion), by Sub-Segment 2, 2021-2030
Figure 34: Latin America Advanced Glass Market Value Share (%), By Segment 2, 2023 & 2030
Figure 35: Latin America Advanced Glass Market Forecast (USD Billion), by Sub-Segment 1, 2021-2030
Figure 36: Latin America Advanced Glass Market Forecast (USD Billion), by Sub-Segment 2, 2021-2030
Figure 37: Latin America Advanced Glass Market Forecast (USD Billion), by Sub-Segment 3, 2021-2030
Figure 38: Latin America Advanced Glass Market Forecast (USD Billion), by Others, 2021-2030
Figure 39: Latin America Advanced Glass Market Value Share (%), By Segment 3, 2023 & 2030
Figure 40: Latin America Advanced Glass Market Forecast (USD Billion), by Sub-Segment 1, 2021-2030
Figure 41: Latin America Advanced Glass Market Forecast (USD Billion), by Sub-Segment 2, 2021-2030
Figure 42: Latin America Advanced Glass Market Forecast (USD Billion), by Sub-Segment 3, 2021-2030
Figure 43: Latin America Advanced Glass Market Forecast (USD Billion), by Others, 2021-2030
Figure 44: Latin America Advanced Glass Market Forecast (USD Billion), by Brazil, 2021-2030
Figure 45: Latin America Advanced Glass Market Forecast (USD Billion), by Mexico, 2021-2030
Figure 46: Latin America Advanced Glass Market Forecast (USD Billion), by Rest of Latin America, 2021-2030
Figure 47: Europe Advanced Glass Market Value Share (%), By Segment 1, 2023 & 2030
Figure 48: Europe Advanced Glass Market Forecast (USD Billion), by Sub-Segment 1, 2021-2030
Figure 49: Europe Advanced Glass Market Forecast (USD Billion), by Sub-Segment 2, 2021-2030
Figure 50: Europe Advanced Glass Market Value Share (%), By Segment 2, 2023 & 2030
Figure 51: Europe Advanced Glass Market Forecast (USD Billion), by Sub-Segment 1, 2021-2030
Figure 52: Europe Advanced Glass Market Forecast (USD Billion), by Sub-Segment 2, 2021-2030
Figure 53: Europe Advanced Glass Market Forecast (USD Billion), by Sub-Segment 3, 2021-2030
Figure 54: Europe Advanced Glass Market Forecast (USD Billion), by Others, 2021-2030
Figure 55: Europe Advanced Glass Market Value Share (%), By Segment 3, 2023 & 2030
Figure 56: Europe Advanced Glass Market Forecast (USD Billion), by Sub-Segment 1, 2021-2030
Figure 57: Europe Advanced Glass Market Forecast (USD Billion), by Sub-Segment 2, 2021-2030
Figure 58: Europe Advanced Glass Market Forecast (USD Billion), by Sub-Segment 3, 2021-2030
Figure 59: Europe Advanced Glass Market Forecast (USD Billion), by Others, 2021-2030
Figure 60: Europe Advanced Glass Market Forecast (USD Billion), by U.K., 2021-2030
Figure 61: Europe Advanced Glass Market Forecast (USD Billion), by Germany, 2021-2030
Figure 62: Europe Advanced Glass Market Forecast (USD Billion), by France, 2021-2030
Figure 63: Europe Advanced Glass Market Forecast (USD Billion), by Italy, 2021-2030
Figure 64: Europe Advanced Glass Market Forecast (USD Billion), by Spain, 2021-2030
Figure 65: Europe Advanced Glass Market Forecast (USD Billion), by Russia, 2021-2030
Figure 66: Europe Advanced Glass Market Forecast (USD Billion), by Rest of Europe, 2021-2030
Figure 67: Asia Pacific Advanced Glass Market Value Share (%), By Segment 1, 2023 & 2030
Figure 68: Asia Pacific Advanced Glass Market Forecast (USD Billion), by Sub-Segment 1, 2021-2030
Figure 69: Asia Pacific Advanced Glass Market Forecast (USD Billion), by Sub-Segment 2, 2021-2030
Figure 70: Asia Pacific Advanced Glass Market Value Share (%), By Segment 2, 2023 & 2030
Figure 71: Asia Pacific Advanced Glass Market Forecast (USD Billion), by Sub-Segment 1, 2021-2030
Figure 72: Asia Pacific Advanced Glass Market Forecast (USD Billion), by Sub-Segment 2, 2021-2030
Figure 73: Asia Pacific Advanced Glass Market Forecast (USD Billion), by Sub-Segment 3, 2021-2030
Figure 74: Asia Pacific Advanced Glass Market Forecast (USD Billion), by Others, 2021-2030
Figure 75: Asia Pacific Advanced Glass Market Value Share (%), By Segment 3, 2023 & 2030
Figure 76: Asia Pacific Advanced Glass Market Forecast (USD Billion), by Sub-Segment 1, 2021-2030
Figure 77: Asia Pacific Advanced Glass Market Forecast (USD Billion), by Sub-Segment 2, 2021-2030
Figure 78: Asia Pacific Advanced Glass Market Forecast (USD Billion), by Sub-Segment 3, 2021-2030
Figure 79: Asia Pacific Advanced Glass Market Forecast (USD Billion), by Others, 2021-2030
Figure 80: Asia Pacific Advanced Glass Market Forecast (USD Billion), by China, 2021-2030
Figure 81: Asia Pacific Advanced Glass Market Forecast (USD Billion), by India, 2021-2030
Figure 82: Asia Pacific Advanced Glass Market Forecast (USD Billion), by Japan, 2021-2030
Figure 83: Asia Pacific Advanced Glass Market Forecast (USD Billion), by Australia, 2021-2030
Figure 84: Asia Pacific Advanced Glass Market Forecast (USD Billion), by Southeast Asia, 2021-2030
Figure 85: Asia Pacific Advanced Glass Market Forecast (USD Billion), by Rest of Asia Pacific, 2021-2030
Figure 86: Middle East & Africa Advanced Glass Market Value Share (%), By Segment 1, 2023 & 2030
Figure 87: Middle East & Africa Advanced Glass Market Forecast (USD Billion), by Sub-Segment 1, 2021-2030
Figure 88: Middle East & Africa Advanced Glass Market Forecast (USD Billion), by Sub-Segment 2, 2021-2030
Figure 89: Middle East & Africa Advanced Glass Market Value Share (%), By Segment 2, 2023 & 2030
Figure 90: Middle East & Africa Advanced Glass Market Forecast (USD Billion), by Sub-Segment 1, 2021-2030
Figure 91: Middle East & Africa Advanced Glass Market Forecast (USD Billion), by Sub-Segment 2, 2021-2030
Figure 92: Middle East & Africa Advanced Glass Market Forecast (USD Billion), by Sub-Segment 3, 2021-2030
Figure 93: Middle East & Africa Advanced Glass Market Forecast (USD Billion), by Others, 2021-2030
Figure 94: Middle East & Africa Advanced Glass Market Value Share (%), By Segment 3, 2023 & 2030
Figure 95: Middle East & Africa Advanced Glass Market Forecast (USD Billion), by Sub-Segment 1, 2021-2030
Figure 96: Middle East & Africa Advanced Glass Market Forecast (USD Billion), by Sub-Segment 2, 2021-2030
Figure 97: Middle East & Africa Advanced Glass Market Forecast (USD Billion), by Sub-Segment 3, 2021-2030
Figure 98: Middle East & Africa Advanced Glass Market Forecast (USD Billion), by Others, 2021-2030
Figure 99: Middle East & Africa Advanced Glass Market Forecast (USD Billion), by GCC, 2021-2030
Figure 100: Middle East & Africa Advanced Glass Market Forecast (USD Billion), by South Africa, 2021-2030
Figure 101: Middle East & Africa Advanced Glass Market Forecast (USD Billion), by Rest of Middle East & Africa, 2021-2030
List of Tables
Table 1: Global Advanced Glass Market Revenue (USD Billion) Forecast, by Segment 1, 2021-2030
Table 2: Global Advanced Glass Market Revenue (USD Billion) Forecast, by Segment 2, 2021-2030
Table 3: Global Advanced Glass Market Revenue (USD Billion) Forecast, by Segment 3, 2021-2030
Table 4: Global Advanced Glass Market Revenue (USD Billion) Forecast, by Region, 2021-2030
Table 5: North America Advanced Glass Market Revenue (USD Billion) Forecast, by Segment 1, 2021-2030
Table 6: North America Advanced Glass Market Revenue (USD Billion) Forecast, by Segment 2, 2021-2030
Table 7: North America Advanced Glass Market Revenue (USD Billion) Forecast, by Segment 3, 2021-2030
Table 8: North America Advanced Glass Market Revenue (USD Billion) Forecast, by Country, 2021-2030
Table 9: Europe Advanced Glass Market Revenue (USD Billion) Forecast, by Segment 1, 2021-2030
Table 10: Europe Advanced Glass Market Revenue (USD Billion) Forecast, by Segment 2, 2021-2030
Table 11: Europe Advanced Glass Market Revenue (USD Billion) Forecast, by Segment 3, 2021-2030
Table 12: Europe Advanced Glass Market Revenue (USD Billion) Forecast, by Country, 2021-2030
Table 13: Latin America Advanced Glass Market Revenue (USD Billion) Forecast, by Segment 1, 2021-2030
Table 14: Latin America Advanced Glass Market Revenue (USD Billion) Forecast, by Segment 2, 2021-2030
Table 15: Latin America Advanced Glass Market Revenue (USD Billion) Forecast, by Segment 3, 2021-2030
Table 16: Latin America Advanced Glass Market Revenue (USD Billion) Forecast, by Country, 2021-2030
Table 17: Asia Pacific Advanced Glass Market Revenue (USD Billion) Forecast, by Segment 1, 2021-2030
Table 18: Asia Pacific Advanced Glass Market Revenue (USD Billion) Forecast, by Segment 2, 2021-2030
Table 19: Asia Pacific Advanced Glass Market Revenue (USD Billion) Forecast, by Segment 3, 2021-2030
Table 20: Asia Pacific Advanced Glass Market Revenue (USD Billion) Forecast, by Country, 2021-2030
Table 21: Middle East & Africa Advanced Glass Market Revenue (USD Billion) Forecast, by Segment 1, 2021-2030
Table 22: Middle East & Africa Advanced Glass Market Revenue (USD Billion) Forecast, by Segment 2, 2021-2030
Table 23: Middle East & Africa Advanced Glass Market Revenue (USD Billion) Forecast, by Segment 3, 2021-2030
Table 24: Middle East & Africa Advanced Glass Market Revenue (USD Billion) Forecast, by Country, 2021-2030
Research Process
Data Library Research are conducted by industry experts who offer insight on
industry structure, market segmentations technology assessment and competitive landscape (CL), and penetration, as well as on emerging trends. Their analysis is based on primary interviews (~ 80%) and secondary research (~ 20%) as well as years of professional expertise in their respective industries. Adding to this, by analysing historical trends and current market positions, our analysts predict where the market will be headed for the next five years. Furthermore, the varying trends of segment & categories geographically presented are also studied and the estimated based on the primary & secondary research.
In this particular report from the supply side Data Library Research has conducted primary surveys (interviews) with the key level executives (VP, CEO’s, Marketing Director, Business Development Manager
and SOFT) of the companies that active & prominent as well as the midsized organization
FIGURE 1: DLR RESEARH PROCESS
![research-methodology1]()
Primary Research
Extensive primary research was conducted to gain a deeper insight of the market and industry performance. The analysis is based on both primary and secondary research as well as years of professional expertise in the respective industries.
In addition to analysing current and historical trends, our analysts predict where the market is headed over the next five years.
It varies by segment for these categories geographically presented in the list of market tables. Speaking about this particular report we have conducted primary surveys (interviews) with the key level executives (VP, CEO’s, Marketing Director, Business Development Manager and many more) of the major players active in the market.
Secondary Research
Secondary research was mainly used to collect and identify information useful for the extensive, technical, market-oriented, and Friend’s study of the Global Extra Neutral Alcohol. It was also used to obtain key information about major players, market classification and segmentation according to the industry trends, geographical markets, and developments related to the market and technology perspectives. For this study, analysts have gathered information from various credible sources, such as annual reports, sec filings, journals, white papers, SOFT presentations, and company web sites.
Market Size Estimation
Both, top-down and bottom-up approaches were used to estimate and validate the size of the Global market and to estimate the size of various other dependent submarkets in the overall Extra Neutral Alcohol. The key players in the market were identified through secondary research and their market contributions in the respective geographies were determined through primary and secondary research.
Forecast Model
![research-methodology2]()