Artificial Bone Repair Material Market Overview and Analysis:
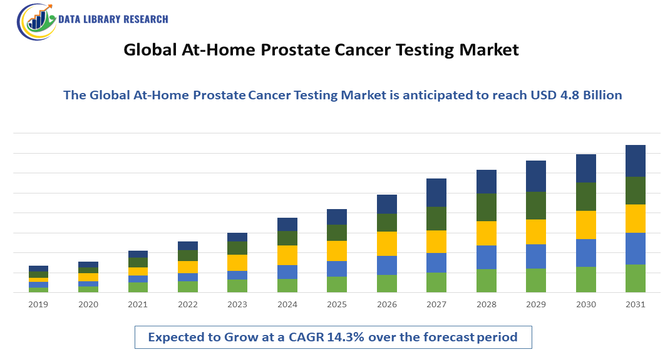
- The Global Artificial Bone Repair Material Market size was valued at approximately USD 1.8 billion in 2025, and it is projected to reach USD 5.2 billion by 2032, growing with a CAGR of 12.3% from 2025 to 2032.
Get Complete Analysis Of The Report - Download Updated Free Sample PDF
The Global Artificial Bone Repair Material Market is experiencing significant growth driven by the increasing prevalence of bone-related disorders, including osteoporosis, fractures, and degenerative conditions, particularly among the aging global population. As life expectancy rises, a larger proportion of the population is susceptible to bone injuries and diseases that require surgical intervention, fueling demand for effective artificial bone repair solutions. Additionally, technological advancements in biomaterials and implant design, such as bioactive ceramics, polymer composites, and customized 3D-printed scaffolds, are enhancing biocompatibility and clinical outcomes, making artificial materials preferred over traditional grafts in many orthopedic procedures.
Artificial Bone Repair Material Market Latest Trends
The Global Artificial Bone Repair Material Market is being shaped by several innovative and clinical trends that are transforming orthopedic care. A major trend is the growing adoption of advanced biomaterials and synthetic substitutes, such as bioactive glass, calcium phosphate composites, and polymer-ceramic blends, which offer enhanced biocompatibility and faster bone regeneration compared to traditional grafts. These materials support improved osteointegration and reduce the risk of infection or immune rejection, driving broader clinical use in orthopedic, dental, and reconstructive surgeries. Another significant trend is the integration of 3D printing and additive manufacturing technologies to produce patient-specific bone scaffolds and implants that match individual anatomical requirements. This enables surgeons to tailor solutions for complex defects, improving surgical outcomes and reducing recovery times, especially in spinal, craniofacial, and trauma applications.
Segmentation: Global Artificial Bone Repair Material Market is segmented by Material Type (Ceramics, Polymers, Composite Materials, Metal-based Materials), Product Type (Bone Graft Substitutes, Bone Plates & Screws, Bone Scaffolds, Injectable Bone Repair Materials), Application (Orthopedic Surgery, Dental & Maxillofacial Surgery, Spinal Fusion, Trauma & Reconstruction), End User (Hospitals, Orthopedic Clinics, Ambulatory Surgical Centers), and Geography (North America, Europe, Asia-Pacific, Middle East and Africa, and South America). The report provides the value (in USD million) for the above segments.
For Detailed Market Segmentation - Get a Free Sample PDF
Market Drivers:
- Rising Prevalence of Bone Disorders and Orthopedic Injuries
The primary drivers of the artificial bone repair material market is the increasing incidence of bone-related disorders such as osteoporosis, osteoarthritis, and degenerative bone diseases, particularly among the aging global population. Additionally, the growing number of trauma cases, sports injuries, and road accidents has led to a higher demand for orthopedic surgeries requiring bone repair and reconstruction. For instance, in January 2025, an article published by Journal titled, Risk Management and Healthcare Policy, femoral fracture cases were 11.57 million in 2021. Males showed consistently higher incidence (155.53 per 100,000), while adults aged 75+ experienced the sharpest increase, exceeding 600 per 100,000 in some regions. These trends intensify demand for orthopedic surgeries, directly expanding the Global Artificial Bone Repair Material Market through higher utilization of synthetic grafts and bone repair solutions.
Artificial bone repair materials offer reliable alternatives to traditional autografts and allografts by reducing donor site morbidity and infection risks. As healthcare providers increasingly adopt advanced surgical solutions to manage complex bone defects, demand for artificial bone repair materials continues to rise, driving market growth worldwide.
- Technological Advancements in Biomaterials and Regenerative Medicine
Continuous innovation in biomaterials and regenerative technologies is significantly accelerating the adoption of artificial bone repair materials. Advances in bioactive ceramics, polymer composites, and hybrid materials have improved biocompatibility, mechanical strength, and osteoconductive properties, enabling faster and more effective bone regeneration.
In October 2023, The IISER Bhopal innovation of a clear, biodegradable, and biocompatible synthetic adhesive represents a notable advancement in biomaterials and regenerative medicine. Its ability to bond tissues and bones in diverse environments supports minimally invasive orthopedic repair and faster healing. For the Global Artificial Bone Repair Material Market, this technology complements bone substitutes by improving fixation, reducing reliance on sutures and hardware, and advancing sustainable, high-performance medical solutions. These innovations enhance clinical outcomes, reduce recovery times, and expand the range of applications for artificial bone repair materials, making them increasingly preferred in modern orthopedic and reconstructive procedures.
Market Restraints:
- High Cost of Advanced Bone Repair Materials and Procedures
A major restraint limiting the growth of the artificial bone repair material market is the high cost associated with advanced biomaterials and surgical procedures. Innovative materials such as bioactive ceramics, composite scaffolds, and custom 3D-printed implants involve complex manufacturing processes, stringent quality controls, and significant R&D investments, which increase overall treatment costs. These high expenses can restrict adoption, particularly in cost-sensitive healthcare systems and developing economies, where reimbursement coverage for advanced orthopedic procedures is limited. As a result, many patients and healthcare providers continue to rely on traditional bone grafts, slowing market penetration.
Socioeconomic Impact on Artificial Bone Repair Material Market
The Global Artificial Bone Repair Material Market exerts a significant socioeconomic impact by improving patient mobility, productivity, and quality of life while reducing long-term disability costs. Expanded access to biomaterials supports faster recovery from trauma, aging-related fractures, and chronic diseases, lowering hospitalization durations and caregiver burdens. Market growth stimulates skilled employment across research, manufacturing, and clinical services, and drives investment in advanced materials and regulatory infrastructure. However, high costs and uneven reimbursement can widen health inequities between regions. Strategic pricing, public–private partnerships, and localized production can enhance affordability, strengthen healthcare systems, and deliver broad economic and social returns for communities worldwide sustainably.
Segmental Analysis:
- Ceramics segment is expected to witness highest growth over the forecast period
The ceramics segment holds a significant share of the Global Artificial Bone Repair Material Market due to its excellent biocompatibility, osteoconductivity, and chemical similarity to natural bone. Materials such as hydroxyapatite and tricalcium phosphate are widely used in clinical settings, supporting effective bone regeneration and integration. Their extensive adoption in orthopedic and dental procedures contributes substantially to the market value measured in USD million.
- Bone Graft Substitutes segment is expected to witness highest growth over the forecast period
Bone graft substitutes represent a dominant product segment, driven by the increasing need to replace autografts and allografts while reducing surgical complications. These substitutes offer consistent quality, lower infection risk, and improved availability, making them highly preferred in orthopedic and trauma surgeries, thereby contributing significantly to overall market revenues.
In December 2024, The coral-inspired, bioresorbable bone graft substitute developed at Swansea University represents a major advancement in bone repair technologies. By promoting rapid healing and safely dissolving after regeneration, it addresses key limitations of autografts and allografts, such as supply constraints and infection risks. This patented innovation strengthens the Global Artificial Bone Repair Material Market by advancing bioactive, sustainable substitutes that improve clinical outcomes and expand treatment options for complex bone defects.
- Orthopedic Surgery segment is expected to witness highest growth over the forecast period
Orthopedic surgery is a key application area, fueled by the growing incidence of fractures, osteoporosis, and joint replacement procedures. Artificial bone repair materials are extensively used to enhance healing and structural support, leading to strong demand and high market valuation in this segment.
- Hospitals segment is expected to witness highest growth over the forecast period
Hospitals account for the largest end-user segment, as they perform a high volume of complex orthopedic, spinal, and trauma surgeries. The availability of advanced surgical infrastructure and skilled professionals supports greater utilization of artificial bone repair materials, driving revenue growth.
- North America segment is expected to witness highest growth over the forecast period
North America leads the market due to advanced healthcare infrastructure, high adoption of innovative biomaterials, and a strong presence of key manufacturers. Favorable reimbursement policies and rising orthopedic procedure volumes further strengthen the regional market value in USD million terms.
In November 2025, RevBio announced that its regenerative bone adhesive, TETRANITE, had been approved for a 20-patient pilot study evaluating safety and efficacy in treating complex, multi-fragmented wrist fractures. This approval strengthened the North America Artificial Bone Repair Material Market by advancing clinical validation of novel biomaterials. The study supported innovation in fracture fixation, encouraged investment in regenerative solutions, and reinforced the region’s leadership in next-generation orthopedic repair technologies.
High healthcare spending enables rapid integration of artificial bone repair materials into clinical practice, particularly in orthopedic and dental procedures. Favorable reimbursement frameworks support patient access to advanced treatments, while a growing elderly population and rising sports- and trauma-related injuries increase procedure volumes. Additionally, robust regulatory pathways and continuous technological advancements reinforce North America’s dominant position in the global market.
| Report Matrics |
Details |
| Market Size Value |
USD 5.2 billion |
| Growth Rate |
CAGR of 12.3 % |
| Forecast |
2026-2033 |
| Historical data |
2021-2024 |
| Base Year |
2025 |
| Report Coverage |
Forecasted revenue, company rating, competitive environment, growth drivers, and trends |
| Segment Coverage |
Type, Application, End-User, Geography |
| Regional Scope |
North America, Europe, Asia Pacific, Middle East |
| Customized scope |
Free customization of reports (With 3 months' analysis support) |
| To Learn More About This Report |
Request a Free Sample Copy |
Artificial Bone Repair Material Market Competitive Landscape:
The Global Artificial Bone Repair Material Market features a highly competitive landscape shaped by major medical device and biomaterials manufacturers striving for technological superiority, expanded product portfolios, and broader global reach. Leading players are investing significantly in research and development to introduce advanced bone graft substitutes, bioactive ceramics, polymer composites, and patient-specific scaffolds that improve clinical outcomes in orthopedic, spinal, trauma, and dental applications. Strategic approaches such as mergers, acquisitions, regulatory approvals, and partnerships with healthcare providers are common as companies seek to strengthen their market positions and respond to rising demand for safe, effective artificial bone repair solutions worldwide.
Key Players:
- DePuy Synthes (Johnson & Johnson)
- Stryker Corporation
- Zimmer Biomet Holdings, Inc.
- Medtronic plc
- Smith & Nephew plc
- NuVasive, Inc.
- Wright Medical Group N.V.
- Orthofix Medical Inc.
- Integra LifeSciences Holdings Corporation
- RTI Surgical Holdings, Inc.
- B. Braun Melsungen AG
- Bioventus LLC
- AlloSource
- Xtant Medical Holdings, Inc.
- Baxter International Inc.
- Collagen Matrix, Inc.
- Amedica Corporation
- Exactech, Inc.
- Biomatlante
- Graftys SA
Recent Development
- In December 2025, Xtant Medical Holdings’ commercial launch of the next-generation nanOss Strata synthetic bone graft strengthens the Global Artificial Bone Repair Material Market by expanding advanced, clinically ready alternatives to traditional grafts. This innovation enhances bone regeneration outcomes in spinal and orthopedic procedures while supporting minimally invasive surgical trends.
- In October 2025, HKUMed’s development of an elastic calcium phosphate “nano bone cement” marks a significant breakthrough for the Global Artificial Bone Repair Material Market. By replicating natural bone structure, this innovation minimizes reliance on conventional grafts, reduces surgical complications, and enhances healing efficiency. Its proven mechanical strength and regenerative performance are likely to boost acceptance of synthetic bone repair solutions, stimulate research investment, and support sustained global market expansion.
Frequently Asked Questions (FAQ) :
Q1. What are the main growth-driving factors for this market?
The market is growing because more people are living longer, leading to more age-related bone issues like osteoporosis. There is also a rise in sports injuries and car accidents that require bone surgery. Additionally, doctors now prefer synthetic materials because they reduce the need for painful second surgeries to harvest a patient's own bone.
Q2. What are the main restraining factors for this market?
Growth is primarily limited by the high cost of advanced materials and the complex surgeries needed to implant them. Strict government safety rules mean it takes a long time for new products to be approved. Also, in some cases, the body might reject the artificial material, causing inflammation or failing to heal properly.
Q3. Which segment is expected to witness high growth?
The Bioceramics and Composites segment is expected to see the highest growth. These materials are popular because they act like a "scaffold" that helps natural bone grow back. New 3D-printing technologies are also allowing companies to create custom-shaped bone repairs that fit a patient’s specific injury perfectly, making them highly in-demand.
Q4. Who are the top major players for this market?
The market is led by large medical technology companies that specialize in orthopedics. Key players include Stryker Corporation, Medtronic, Zimmer Biomet, Johnson & Johnson (DePuy Synthes), and Smith & Nephew. These companies lead by constantly inventing new materials that are stronger, safer, and help the body heal much faster than older versions.
Q5. Which country is the largest player?
The United States is the largest player in this market. It has a very high number of orthopedic surgeries and the most advanced medical research centers. Strong insurance coverage and early access to the newest bone repair technologies ensure that the U.S. remains the world leader in both making and using these materials.
List of Figures
Figure 1: Global Artificial Bone Repair Material Market Revenue Breakdown (USD Billion, %) by Region, 2022 & 2029
Figure 2: Global Artificial Bone Repair Material Market Value Share (%), By Segment 1, 2022 & 2029
Figure 3: Global Artificial Bone Repair Material Market Forecast (USD Billion), by Sub-Segment 1, 2018-2029
Figure 4: Global Artificial Bone Repair Material Market Forecast (USD Billion), by Sub-Segment 2, 2018-2029
Figure 5: Global Artificial Bone Repair Material Market Value Share (%), By Segment 2, 2022 & 2029
Figure 6: Global Artificial Bone Repair Material Market Forecast (USD Billion), by Sub-Segment 1, 2018-2029
Figure 7: Global Artificial Bone Repair Material Market Forecast (USD Billion), by Sub-Segment 2, 2018-2029
Figure 8: Global Artificial Bone Repair Material Market Forecast (USD Billion), by Sub-Segment 3, 2018-2029
Figure 9: Global Artificial Bone Repair Material Market Forecast (USD Billion), by Others, 2018-2029
Figure 10: Global Artificial Bone Repair Material Market Value Share (%), By Segment 3, 2022 & 2029
Figure 11: Global Artificial Bone Repair Material Market Forecast (USD Billion), by Sub-Segment 1, 2018-2029
Figure 12: Global Artificial Bone Repair Material Market Forecast (USD Billion), by Sub-Segment 2, 2018-2029
Figure 13: Global Artificial Bone Repair Material Market Forecast (USD Billion), by Sub-Segment 3, 2018-2029
Figure 14: Global Artificial Bone Repair Material Market Forecast (USD Billion), by Others, 2018-2029
Figure 15: Global Artificial Bone Repair Material Market Value (USD Billion), by Region, 2022 & 2029
Figure 16: North America Artificial Bone Repair Material Market Value Share (%), By Segment 1, 2022 & 2029
Figure 17: North America Artificial Bone Repair Material Market Forecast (USD Billion), by Sub-Segment 1, 2018-2029
Figure 18: North America Artificial Bone Repair Material Market Forecast (USD Billion), by Sub-Segment 2, 2018-2029
Figure 19: North America Artificial Bone Repair Material Market Value Share (%), By Segment 2, 2022 & 2029
Figure 20: North America Artificial Bone Repair Material Market Forecast (USD Billion), by Sub-Segment 1, 2018-2029
Figure 21: North America Artificial Bone Repair Material Market Forecast (USD Billion), by Sub-Segment 2, 2018-2029
Figure 22: North America Artificial Bone Repair Material Market Forecast (USD Billion), by Sub-Segment 3, 2018-2029
Figure 23: North America Artificial Bone Repair Material Market Forecast (USD Billion), by Others, 2018-2029
Figure 24: North America Artificial Bone Repair Material Market Value Share (%), By Segment 3, 2022 & 2029
Figure 25: North America Artificial Bone Repair Material Market Forecast (USD Billion), by Sub-Segment 1, 2018-2029
Figure 26: North America Artificial Bone Repair Material Market Forecast (USD Billion), by Sub-Segment 2, 2018-2029
Figure 27: North America Artificial Bone Repair Material Market Forecast (USD Billion), by Sub-Segment 3, 2018-2029
Figure 28: North America Artificial Bone Repair Material Market Forecast (USD Billion), by Others, 2018-2029
Figure 29: North America Artificial Bone Repair Material Market Forecast (USD Billion), by U.S., 2018-2029
Figure 30: North America Artificial Bone Repair Material Market Forecast (USD Billion), by Canada, 2018-2029
Figure 31: Latin America Artificial Bone Repair Material Market Value Share (%), By Segment 1, 2022 & 2029
Figure 32: Latin America Artificial Bone Repair Material Market Forecast (USD Billion), by Sub-Segment 1, 2018-2029
Figure 33: Latin America Artificial Bone Repair Material Market Forecast (USD Billion), by Sub-Segment 2, 2018-2029
Figure 34: Latin America Artificial Bone Repair Material Market Value Share (%), By Segment 2, 2022 & 2029
Figure 35: Latin America Artificial Bone Repair Material Market Forecast (USD Billion), by Sub-Segment 1, 2018-2029
Figure 36: Latin America Artificial Bone Repair Material Market Forecast (USD Billion), by Sub-Segment 2, 2018-2029
Figure 37: Latin America Artificial Bone Repair Material Market Forecast (USD Billion), by Sub-Segment 3, 2018-2029
Figure 38: Latin America Artificial Bone Repair Material Market Forecast (USD Billion), by Others, 2018-2029
Figure 39: Latin America Artificial Bone Repair Material Market Value Share (%), By Segment 3, 2022 & 2029
Figure 40: Latin America Artificial Bone Repair Material Market Forecast (USD Billion), by Sub-Segment 1, 2018-2029
Figure 41: Latin America Artificial Bone Repair Material Market Forecast (USD Billion), by Sub-Segment 2, 2018-2029
Figure 42: Latin America Artificial Bone Repair Material Market Forecast (USD Billion), by Sub-Segment 3, 2018-2029
Figure 43: Latin America Artificial Bone Repair Material Market Forecast (USD Billion), by Others, 2018-2029
Figure 44: Latin America Artificial Bone Repair Material Market Forecast (USD Billion), by Brazil, 2018-2029
Figure 45: Latin America Artificial Bone Repair Material Market Forecast (USD Billion), by Mexico, 2018-2029
Figure 46: Latin America Artificial Bone Repair Material Market Forecast (USD Billion), by Rest of Latin America, 2018-2029
Figure 47: Europe Artificial Bone Repair Material Market Value Share (%), By Segment 1, 2022 & 2029
Figure 48: Europe Artificial Bone Repair Material Market Forecast (USD Billion), by Sub-Segment 1, 2018-2029
Figure 49: Europe Artificial Bone Repair Material Market Forecast (USD Billion), by Sub-Segment 2, 2018-2029
Figure 50: Europe Artificial Bone Repair Material Market Value Share (%), By Segment 2, 2022 & 2029
Figure 51: Europe Artificial Bone Repair Material Market Forecast (USD Billion), by Sub-Segment 1, 2018-2029
Figure 52: Europe Artificial Bone Repair Material Market Forecast (USD Billion), by Sub-Segment 2, 2018-2029
Figure 53: Europe Artificial Bone Repair Material Market Forecast (USD Billion), by Sub-Segment 3, 2018-2029
Figure 54: Europe Artificial Bone Repair Material Market Forecast (USD Billion), by Others, 2018-2029
Figure 55: Europe Artificial Bone Repair Material Market Value Share (%), By Segment 3, 2022 & 2029
Figure 56: Europe Artificial Bone Repair Material Market Forecast (USD Billion), by Sub-Segment 1, 2018-2029
Figure 57: Europe Artificial Bone Repair Material Market Forecast (USD Billion), by Sub-Segment 2, 2018-2029
Figure 58: Europe Artificial Bone Repair Material Market Forecast (USD Billion), by Sub-Segment 3, 2018-2029
Figure 59: Europe Artificial Bone Repair Material Market Forecast (USD Billion), by Others, 2018-2029
Figure 60: Europe Artificial Bone Repair Material Market Forecast (USD Billion), by U.K., 2018-2029
Figure 61: Europe Artificial Bone Repair Material Market Forecast (USD Billion), by Germany, 2018-2029
Figure 62: Europe Artificial Bone Repair Material Market Forecast (USD Billion), by France, 2018-2029
Figure 63: Europe Artificial Bone Repair Material Market Forecast (USD Billion), by Italy, 2018-2029
Figure 64: Europe Artificial Bone Repair Material Market Forecast (USD Billion), by Spain, 2018-2029
Figure 65: Europe Artificial Bone Repair Material Market Forecast (USD Billion), by Russia, 2018-2029
Figure 66: Europe Artificial Bone Repair Material Market Forecast (USD Billion), by Rest of Europe, 2018-2029
Figure 67: Asia Pacific Artificial Bone Repair Material Market Value Share (%), By Segment 1, 2022 & 2029
Figure 68: Asia Pacific Artificial Bone Repair Material Market Forecast (USD Billion), by Sub-Segment 1, 2018-2029
Figure 69: Asia Pacific Artificial Bone Repair Material Market Forecast (USD Billion), by Sub-Segment 2, 2018-2029
Figure 70: Asia Pacific Artificial Bone Repair Material Market Value Share (%), By Segment 2, 2022 & 2029
Figure 71: Asia Pacific Artificial Bone Repair Material Market Forecast (USD Billion), by Sub-Segment 1, 2018-2029
Figure 72: Asia Pacific Artificial Bone Repair Material Market Forecast (USD Billion), by Sub-Segment 2, 2018-2029
Figure 73: Asia Pacific Artificial Bone Repair Material Market Forecast (USD Billion), by Sub-Segment 3, 2018-2029
Figure 74: Asia Pacific Artificial Bone Repair Material Market Forecast (USD Billion), by Others, 2018-2029
Figure 75: Asia Pacific Artificial Bone Repair Material Market Value Share (%), By Segment 3, 2022 & 2029
Figure 76: Asia Pacific Artificial Bone Repair Material Market Forecast (USD Billion), by Sub-Segment 1, 2018-2029
Figure 77: Asia Pacific Artificial Bone Repair Material Market Forecast (USD Billion), by Sub-Segment 2, 2018-2029
Figure 78: Asia Pacific Artificial Bone Repair Material Market Forecast (USD Billion), by Sub-Segment 3, 2018-2029
Figure 79: Asia Pacific Artificial Bone Repair Material Market Forecast (USD Billion), by Others, 2018-2029
Figure 80: Asia Pacific Artificial Bone Repair Material Market Forecast (USD Billion), by China, 2018-2029
Figure 81: Asia Pacific Artificial Bone Repair Material Market Forecast (USD Billion), by India, 2018-2029
Figure 82: Asia Pacific Artificial Bone Repair Material Market Forecast (USD Billion), by Japan, 2018-2029
Figure 83: Asia Pacific Artificial Bone Repair Material Market Forecast (USD Billion), by Australia, 2018-2029
Figure 84: Asia Pacific Artificial Bone Repair Material Market Forecast (USD Billion), by Southeast Asia, 2018-2029
Figure 85: Asia Pacific Artificial Bone Repair Material Market Forecast (USD Billion), by Rest of Asia Pacific, 2018-2029
Figure 86: Middle East & Africa Artificial Bone Repair Material Market Value Share (%), By Segment 1, 2022 & 2029
Figure 87: Middle East & Africa Artificial Bone Repair Material Market Forecast (USD Billion), by Sub-Segment 1, 2018-2029
Figure 88: Middle East & Africa Artificial Bone Repair Material Market Forecast (USD Billion), by Sub-Segment 2, 2018-2029
Figure 89: Middle East & Africa Artificial Bone Repair Material Market Value Share (%), By Segment 2, 2022 & 2029
Figure 90: Middle East & Africa Artificial Bone Repair Material Market Forecast (USD Billion), by Sub-Segment 1, 2018-2029
Figure 91: Middle East & Africa Artificial Bone Repair Material Market Forecast (USD Billion), by Sub-Segment 2, 2018-2029
Figure 92: Middle East & Africa Artificial Bone Repair Material Market Forecast (USD Billion), by Sub-Segment 3, 2018-2029
Figure 93: Middle East & Africa Artificial Bone Repair Material Market Forecast (USD Billion), by Others, 2018-2029
Figure 94: Middle East & Africa Artificial Bone Repair Material Market Value Share (%), By Segment 3, 2022 & 2029
Figure 95: Middle East & Africa Artificial Bone Repair Material Market Forecast (USD Billion), by Sub-Segment 1, 2018-2029
Figure 96: Middle East & Africa Artificial Bone Repair Material Market Forecast (USD Billion), by Sub-Segment 2, 2018-2029
Figure 97: Middle East & Africa Artificial Bone Repair Material Market Forecast (USD Billion), by Sub-Segment 3, 2018-2029
Figure 98: Middle East & Africa Artificial Bone Repair Material Market Forecast (USD Billion), by Others, 2018-2029
Figure 99: Middle East & Africa Artificial Bone Repair Material Market Forecast (USD Billion), by GCC, 2018-2029
Figure 100: Middle East & Africa Artificial Bone Repair Material Market Forecast (USD Billion), by South Africa, 2018-2029
Figure 101: Middle East & Africa Artificial Bone Repair Material Market Forecast (USD Billion), by Rest of Middle East & Africa, 2018-2029
List of Tables
Table 1: Global Artificial Bone Repair Material Market Revenue (USD Billion) Forecast, by Segment 1, 2018-2029
Table 2: Global Artificial Bone Repair Material Market Revenue (USD Billion) Forecast, by Segment 2, 2018-2029
Table 3: Global Artificial Bone Repair Material Market Revenue (USD Billion) Forecast, by Segment 3, 2018-2029
Table 4: Global Artificial Bone Repair Material Market Revenue (USD Billion) Forecast, by Region, 2018-2029
Table 5: North America Artificial Bone Repair Material Market Revenue (USD Billion) Forecast, by Segment 1, 2018-2029
Table 6: North America Artificial Bone Repair Material Market Revenue (USD Billion) Forecast, by Segment 2, 2018-2029
Table 7: North America Artificial Bone Repair Material Market Revenue (USD Billion) Forecast, by Segment 3, 2018-2029
Table 8: North America Artificial Bone Repair Material Market Revenue (USD Billion) Forecast, by Country, 2018-2029
Table 9: Europe Artificial Bone Repair Material Market Revenue (USD Billion) Forecast, by Segment 1, 2018-2029
Table 10: Europe Artificial Bone Repair Material Market Revenue (USD Billion) Forecast, by Segment 2, 2018-2029
Table 11: Europe Artificial Bone Repair Material Market Revenue (USD Billion) Forecast, by Segment 3, 2018-2029
Table 12: Europe Artificial Bone Repair Material Market Revenue (USD Billion) Forecast, by Country, 2018-2029
Table 13: Latin America Artificial Bone Repair Material Market Revenue (USD Billion) Forecast, by Segment 1, 2018-2029
Table 14: Latin America Artificial Bone Repair Material Market Revenue (USD Billion) Forecast, by Segment 2, 2018-2029
Table 15: Latin America Artificial Bone Repair Material Market Revenue (USD Billion) Forecast, by Segment 3, 2018-2029
Table 16: Latin America Artificial Bone Repair Material Market Revenue (USD Billion) Forecast, by Country, 2018-2029
Table 17: Asia Pacific Artificial Bone Repair Material Market Revenue (USD Billion) Forecast, by Segment 1, 2018-2029
Table 18: Asia Pacific Artificial Bone Repair Material Market Revenue (USD Billion) Forecast, by Segment 2, 2018-2029
Table 19: Asia Pacific Artificial Bone Repair Material Market Revenue (USD Billion) Forecast, by Segment 3, 2018-2029
Table 20: Asia Pacific Artificial Bone Repair Material Market Revenue (USD Billion) Forecast, by Country, 2018-2029
Table 21: Middle East & Africa Artificial Bone Repair Material Market Revenue (USD Billion) Forecast, by Segment 1, 2018-2029
Table 22: Middle East & Africa Artificial Bone Repair Material Market Revenue (USD Billion) Forecast, by Segment 2, 2018-2029
Table 23: Middle East & Africa Artificial Bone Repair Material Market Revenue (USD Billion) Forecast, by Segment 3, 2018-2029
Table 24: Middle East & Africa Artificial Bone Repair Material Market Revenue (USD Billion) Forecast, by Country, 2018-2029
Research Process
Data Library Research are conducted by industry experts who offer insight on
industry structure, market segmentations technology assessment and competitive landscape (CL), and penetration, as well as on emerging trends. Their analysis is based on primary interviews (~ 80%) and secondary research (~ 20%) as well as years of professional expertise in their respective industries. Adding to this, by analysing historical trends and current market positions, our analysts predict where the market will be headed for the next five years. Furthermore, the varying trends of segment & categories geographically presented are also studied and the estimated based on the primary & secondary research.
In this particular report from the supply side Data Library Research has conducted primary surveys (interviews) with the key level executives (VP, CEO’s, Marketing Director, Business Development Manager
and SOFT) of the companies that active & prominent as well as the midsized organization
FIGURE 1: DLR RESEARH PROCESS
![research-methodology1]()
Primary Research
Extensive primary research was conducted to gain a deeper insight of the market and industry performance. The analysis is based on both primary and secondary research as well as years of professional expertise in the respective industries.
In addition to analysing current and historical trends, our analysts predict where the market is headed over the next five years.
It varies by segment for these categories geographically presented in the list of market tables. Speaking about this particular report we have conducted primary surveys (interviews) with the key level executives (VP, CEO’s, Marketing Director, Business Development Manager and many more) of the major players active in the market.
Secondary Research
Secondary research was mainly used to collect and identify information useful for the extensive, technical, market-oriented, and Friend’s study of the Global Extra Neutral Alcohol. It was also used to obtain key information about major players, market classification and segmentation according to the industry trends, geographical markets, and developments related to the market and technology perspectives. For this study, analysts have gathered information from various credible sources, such as annual reports, sec filings, journals, white papers, SOFT presentations, and company web sites.
Market Size Estimation
Both, top-down and bottom-up approaches were used to estimate and validate the size of the Global market and to estimate the size of various other dependent submarkets in the overall Extra Neutral Alcohol. The key players in the market were identified through secondary research and their market contributions in the respective geographies were determined through primary and secondary research.
Forecast Model
![research-methodology2]()