Artificial Intelligence in Mammography Market Overview and Analysis
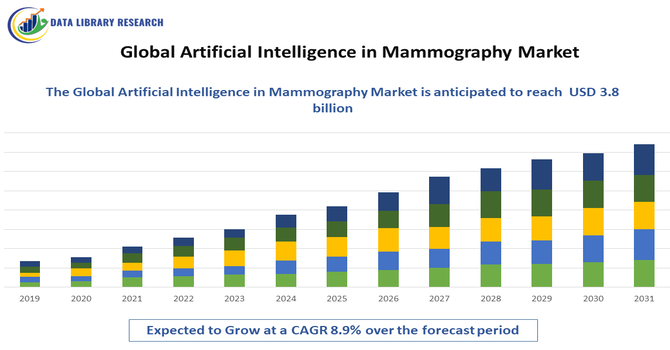
- The global artificial intelligence (AI) in mammography market is currently valued at USD 1.02 billion and is expected to reach USD 3.8 billion by 2032, growing with a CAGR of 8.9% from 2025-2032.
Get Complete Analysis Of The Report - Download Updated Free Sample PDF
The Global Artificial Intelligence (AI) in Mammography Market refers to the adoption of AI-powered technologies in breast imaging, enhancing early cancer detection, improving diagnostic accuracy, streamlining workflows, and supporting personalized risk assessment and decision-making in healthcare systems worldwide. The global artificial intelligence (AI) in mammography market is experiencing significant growth, driven by the increasing prevalence of breast cancer, the demand for improved diagnostic accuracy, and advancements in AI technologies. AI algorithms, particularly those utilizing deep learning, are enhancing the detection and interpretation of mammograms, leading to earlier and more accurate diagnoses. The integration of AI with digital mammography systems is streamlining workflows, reducing radiologist workload, and minimizing human error. Additionally, the growing adoption of AI in healthcare, supported by regulatory approvals and investments in research and development, is further propelling market expansion.
Artificial Intelligence in Mammography Market Latest Trends
The Global Artificial Intelligence in Mammography Market is witnessing several key trends, including the growing integration of deep learning and advanced image recognition algorithms to enhance the accuracy and speed of breast cancer detection. There is an increasing adoption of AI-powered cloud-based platforms that enable remote analysis and collaboration among radiologists. Additionally, hybrid solutions combining AI with 3D mammography (tomosynthesis) are gaining traction, offering improved lesion detection and reduced false positives. The market is also seeing regulatory approvals for AI software in diagnostic workflows and rising investments by healthcare providers to implement AI-driven screening programs, reflecting a shift toward precision medicine and automated diagnostic support.
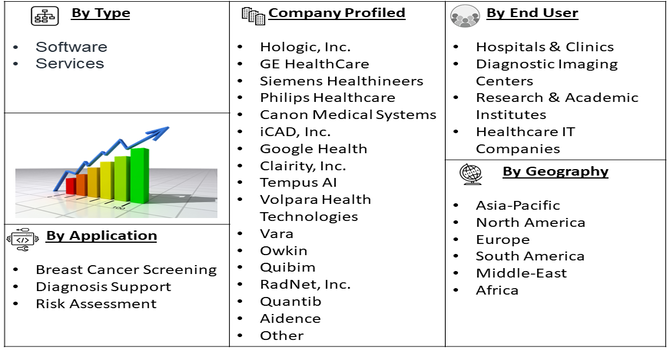
Segmentation: Global Artificial Intelligence in Mammography Market is segmented By Product Type (Software, Services), Application (Breast Cancer Screening, Diagnosis Support, Risk Assessment), End-User (Hospitals & Clinics, Diagnostic Imaging Centers, Research & Academic Institutes, Healthcare IT Companies), and Geography (North America, Europe, Asia-Pacific, Middle East and Africa, and South America). The report provides the value (in USD million) for the above segments.
For Detailed Market Segmentation - Get a Free Sample PDF
Market Drivers:
- Increasing Prevalence of Breast Cancer
The rising global incidence of breast cancer is a primary driver for the AI in mammography market. Early and accurate detection of breast cancer is critical for improving patient outcomes, and traditional mammography methods often face limitations in sensitivity and specificity. AI-powered mammography systems leverage advanced algorithms and deep learning techniques to analyze imaging data more precisely, helping radiologists detect tumors at an earlier stage, differentiate malignant from benign lesions, and reduce false positives and negatives. As awareness of breast cancer screening grows and national healthcare programs emphasize early detection, the demand for AI-assisted mammography solutions is rapidly increasing.
- Advancements in AI and Integration with Healthcare Systems
Technological advancements in artificial intelligence, particularly in machine learning and image recognition, are enhancing the performance and reliability of mammography systems. Integration of AI into digital mammography workflows allows automated analysis, faster reporting, and improved diagnostic accuracy, which reduces radiologist workload and operational inefficiencies.
In June 2025, the FDA granted De Novo authorization for CLAIRITY BREAST, a first-in-class platform that predicted a woman’s 5-year breast cancer risk using routine screening mammography images and an AI model. The platform, authorized as Allix5, analyzed subtle imaging features invisible to the human eye to generate validated risk scores for healthcare professionals, supporting early risk prediction and personalized care. This innovation strengthened the Global Artificial Intelligence in Mammography market, driving adoption of advanced AI tools for proactive breast cancer detection and risk assessment worldwide. Thus, continuous innovation and regulatory approvals for AI-driven diagnostic tools are further encouraging adoption, driving the growth of the global market.
Market Restraints
The growth of the AI in mammography market is restrained by several factors. High implementation and maintenance costs of AI-enabled mammography systems can limit adoption, particularly in developing regions and smaller healthcare facilities. Data privacy and security concerns regarding sensitive patient information pose regulatory and operational challenges, especially with cloud-based AI platforms. Additionally, resistance from healthcare professionals due to trust issues, lack of awareness, or limited expertise in AI technologies can slow integration into clinical workflows. Variability in regulatory approvals across regions and the need for extensive validation of AI algorithms to ensure diagnostic accuracy also act as significant barriers to widespread adoption.
Socio economic Impact on Artificial Intelligence in Mammography Market
The Global Artificial Intelligence (AI) in Mammography Market has profound socioeconomic impacts by enhancing early detection, diagnosis, and treatment of breast cancer, ultimately improving patient outcomes and reducing healthcare costs. AI-powered mammography systems increase diagnostic accuracy, minimize human error, and streamline workflow, enabling radiologists to handle higher volumes efficiently. This technological advancement creates employment opportunities in AI development, healthcare IT, and clinical research, while promoting innovation in medical imaging. Improved early detection also reduces treatment costs and long-term healthcare burdens, benefiting patients and healthcare systems alike. As AI adoption grows globally, it contributes to health equity by expanding access to quality diagnostics, drives economic growth through technology commercialization, and strengthens public health infrastructure worldwide.
Segmental Analysis:
- Software segment is expected to witness highest growth over the forecast period
The software segment dominates the market as AI algorithms embedded in mammography software enable automated image analysis, early cancer detection, and improved diagnostic accuracy. Healthcare providers prefer software solutions due to their scalability, integration capabilities with existing imaging systems, and ability to provide real-time decision support to radiologists. Moreover, the software segment benefits from continuous advancements in machine learning and deep learning models, which enhance the accuracy and efficiency of mammogram interpretation. These solutions reduce radiologist workload, minimize human error, and streamline clinical workflows, making them highly attractive to hospitals, diagnostic centers, and imaging clinics. As AI adoption grows, software platforms also enable data-driven insights and predictive analytics, further supporting personalized patient care and driving sustained growth in the Global Artificial Intelligence in Mammography market.
- Breast Cancer Screening segment is expected to witness highest growth over the forecast period
Breast cancer screening is the largest application segment, driven by the increasing global incidence of breast cancer and growing emphasis on early detection programs. AI-assisted screening enhances sensitivity and specificity, reduces false positives, and accelerates workflow efficiency, making it critical for routine mammography practices.
Additionally, diagnostic and risk assessment applications are rapidly gaining traction, as AI enables personalized evaluation of patient risk profiles and earlier identification of potential malignancies. By analyzing historical imaging data alongside demographic and clinical factors, AI tools support more informed clinical decisions and tailored follow-up strategies. This expansion beyond routine screening strengthens the overall adoption of AI in mammography, driving innovation and contributing significantly to the growth of the Global Artificial Intelligence in Mammography market.
- Hospitals & Clinics segment is expected to witness highest growth over the forecast period
Hospitals and clinics represent the primary end-users of AI in mammography solutions, as they require efficient and accurate diagnostic tools to manage high patient volumes. Adoption in these settings is driven by the need to improve patient outcomes, optimize radiologist productivity, and comply with standardized screening protocols.
- North America region is expected to witness highest growth over the forecast period
The North America region is expected to witness the highest growth in the Artificial Intelligence in Mammography market over the forecast period, driven by the presence of advanced healthcare infrastructure, high adoption of digital and AI-enabled diagnostic technologies, and growing awareness of breast cancer screening.
The region benefits from supportive regulatory frameworks, substantial investments in research and development, and early implementation of AI-driven mammography solutions in hospitals and diagnostic centers. For instance, in September 2025, Axia Women's Health announced that it had begun offering an FDA-cleared artificial intelligence (AI) technology with every mammogram at no cost to patients, demonstrating its commitment to enhancing access to earlier and more accurate breast cancer detection. The technology, MammoScreen, served as a “second set of eyes” for radiologists, providing a dual-read approach for every mammogram. Retrospective studies showed that MammoScreen detected 38.5% of screen-detectable cancers up to two years before diagnosis. This adoption strengthened North America’s AI in Mammography market, driving demand for advanced diagnostic tools and supporting regional growth in precision imaging solutions.
Additionally, the rising prevalence of breast cancer and the need for accurate, efficient, and early detection solutions are further accelerating the adoption of AI in mammography, solidifying North America as a key market for growth. For instance, in June 2023, the National Breast Cancer Foundation reported that one in eight women in the United States would be diagnosed with breast cancer in her lifetime. By 2025, an estimated 316,950 women and 2,800 men were projected to be diagnosed with invasive breast cancer, along with 59,080 new cases of non-invasive (in situ) breast cancer. This high prevalence underscored the critical need for advanced diagnostic tools, driving growth in North America’s Artificial Intelligence in Mammography market as healthcare providers increasingly adopted AI solutions for early detection and improved patient outcomes. Thus, such factors are driving the growth of above market in this region.
| Report Matrics |
Details |
| Market Size Value |
USD 3.8 billion |
| Growth Rate |
CAGR of 8.9% |
| Forecast |
2026-2033 |
| Historical data |
2021-2024 |
| Base Year |
2025 |
| Report Coverage |
Forecasted revenue, company rating, competitive environment, growth drivers, and trends |
| Segment Coverage |
Type, Application, End-User, Geography |
| Regional Scope |
North America, Europe, Asia Pacific, Middle East |
| Customized scope |
Free customization of reports (With 3 months Analysis Support ) |
| To Learn More About This Report |
Request a Free Sample Copy |
Artificial Intelligence in Mammography Market Competitive Landscape
The global artificial intelligence (AI) in mammography market is characterized by a dynamic and competitive landscape, featuring a blend of established medical imaging companies, innovative AI startups, and academic institutions. These entities are actively developing and deploying AI-driven solutions to enhance breast cancer detection, improve diagnostic accuracy, and streamline radiology workflows. Key players are focusing on advancements in deep learning algorithms, integration with digital mammography systems, and obtaining regulatory approvals to expand their market presence.
Notable Companies in the AI Mammography Market
- Hologic, Inc.
- GE HealthCare
- Siemens Healthineers
- Philips Healthcare
- Canon Medical Systems
- iCAD, Inc.
- Google Health
- Clairity, Inc.
- Tempus AI
- Volpara Health Technologies
- Vara
- Owkin
- Quibim
- RadNet, Inc.
- DeepHealth
- Kheiron Medical Technologies
- Quantib
- Aidence
- Zebra Medical Vision
- Aidoc
Recent Development
- In September 2025, nationwide research examined the impact of AI on mammogram accuracy and patient experience. UC Davis Health co-led a newly funded national clinical trial, the PRISM trial (Pragmatic Randomized Trial of Artificial Intelligence for Screening Mammography), supported by a USD 16 million PCORI award. The study evaluated whether AI could help radiologists interpret screening mammograms more accurately, aiming to improve breast cancer detection and reduce unnecessary callbacks and patient anxiety. It analyzed hundreds of thousands of mammograms across academic medical centers and breast imaging facilities in California, Florida, Massachusetts, Washington, and Wisconsin.
- In May 2025, The Mount Sinai Health System launched its annual Mount Sinai Mammogram May, a month-long awareness campaign encouraging women across New York City and beyond to prioritize breast health through annual screenings and promote the message that early detection saves lives. Despite medical advances, breast cancer remained the second leading cause of cancer death among women, after lung cancer. The campaign emphasized that early detection makes breast cancer highly treatable and that regular screenings, recommended annually from age 40, are the best defense.
Frequently Asked Questions (FAQ) :
Q1. What are the main growth-driving factors for this market?
The primary driver is the alarming global increase in breast cancer prevalence, which heightens the urgency for early and accurate detection. AI is vital because it significantly enhances diagnostic accuracy, reduces the rate of false positives, and efficiently manages the high volume of mammography screenings. Furthermore, the global shortage of skilled radiologists means healthcare providers are increasingly adopting AI tools to help prioritize high-risk cases and optimize radiologist workflow.
Q2. What are the main restraining factors for this market?
Key restraints include significant concerns regarding data security and patient privacy when handling large volumes of sensitive medical images and patient information. High initial implementation costs, particularly for the necessary advanced computing infrastructure and integration software, also limit adoption in budget-constrained facilities. Furthermore, a lack of consistent performance and limited generalizability of some AI algorithms across diverse patient demographics and clinical settings create trust issues among healthcare providers.
Q3. Which segment is expected to witness high growth?
The Software/Solution segment, which includes the AI algorithms and platforms themselves, is expected to witness the highest growth. This is driven by continuous advancements in Deep Learning and Machine Learning that enhance the precision of cancer detection and risk prediction. By application, the Diagnostics segment is projected to grow rapidly, as AI shifts from merely screening support to providing more conclusive decision-support tools for radiologists in complex case analysis.
Q4. Who are the top major players for this market?
The market is led by major medical imaging original equipment manufacturers (OEMs) and specialized AI health-tech companies. Top major players include Hologic Inc., GE HealthCare, Siemens Healthineers, and Koninklijke Philips N.V. Specialized AI companies like iCAD (with its ProFound AI suite) and Google Health are also crucial, often forming partnerships with OEMs to integrate their sophisticated detection and triage algorithms directly into mammography systems.
Q5. Which country is the largest player?
North America, with the United States as the dominant country, holds the largest market share by revenue. This leadership is attributed to a combination of factors: high breast cancer screening adoption rates, significant healthcare expenditure, a mature healthcare infrastructure that facilitates the rapid deployment of new technologies, and a regulatory environment that has successfully cleared multiple AI-powered diagnostic tools for clinical use.
List of Figures
Figure 1: Global Artificial Intelligence in Mammography Market Revenue Breakdown (USD Billion, %) by Region, 2022 & 2029
Figure 2: Global Artificial Intelligence in Mammography Market Value Share (%), By Segment 1, 2022 & 2029
Figure 3: Global Artificial Intelligence in Mammography Market Forecast (USD Billion), by Sub-Segment 1, 2018-2029
Figure 4: Global Artificial Intelligence in Mammography Market Forecast (USD Billion), by Sub-Segment 2, 2018-2029
Figure 5: Global Artificial Intelligence in Mammography Market Value Share (%), By Segment 2, 2022 & 2029
Figure 6: Global Artificial Intelligence in Mammography Market Forecast (USD Billion), by Sub-Segment 1, 2018-2029
Figure 7: Global Artificial Intelligence in Mammography Market Forecast (USD Billion), by Sub-Segment 2, 2018-2029
Figure 8: Global Artificial Intelligence in Mammography Market Forecast (USD Billion), by Sub-Segment 3, 2018-2029
Figure 9: Global Artificial Intelligence in Mammography Market Forecast (USD Billion), by Others, 2018-2029
Figure 10: Global Artificial Intelligence in Mammography Market Value Share (%), By Segment 3, 2022 & 2029
Figure 11: Global Artificial Intelligence in Mammography Market Forecast (USD Billion), by Sub-Segment 1, 2018-2029
Figure 12: Global Artificial Intelligence in Mammography Market Forecast (USD Billion), by Sub-Segment 2, 2018-2029
Figure 13: Global Artificial Intelligence in Mammography Market Forecast (USD Billion), by Sub-Segment 3, 2018-2029
Figure 14: Global Artificial Intelligence in Mammography Market Forecast (USD Billion), by Others, 2018-2029
Figure 15: Global Artificial Intelligence in Mammography Market Value (USD Billion), by Region, 2022 & 2029
Figure 16: North America Artificial Intelligence in Mammography Market Value Share (%), By Segment 1, 2022 & 2029
Figure 17: North America Artificial Intelligence in Mammography Market Forecast (USD Billion), by Sub-Segment 1, 2018-2029
Figure 18: North America Artificial Intelligence in Mammography Market Forecast (USD Billion), by Sub-Segment 2, 2018-2029
Figure 19: North America Artificial Intelligence in Mammography Market Value Share (%), By Segment 2, 2022 & 2029
Figure 20: North America Artificial Intelligence in Mammography Market Forecast (USD Billion), by Sub-Segment 1, 2018-2029
Figure 21: North America Artificial Intelligence in Mammography Market Forecast (USD Billion), by Sub-Segment 2, 2018-2029
Figure 22: North America Artificial Intelligence in Mammography Market Forecast (USD Billion), by Sub-Segment 3, 2018-2029
Figure 23: North America Artificial Intelligence in Mammography Market Forecast (USD Billion), by Others, 2018-2029
Figure 24: North America Artificial Intelligence in Mammography Market Value Share (%), By Segment 3, 2022 & 2029
Figure 25: North America Artificial Intelligence in Mammography Market Forecast (USD Billion), by Sub-Segment 1, 2018-2029
Figure 26: North America Artificial Intelligence in Mammography Market Forecast (USD Billion), by Sub-Segment 2, 2018-2029
Figure 27: North America Artificial Intelligence in Mammography Market Forecast (USD Billion), by Sub-Segment 3, 2018-2029
Figure 28: North America Artificial Intelligence in Mammography Market Forecast (USD Billion), by Others, 2018-2029
Figure 29: North America Artificial Intelligence in Mammography Market Forecast (USD Billion), by U.S., 2018-2029
Figure 30: North America Artificial Intelligence in Mammography Market Forecast (USD Billion), by Canada, 2018-2029
Figure 31: Latin America Artificial Intelligence in Mammography Market Value Share (%), By Segment 1, 2022 & 2029
Figure 32: Latin America Artificial Intelligence in Mammography Market Forecast (USD Billion), by Sub-Segment 1, 2018-2029
Figure 33: Latin America Artificial Intelligence in Mammography Market Forecast (USD Billion), by Sub-Segment 2, 2018-2029
Figure 34: Latin America Artificial Intelligence in Mammography Market Value Share (%), By Segment 2, 2022 & 2029
Figure 35: Latin America Artificial Intelligence in Mammography Market Forecast (USD Billion), by Sub-Segment 1, 2018-2029
Figure 36: Latin America Artificial Intelligence in Mammography Market Forecast (USD Billion), by Sub-Segment 2, 2018-2029
Figure 37: Latin America Artificial Intelligence in Mammography Market Forecast (USD Billion), by Sub-Segment 3, 2018-2029
Figure 38: Latin America Artificial Intelligence in Mammography Market Forecast (USD Billion), by Others, 2018-2029
Figure 39: Latin America Artificial Intelligence in Mammography Market Value Share (%), By Segment 3, 2022 & 2029
Figure 40: Latin America Artificial Intelligence in Mammography Market Forecast (USD Billion), by Sub-Segment 1, 2018-2029
Figure 41: Latin America Artificial Intelligence in Mammography Market Forecast (USD Billion), by Sub-Segment 2, 2018-2029
Figure 42: Latin America Artificial Intelligence in Mammography Market Forecast (USD Billion), by Sub-Segment 3, 2018-2029
Figure 43: Latin America Artificial Intelligence in Mammography Market Forecast (USD Billion), by Others, 2018-2029
Figure 44: Latin America Artificial Intelligence in Mammography Market Forecast (USD Billion), by Brazil, 2018-2029
Figure 45: Latin America Artificial Intelligence in Mammography Market Forecast (USD Billion), by Mexico, 2018-2029
Figure 46: Latin America Artificial Intelligence in Mammography Market Forecast (USD Billion), by Rest of Latin America, 2018-2029
Figure 47: Europe Artificial Intelligence in Mammography Market Value Share (%), By Segment 1, 2022 & 2029
Figure 48: Europe Artificial Intelligence in Mammography Market Forecast (USD Billion), by Sub-Segment 1, 2018-2029
Figure 49: Europe Artificial Intelligence in Mammography Market Forecast (USD Billion), by Sub-Segment 2, 2018-2029
Figure 50: Europe Artificial Intelligence in Mammography Market Value Share (%), By Segment 2, 2022 & 2029
Figure 51: Europe Artificial Intelligence in Mammography Market Forecast (USD Billion), by Sub-Segment 1, 2018-2029
Figure 52: Europe Artificial Intelligence in Mammography Market Forecast (USD Billion), by Sub-Segment 2, 2018-2029
Figure 53: Europe Artificial Intelligence in Mammography Market Forecast (USD Billion), by Sub-Segment 3, 2018-2029
Figure 54: Europe Artificial Intelligence in Mammography Market Forecast (USD Billion), by Others, 2018-2029
Figure 55: Europe Artificial Intelligence in Mammography Market Value Share (%), By Segment 3, 2022 & 2029
Figure 56: Europe Artificial Intelligence in Mammography Market Forecast (USD Billion), by Sub-Segment 1, 2018-2029
Figure 57: Europe Artificial Intelligence in Mammography Market Forecast (USD Billion), by Sub-Segment 2, 2018-2029
Figure 58: Europe Artificial Intelligence in Mammography Market Forecast (USD Billion), by Sub-Segment 3, 2018-2029
Figure 59: Europe Artificial Intelligence in Mammography Market Forecast (USD Billion), by Others, 2018-2029
Figure 60: Europe Artificial Intelligence in Mammography Market Forecast (USD Billion), by U.K., 2018-2029
Figure 61: Europe Artificial Intelligence in Mammography Market Forecast (USD Billion), by Germany, 2018-2029
Figure 62: Europe Artificial Intelligence in Mammography Market Forecast (USD Billion), by France, 2018-2029
Figure 63: Europe Artificial Intelligence in Mammography Market Forecast (USD Billion), by Italy, 2018-2029
Figure 64: Europe Artificial Intelligence in Mammography Market Forecast (USD Billion), by Spain, 2018-2029
Figure 65: Europe Artificial Intelligence in Mammography Market Forecast (USD Billion), by Russia, 2018-2029
Figure 66: Europe Artificial Intelligence in Mammography Market Forecast (USD Billion), by Rest of Europe, 2018-2029
Figure 67: Asia Pacific Artificial Intelligence in Mammography Market Value Share (%), By Segment 1, 2022 & 2029
Figure 68: Asia Pacific Artificial Intelligence in Mammography Market Forecast (USD Billion), by Sub-Segment 1, 2018-2029
Figure 69: Asia Pacific Artificial Intelligence in Mammography Market Forecast (USD Billion), by Sub-Segment 2, 2018-2029
Figure 70: Asia Pacific Artificial Intelligence in Mammography Market Value Share (%), By Segment 2, 2022 & 2029
Figure 71: Asia Pacific Artificial Intelligence in Mammography Market Forecast (USD Billion), by Sub-Segment 1, 2018-2029
Figure 72: Asia Pacific Artificial Intelligence in Mammography Market Forecast (USD Billion), by Sub-Segment 2, 2018-2029
Figure 73: Asia Pacific Artificial Intelligence in Mammography Market Forecast (USD Billion), by Sub-Segment 3, 2018-2029
Figure 74: Asia Pacific Artificial Intelligence in Mammography Market Forecast (USD Billion), by Others, 2018-2029
Figure 75: Asia Pacific Artificial Intelligence in Mammography Market Value Share (%), By Segment 3, 2022 & 2029
Figure 76: Asia Pacific Artificial Intelligence in Mammography Market Forecast (USD Billion), by Sub-Segment 1, 2018-2029
Figure 77: Asia Pacific Artificial Intelligence in Mammography Market Forecast (USD Billion), by Sub-Segment 2, 2018-2029
Figure 78: Asia Pacific Artificial Intelligence in Mammography Market Forecast (USD Billion), by Sub-Segment 3, 2018-2029
Figure 79: Asia Pacific Artificial Intelligence in Mammography Market Forecast (USD Billion), by Others, 2018-2029
Figure 80: Asia Pacific Artificial Intelligence in Mammography Market Forecast (USD Billion), by China, 2018-2029
Figure 81: Asia Pacific Artificial Intelligence in Mammography Market Forecast (USD Billion), by India, 2018-2029
Figure 82: Asia Pacific Artificial Intelligence in Mammography Market Forecast (USD Billion), by Japan, 2018-2029
Figure 83: Asia Pacific Artificial Intelligence in Mammography Market Forecast (USD Billion), by Australia, 2018-2029
Figure 84: Asia Pacific Artificial Intelligence in Mammography Market Forecast (USD Billion), by Southeast Asia, 2018-2029
Figure 85: Asia Pacific Artificial Intelligence in Mammography Market Forecast (USD Billion), by Rest of Asia Pacific, 2018-2029
Figure 86: Middle East & Africa Artificial Intelligence in Mammography Market Value Share (%), By Segment 1, 2022 & 2029
Figure 87: Middle East & Africa Artificial Intelligence in Mammography Market Forecast (USD Billion), by Sub-Segment 1, 2018-2029
Figure 88: Middle East & Africa Artificial Intelligence in Mammography Market Forecast (USD Billion), by Sub-Segment 2, 2018-2029
Figure 89: Middle East & Africa Artificial Intelligence in Mammography Market Value Share (%), By Segment 2, 2022 & 2029
Figure 90: Middle East & Africa Artificial Intelligence in Mammography Market Forecast (USD Billion), by Sub-Segment 1, 2018-2029
Figure 91: Middle East & Africa Artificial Intelligence in Mammography Market Forecast (USD Billion), by Sub-Segment 2, 2018-2029
Figure 92: Middle East & Africa Artificial Intelligence in Mammography Market Forecast (USD Billion), by Sub-Segment 3, 2018-2029
Figure 93: Middle East & Africa Artificial Intelligence in Mammography Market Forecast (USD Billion), by Others, 2018-2029
Figure 94: Middle East & Africa Artificial Intelligence in Mammography Market Value Share (%), By Segment 3, 2022 & 2029
Figure 95: Middle East & Africa Artificial Intelligence in Mammography Market Forecast (USD Billion), by Sub-Segment 1, 2018-2029
Figure 96: Middle East & Africa Artificial Intelligence in Mammography Market Forecast (USD Billion), by Sub-Segment 2, 2018-2029
Figure 97: Middle East & Africa Artificial Intelligence in Mammography Market Forecast (USD Billion), by Sub-Segment 3, 2018-2029
Figure 98: Middle East & Africa Artificial Intelligence in Mammography Market Forecast (USD Billion), by Others, 2018-2029
Figure 99: Middle East & Africa Artificial Intelligence in Mammography Market Forecast (USD Billion), by GCC, 2018-2029
Figure 100: Middle East & Africa Artificial Intelligence in Mammography Market Forecast (USD Billion), by South Africa, 2018-2029
Figure 101: Middle East & Africa Artificial Intelligence in Mammography Market Forecast (USD Billion), by Rest of Middle East & Africa, 2018-2029
List of Tables
Table 1: Global Artificial Intelligence in Mammography Market Revenue (USD Billion) Forecast, by Segment 1, 2018-2029
Table 2: Global Artificial Intelligence in Mammography Market Revenue (USD Billion) Forecast, by Segment 2, 2018-2029
Table 3: Global Artificial Intelligence in Mammography Market Revenue (USD Billion) Forecast, by Segment 3, 2018-2029
Table 4: Global Artificial Intelligence in Mammography Market Revenue (USD Billion) Forecast, by Region, 2018-2029
Table 5: North America Artificial Intelligence in Mammography Market Revenue (USD Billion) Forecast, by Segment 1, 2018-2029
Table 6: North America Artificial Intelligence in Mammography Market Revenue (USD Billion) Forecast, by Segment 2, 2018-2029
Table 7: North America Artificial Intelligence in Mammography Market Revenue (USD Billion) Forecast, by Segment 3, 2018-2029
Table 8: North America Artificial Intelligence in Mammography Market Revenue (USD Billion) Forecast, by Country, 2018-2029
Table 9: Europe Artificial Intelligence in Mammography Market Revenue (USD Billion) Forecast, by Segment 1, 2018-2029
Table 10: Europe Artificial Intelligence in Mammography Market Revenue (USD Billion) Forecast, by Segment 2, 2018-2029
Table 11: Europe Artificial Intelligence in Mammography Market Revenue (USD Billion) Forecast, by Segment 3, 2018-2029
Table 12: Europe Artificial Intelligence in Mammography Market Revenue (USD Billion) Forecast, by Country, 2018-2029
Table 13: Latin America Artificial Intelligence in Mammography Market Revenue (USD Billion) Forecast, by Segment 1, 2018-2029
Table 14: Latin America Artificial Intelligence in Mammography Market Revenue (USD Billion) Forecast, by Segment 2, 2018-2029
Table 15: Latin America Artificial Intelligence in Mammography Market Revenue (USD Billion) Forecast, by Segment 3, 2018-2029
Table 16: Latin America Artificial Intelligence in Mammography Market Revenue (USD Billion) Forecast, by Country, 2018-2029
Table 17: Asia Pacific Artificial Intelligence in Mammography Market Revenue (USD Billion) Forecast, by Segment 1, 2018-2029
Table 18: Asia Pacific Artificial Intelligence in Mammography Market Revenue (USD Billion) Forecast, by Segment 2, 2018-2029
Table 19: Asia Pacific Artificial Intelligence in Mammography Market Revenue (USD Billion) Forecast, by Segment 3, 2018-2029
Table 20: Asia Pacific Artificial Intelligence in Mammography Market Revenue (USD Billion) Forecast, by Country, 2018-2029
Table 21: Middle East & Africa Artificial Intelligence in Mammography Market Revenue (USD Billion) Forecast, by Segment 1, 2018-2029
Table 22: Middle East & Africa Artificial Intelligence in Mammography Market Revenue (USD Billion) Forecast, by Segment 2, 2018-2029
Table 23: Middle East & Africa Artificial Intelligence in Mammography Market Revenue (USD Billion) Forecast, by Segment 3, 2018-2029
Table 24: Middle East & Africa Artificial Intelligence in Mammography Market Revenue (USD Billion) Forecast, by Country, 2018-2029
Research Process
Data Library Research are conducted by industry experts who offer insight on
industry structure, market segmentations technology assessment and competitive landscape (CL), and penetration, as well as on emerging trends. Their analysis is based on primary interviews (~ 80%) and secondary research (~ 20%) as well as years of professional expertise in their respective industries. Adding to this, by analysing historical trends and current market positions, our analysts predict where the market will be headed for the next five years. Furthermore, the varying trends of segment & categories geographically presented are also studied and the estimated based on the primary & secondary research.
In this particular report from the supply side Data Library Research has conducted primary surveys (interviews) with the key level executives (VP, CEO’s, Marketing Director, Business Development Manager
and SOFT) of the companies that active & prominent as well as the midsized organization
FIGURE 1: DLR RESEARH PROCESS
![research-methodology1]()
Primary Research
Extensive primary research was conducted to gain a deeper insight of the market and industry performance. The analysis is based on both primary and secondary research as well as years of professional expertise in the respective industries.
In addition to analysing current and historical trends, our analysts predict where the market is headed over the next five years.
It varies by segment for these categories geographically presented in the list of market tables. Speaking about this particular report we have conducted primary surveys (interviews) with the key level executives (VP, CEO’s, Marketing Director, Business Development Manager and many more) of the major players active in the market.
Secondary Research
Secondary research was mainly used to collect and identify information useful for the extensive, technical, market-oriented, and Friend’s study of the Global Extra Neutral Alcohol. It was also used to obtain key information about major players, market classification and segmentation according to the industry trends, geographical markets, and developments related to the market and technology perspectives. For this study, analysts have gathered information from various credible sources, such as annual reports, sec filings, journals, white papers, SOFT presentations, and company web sites.
Market Size Estimation
Both, top-down and bottom-up approaches were used to estimate and validate the size of the Global market and to estimate the size of various other dependent submarkets in the overall Extra Neutral Alcohol. The key players in the market were identified through secondary research and their market contributions in the respective geographies were determined through primary and secondary research.
Forecast Model
![research-methodology2]()