Automatic Pot Filling Machine Market Overview and Analysis
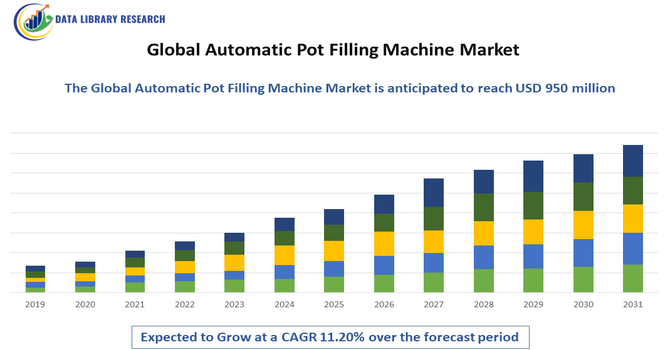
- The Global Automatic Pot Filling Machine Market is forecasted to reach approximately USD 950 million by 2032 from an estimated USD 467.8 million in 2025. This growth is driven by increasing automation in horticulture and agriculture, advancing at a strong Compound Annual Growth Rate (CAGR) of 11.20%. 2025-2032.
Get Complete Analysis Of The Report - Download Updated Free Sample PDF
The Global Automatic Pot Filling Machine Market is experiencing strong growth, driven primarily by the rising demand for automation in horticulture, nursery operations, and commercial plant production. As growers increasingly shift toward high-efficiency, labor-saving solutions, automatic pot filling machines offer consistent soil dispensing, improved throughput, and reduced manual workload. The expansion of greenhouse farming, landscaping services, and ornamental plant cultivation further boosts adoption.
Automatic Pot Filling Machine Market Latest Trends
The global automatic pot filling machine market is increasingly shaped by the integration of smart technologies, with many new systems featuring IoT-enabled sensors for real-time monitoring of soil density, moisture, and compaction — improving potting consistency and reducing waste. At the same time, there’s a shift toward modular and flexible potting solutions that can be reconfigured for different pot sizes and soil types, making them more attractive to nurseries, greenhouse operators, and commercial farms with varying production needs. Further, rising labor costs and labor shortages worldwide are pushing growers to adopt fully automated pot filling machines to maintain productivity and scale up operations — a trend particularly strong in large-scale nurseries and commercial horticulture.
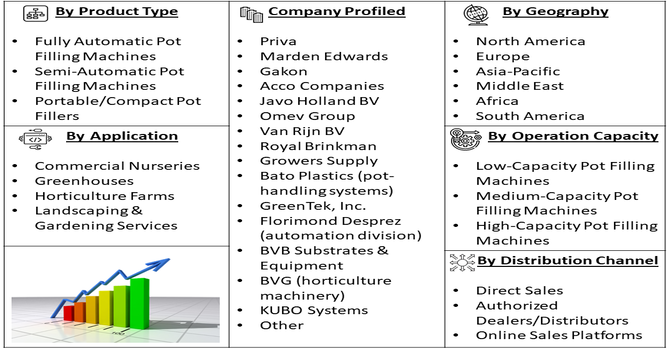
Segmentation: Global Automatic Pot Filling Machine Market is segmented By Machine Type (Fully Automatic Pot Filling Machines, Semi-Automatic Pot Filling Machines, Portable/Compact Pot Fillers), Pot Size Compatibility (Small Pot Filling Machines, Medium Pot Filling Machines, Large Pot Filling Machines), Operation Capacity (Low-Capacity Pot Filling Machines, Medium-Capacity Pot Filling Machines, High-Capacity Pot Filling Machines), Application (Commercial Nurseries, Greenhouses, Horticulture Farms, Landscaping & Gardening Services), Distribution Channel (Direct Sales, Authorized Dealers/Distributors, Online Sales Platforms), and Geography (North America, Europe, Asia-Pacific, Middle East and Africa, and South America). The report provides the value (in USD million) for the above segments.
For Detailed Market Segmentation - Get a Free Sample PDF
Market Drivers:
- Rising Labor Shortages and Increasing Labor Costs in Horticulture
A major driver for the automatic pot filling machine market is the growing labor shortage in the horticulture and nursery industry. Potting is a labor-intensive activity that requires speed, consistency, and repetitive manual work. Many regions, particularly North America and Europe, are facing workforce shortages due to aging agricultural labor populations and decreasing interest among younger workers. As labor costs continue to rise, nurseries and greenhouse operators are increasingly turning to automation to maintain productivity and reduce dependence on manual labor. Automatic pot filling machines significantly reduce operational labor requirements, increase throughput, and provide consistent potting quality, making them an essential investment for large-scale operations seeking efficiency and cost savings.
- Expansion of Commercial Greenhouses and Controlled Environment Agriculture
The rapid growth of commercial greenhouses, vertical farms, and controlled-environment agriculture (CEA) is further accelerating market demand. These modern cultivation systems rely heavily on precision, speed, and uniformity—attributes that automatic pot filling machines are designed to deliver. As global interest in high-value crops, ornamental plants, medicinal plants, and indoor farming rises, growers require equipment that can handle large-scale potting with exact soil density, optimal compaction, and minimal waste. The adoption of advanced horticulture automation technologies, including conveyor-integrated pot fillers and IoT-enabled systems, is helping producers scale operations quickly while ensuring consistent plant growth conditions. This trend is creating strong demand for automated pot filling solutions worldwide.
Market Restraints:
- High Initial Investment and Maintenance Costs
One of the major restraints for the market is the high upfront cost associated with purchasing advanced automatic pot filling machines. These systems often require significant capital investment, especially in the case of fully automated, high-capacity models equipped with conveyors, sensors, and integration capabilities. For small and medium-sized nurseries or local horticulture businesses, the initial expense can be a barrier to adoption. Additionally, ongoing maintenance, replacement of mechanical components, and the need for occasional technical servicing add to operational costs, making the machines less accessible for budget-constrained growers. This financial challenge slows market penetration, particularly in developing regions.
Socioeconomic Impact on Automatic Pot Filling Machine Market
The global automatic pot filling machine market has significant socioeconomic impacts by improving efficiency, reducing labor dependency, and supporting industrial growth across food processing and manufacturing sectors. Automation reduces repetitive manual work, enhancing worker safety and productivity while lowering operational costs for businesses. Increased mechanization facilitates higher production rates and consistent quality, supporting the expansion of small and medium-sized enterprises and creating indirect employment in machine maintenance, logistics, and supply chains. Additionally, by enabling faster, scalable food production, these machines contribute to food security and affordability. Collectively, the market supports economic development, technological adoption, and social well-being in industrialized and emerging regions.
Segmental Analysis:
- Fully Automatic Pot Filling Machines segment is expected to witness the highest growth over the forecast period
Fully Automatic Pot Filling Machines dominate due to their ability to automate the entire pot-filling process—from soil feeding and leveling to pot conveying—without manual intervention. These machines are widely preferred in large-scale nurseries and commercial horticulture setups where high precision, uniformity, and speed are required. Their advanced features reduce labor cost, enhance operational efficiency, and ensure consistent potting quality, making them a key growth contributor.
- Medium Pot Filling Machines segment is expected to witness the highest growth over the forecast period
Medium Pot Filling Machines are widely adopted because they support mid-sized pots commonly used in commercial nurseries and greenhouse crop production. Their versatility makes them suitable for a broad range of plants, including ornamentals, vegetables, and saplings. These machines offer the right balance between capacity and flexibility, making them ideal for both mid-sized farms and rapidly expanding horticulture businesses.
- High-Capacity Pot Filling Machines segment is expected to witness the highest growth over the forecast period
High-Capacity Pot Filling Machines are gaining significant traction as large horticulture and greenhouse operations demand faster processing speeds. These machines can fill thousands of pots per hour, significantly improving throughput and reducing downtime. They are particularly valuable for large-scale growers aiming to optimize productivity and meet seasonal or bulk planting demands efficiently.
- Commercial Nurseries segment is expected to witness the highest growth over the forecast period
Commercial Nurseries represent the largest application segment due to their high-volume potting activities and continuous demand for efficiency. These facilities rely heavily on automation to maintain consistent production quality and manage labor shortages. Automatic pot filling machines help nurseries scale operations, reduce errors, and accelerate planting cycles, making them a crucial asset for business growth.
- Direct Sales segment is expected to witness the highest growth over the forecast period
Direct Sales remain the preferred distribution channel as buyers often require customized machine configurations, installation support, and after-sales services. Manufacturers engage directly with commercial growers to provide tailored solutions, ensuring proper machine integration into existing workflows. The direct interaction builds trust and allows for better technical guidance, encouraging long-term customer relationships.
- North America segment is expected to witness the highest growth over the forecast period
North America leads due to its advanced horticulture industry, high adoption of agricultural automation, and strong presence of commercial greenhouses. The region faces rising labor costs, pushing growers toward automated pot filling solutions to improve efficiency. Additionally, technological advancements and increasing investments in nursery automation contribute to strong market growth across the U.S. and Canada.
Growers are increasingly investing in automated solutions to reduce labor dependency, enhance accuracy in soil and substrate handling, and maintain consistent plant quality. Technological innovations, such as modular and multifunctional filling systems, coupled with government incentives for modernizing agricultural practices, are further driving market expansion. The combination of cost-saving benefits, improved productivity, and rising focus on sustainable greenhouse operations positions the U.S. as a key growth hub within the North American automatic pot filling machine market.
| Report Matrics |
Details |
| Market Size Value |
USD 950 million |
| Growth Rate |
CAGR of 11.20% |
| Forecast |
2026-2033 |
| Historical data |
2021-2024 |
| Base Year |
2025 |
| Report Coverage |
Forecasted revenue, company rating, competitive environment, growth drivers, and trends |
| Segment Coverage |
Type, Application, End-User, Geography |
| Regional Scope |
North America, Europe, Asia Pacific, Middle East |
| Customized scope |
Free customization of reports (With 3 months' analysis support) |
| To Learn More About This Report |
Request a Free Sample Copy |
Automatic Pot Filling Machine Market Competitive Landscape:
The competitive landscape for the Global Automatic Pot Filling Machine market is shaped by a mix of established agricultural-equipment manufacturers, specialized nursery-automation suppliers, and regional system integrators. Competition centers on machine throughput, modularity (ability to handle multiple pot sizes), precision soil dosing, ease of integration with conveyors and seeding/labeling lines, and after-sales service including spare parts and remote diagnostics. Leading vendors compete by offering IoT/sensor-enabled machines, flexible configurations for different crop types, and service/consumables contracts that lock in customers. Consolidation, strategic partnerships with greenhouse automation providers, and a push to deliver lower total cost of ownership (through energy efficiency and reduced waste) are key market dynamics shaping vendor strategy and customer choice.
Key Players:
- Priva
- Marden Edwards
- Gakon
- Acco Companies
- Javo Holland BV
- Omev Group
- Van Rijn BV
- Royal Brinkman
- Growers Supply
- Bato Plastics (pot-handling systems)
- GreenTek, Inc.
- Florimond Desprez (automation division)
- BVB Substrates & Equipment
- BVG (horticulture machinery)
- KUBO Systems
- Eurogrow Automation
- Horticultural Technologies Ltd.
- Steketee BV
- Roboplant Solutions
- AgriTech Systems
Recent Development
- In November 2025, Xi’an Shibo Fluid Technology Co., Ltd. developed the FDA Standard Double-Head Bag-in-Box Aseptic Filling Machine, enhancing sterile liquid packaging. Its dual-head design increased throughput while ensuring hygiene and safety, meeting global demand in the liquid food and beverage industry.
- In December 2023, TurboFil Packaging Machines LLC launched the TipFil Syringe Filling & Assembly Machine, fully automating loading, filling, capping, inspection, labeling, and printing. This innovation demonstrated advanced modular automation, improving efficiency and precision in liquid filling processes, and positively influenced adoption, technological advancement, and growth in the global automatic pot filling machine market.
Frequently Asked Questions (FAQ) :
Q1. What are the main growth-driving factors for this market?
Growth is primarily driven by the massive global shift toward automation in packaging, aiming to boost production efficiency and reduce labor costs. Increased consumer demand for packaged and ready-to-eat foods, beverages, and pharmaceutical products, which require precise, high-speed filling, also fuels market expansion.
Q2. What are the main restraining factors for this market?
The main restraint is the high initial capital expenditure (CAPEX) required to purchase and install fully automatic pot filling lines. This high cost often limits adoption, especially for smaller-scale manufacturers and companies operating in developing regions with constrained budgets.
Q3. Which segment is expected to witness high growth?
The pharmaceutical and biopharma end-user segment is expected to show particularly strong growth. This is due to the extremely stringent regulatory requirements for dosing accuracy and hygiene (aseptic filling), making high-precision automatic machines indispensable for safety and compliance.
Q4. Who are the top major players for this market?
The market features several major global packaging machinery companies. Key players include large entities like Robert Bosch GmbH, Krones AG, and Tetra Laval International S.A. These firms offer comprehensive, high-speed filling solutions used across food, beverage, and pharmaceutical industries.
Q5. Which country is the largest player?
The largest regional market is generally considered to be Asia-Pacific, driven by countries like China and India. This dominance is attributed to rapid industrialization, massive population growth, increased consumer purchasing power, and vast expansion in the food, beverage, and personal care manufacturing sectors.
List of Figures
Figure 1: Global Automatic Pot Filling Machine Market Revenue Breakdown (USD Billion, %) by Region, 2022 & 2029
Figure 2: Global Automatic Pot Filling Machine Market Value Share (%), By Segment 1, 2022 & 2029
Figure 3: Global Automatic Pot Filling Machine Market Forecast (USD Billion), by Sub-Segment 1, 2018-2029
Figure 4: Global Automatic Pot Filling Machine Market Forecast (USD Billion), by Sub-Segment 2, 2018-2029
Figure 5: Global Automatic Pot Filling Machine Market Value Share (%), By Segment 2, 2022 & 2029
Figure 6: Global Automatic Pot Filling Machine Market Forecast (USD Billion), by Sub-Segment 1, 2018-2029
Figure 7: Global Automatic Pot Filling Machine Market Forecast (USD Billion), by Sub-Segment 2, 2018-2029
Figure 8: Global Automatic Pot Filling Machine Market Forecast (USD Billion), by Sub-Segment 3, 2018-2029
Figure 9: Global Automatic Pot Filling Machine Market Forecast (USD Billion), by Others, 2018-2029
Figure 10: Global Automatic Pot Filling Machine Market Value Share (%), By Segment 3, 2022 & 2029
Figure 11: Global Automatic Pot Filling Machine Market Forecast (USD Billion), by Sub-Segment 1, 2018-2029
Figure 12: Global Automatic Pot Filling Machine Market Forecast (USD Billion), by Sub-Segment 2, 2018-2029
Figure 13: Global Automatic Pot Filling Machine Market Forecast (USD Billion), by Sub-Segment 3, 2018-2029
Figure 14: Global Automatic Pot Filling Machine Market Forecast (USD Billion), by Others, 2018-2029
Figure 15: Global Automatic Pot Filling Machine Market Value (USD Billion), by Region, 2022 & 2029
Figure 16: North America Automatic Pot Filling Machine Market Value Share (%), By Segment 1, 2022 & 2029
Figure 17: North America Automatic Pot Filling Machine Market Forecast (USD Billion), by Sub-Segment 1, 2018-2029
Figure 18: North America Automatic Pot Filling Machine Market Forecast (USD Billion), by Sub-Segment 2, 2018-2029
Figure 19: North America Automatic Pot Filling Machine Market Value Share (%), By Segment 2, 2022 & 2029
Figure 20: North America Automatic Pot Filling Machine Market Forecast (USD Billion), by Sub-Segment 1, 2018-2029
Figure 21: North America Automatic Pot Filling Machine Market Forecast (USD Billion), by Sub-Segment 2, 2018-2029
Figure 22: North America Automatic Pot Filling Machine Market Forecast (USD Billion), by Sub-Segment 3, 2018-2029
Figure 23: North America Automatic Pot Filling Machine Market Forecast (USD Billion), by Others, 2018-2029
Figure 24: North America Automatic Pot Filling Machine Market Value Share (%), By Segment 3, 2022 & 2029
Figure 25: North America Automatic Pot Filling Machine Market Forecast (USD Billion), by Sub-Segment 1, 2018-2029
Figure 26: North America Automatic Pot Filling Machine Market Forecast (USD Billion), by Sub-Segment 2, 2018-2029
Figure 27: North America Automatic Pot Filling Machine Market Forecast (USD Billion), by Sub-Segment 3, 2018-2029
Figure 28: North America Automatic Pot Filling Machine Market Forecast (USD Billion), by Others, 2018-2029
Figure 29: North America Automatic Pot Filling Machine Market Forecast (USD Billion), by U.S., 2018-2029
Figure 30: North America Automatic Pot Filling Machine Market Forecast (USD Billion), by Canada, 2018-2029
Figure 31: Latin America Automatic Pot Filling Machine Market Value Share (%), By Segment 1, 2022 & 2029
Figure 32: Latin America Automatic Pot Filling Machine Market Forecast (USD Billion), by Sub-Segment 1, 2018-2029
Figure 33: Latin America Automatic Pot Filling Machine Market Forecast (USD Billion), by Sub-Segment 2, 2018-2029
Figure 34: Latin America Automatic Pot Filling Machine Market Value Share (%), By Segment 2, 2022 & 2029
Figure 35: Latin America Automatic Pot Filling Machine Market Forecast (USD Billion), by Sub-Segment 1, 2018-2029
Figure 36: Latin America Automatic Pot Filling Machine Market Forecast (USD Billion), by Sub-Segment 2, 2018-2029
Figure 37: Latin America Automatic Pot Filling Machine Market Forecast (USD Billion), by Sub-Segment 3, 2018-2029
Figure 38: Latin America Automatic Pot Filling Machine Market Forecast (USD Billion), by Others, 2018-2029
Figure 39: Latin America Automatic Pot Filling Machine Market Value Share (%), By Segment 3, 2022 & 2029
Figure 40: Latin America Automatic Pot Filling Machine Market Forecast (USD Billion), by Sub-Segment 1, 2018-2029
Figure 41: Latin America Automatic Pot Filling Machine Market Forecast (USD Billion), by Sub-Segment 2, 2018-2029
Figure 42: Latin America Automatic Pot Filling Machine Market Forecast (USD Billion), by Sub-Segment 3, 2018-2029
Figure 43: Latin America Automatic Pot Filling Machine Market Forecast (USD Billion), by Others, 2018-2029
Figure 44: Latin America Automatic Pot Filling Machine Market Forecast (USD Billion), by Brazil, 2018-2029
Figure 45: Latin America Automatic Pot Filling Machine Market Forecast (USD Billion), by Mexico, 2018-2029
Figure 46: Latin America Automatic Pot Filling Machine Market Forecast (USD Billion), by Rest of Latin America, 2018-2029
Figure 47: Europe Automatic Pot Filling Machine Market Value Share (%), By Segment 1, 2022 & 2029
Figure 48: Europe Automatic Pot Filling Machine Market Forecast (USD Billion), by Sub-Segment 1, 2018-2029
Figure 49: Europe Automatic Pot Filling Machine Market Forecast (USD Billion), by Sub-Segment 2, 2018-2029
Figure 50: Europe Automatic Pot Filling Machine Market Value Share (%), By Segment 2, 2022 & 2029
Figure 51: Europe Automatic Pot Filling Machine Market Forecast (USD Billion), by Sub-Segment 1, 2018-2029
Figure 52: Europe Automatic Pot Filling Machine Market Forecast (USD Billion), by Sub-Segment 2, 2018-2029
Figure 53: Europe Automatic Pot Filling Machine Market Forecast (USD Billion), by Sub-Segment 3, 2018-2029
Figure 54: Europe Automatic Pot Filling Machine Market Forecast (USD Billion), by Others, 2018-2029
Figure 55: Europe Automatic Pot Filling Machine Market Value Share (%), By Segment 3, 2022 & 2029
Figure 56: Europe Automatic Pot Filling Machine Market Forecast (USD Billion), by Sub-Segment 1, 2018-2029
Figure 57: Europe Automatic Pot Filling Machine Market Forecast (USD Billion), by Sub-Segment 2, 2018-2029
Figure 58: Europe Automatic Pot Filling Machine Market Forecast (USD Billion), by Sub-Segment 3, 2018-2029
Figure 59: Europe Automatic Pot Filling Machine Market Forecast (USD Billion), by Others, 2018-2029
Figure 60: Europe Automatic Pot Filling Machine Market Forecast (USD Billion), by U.K., 2018-2029
Figure 61: Europe Automatic Pot Filling Machine Market Forecast (USD Billion), by Germany, 2018-2029
Figure 62: Europe Automatic Pot Filling Machine Market Forecast (USD Billion), by France, 2018-2029
Figure 63: Europe Automatic Pot Filling Machine Market Forecast (USD Billion), by Italy, 2018-2029
Figure 64: Europe Automatic Pot Filling Machine Market Forecast (USD Billion), by Spain, 2018-2029
Figure 65: Europe Automatic Pot Filling Machine Market Forecast (USD Billion), by Russia, 2018-2029
Figure 66: Europe Automatic Pot Filling Machine Market Forecast (USD Billion), by Rest of Europe, 2018-2029
Figure 67: Asia Pacific Automatic Pot Filling Machine Market Value Share (%), By Segment 1, 2022 & 2029
Figure 68: Asia Pacific Automatic Pot Filling Machine Market Forecast (USD Billion), by Sub-Segment 1, 2018-2029
Figure 69: Asia Pacific Automatic Pot Filling Machine Market Forecast (USD Billion), by Sub-Segment 2, 2018-2029
Figure 70: Asia Pacific Automatic Pot Filling Machine Market Value Share (%), By Segment 2, 2022 & 2029
Figure 71: Asia Pacific Automatic Pot Filling Machine Market Forecast (USD Billion), by Sub-Segment 1, 2018-2029
Figure 72: Asia Pacific Automatic Pot Filling Machine Market Forecast (USD Billion), by Sub-Segment 2, 2018-2029
Figure 73: Asia Pacific Automatic Pot Filling Machine Market Forecast (USD Billion), by Sub-Segment 3, 2018-2029
Figure 74: Asia Pacific Automatic Pot Filling Machine Market Forecast (USD Billion), by Others, 2018-2029
Figure 75: Asia Pacific Automatic Pot Filling Machine Market Value Share (%), By Segment 3, 2022 & 2029
Figure 76: Asia Pacific Automatic Pot Filling Machine Market Forecast (USD Billion), by Sub-Segment 1, 2018-2029
Figure 77: Asia Pacific Automatic Pot Filling Machine Market Forecast (USD Billion), by Sub-Segment 2, 2018-2029
Figure 78: Asia Pacific Automatic Pot Filling Machine Market Forecast (USD Billion), by Sub-Segment 3, 2018-2029
Figure 79: Asia Pacific Automatic Pot Filling Machine Market Forecast (USD Billion), by Others, 2018-2029
Figure 80: Asia Pacific Automatic Pot Filling Machine Market Forecast (USD Billion), by China, 2018-2029
Figure 81: Asia Pacific Automatic Pot Filling Machine Market Forecast (USD Billion), by India, 2018-2029
Figure 82: Asia Pacific Automatic Pot Filling Machine Market Forecast (USD Billion), by Japan, 2018-2029
Figure 83: Asia Pacific Automatic Pot Filling Machine Market Forecast (USD Billion), by Australia, 2018-2029
Figure 84: Asia Pacific Automatic Pot Filling Machine Market Forecast (USD Billion), by Southeast Asia, 2018-2029
Figure 85: Asia Pacific Automatic Pot Filling Machine Market Forecast (USD Billion), by Rest of Asia Pacific, 2018-2029
Figure 86: Middle East & Africa Automatic Pot Filling Machine Market Value Share (%), By Segment 1, 2022 & 2029
Figure 87: Middle East & Africa Automatic Pot Filling Machine Market Forecast (USD Billion), by Sub-Segment 1, 2018-2029
Figure 88: Middle East & Africa Automatic Pot Filling Machine Market Forecast (USD Billion), by Sub-Segment 2, 2018-2029
Figure 89: Middle East & Africa Automatic Pot Filling Machine Market Value Share (%), By Segment 2, 2022 & 2029
Figure 90: Middle East & Africa Automatic Pot Filling Machine Market Forecast (USD Billion), by Sub-Segment 1, 2018-2029
Figure 91: Middle East & Africa Automatic Pot Filling Machine Market Forecast (USD Billion), by Sub-Segment 2, 2018-2029
Figure 92: Middle East & Africa Automatic Pot Filling Machine Market Forecast (USD Billion), by Sub-Segment 3, 2018-2029
Figure 93: Middle East & Africa Automatic Pot Filling Machine Market Forecast (USD Billion), by Others, 2018-2029
Figure 94: Middle East & Africa Automatic Pot Filling Machine Market Value Share (%), By Segment 3, 2022 & 2029
Figure 95: Middle East & Africa Automatic Pot Filling Machine Market Forecast (USD Billion), by Sub-Segment 1, 2018-2029
Figure 96: Middle East & Africa Automatic Pot Filling Machine Market Forecast (USD Billion), by Sub-Segment 2, 2018-2029
Figure 97: Middle East & Africa Automatic Pot Filling Machine Market Forecast (USD Billion), by Sub-Segment 3, 2018-2029
Figure 98: Middle East & Africa Automatic Pot Filling Machine Market Forecast (USD Billion), by Others, 2018-2029
Figure 99: Middle East & Africa Automatic Pot Filling Machine Market Forecast (USD Billion), by GCC, 2018-2029
Figure 100: Middle East & Africa Automatic Pot Filling Machine Market Forecast (USD Billion), by South Africa, 2018-2029
Figure 101: Middle East & Africa Automatic Pot Filling Machine Market Forecast (USD Billion), by Rest of Middle East & Africa, 2018-2029
List of Tables
Table 1: Global Automatic Pot Filling Machine Market Revenue (USD Billion) Forecast, by Segment 1, 2018-2029
Table 2: Global Automatic Pot Filling Machine Market Revenue (USD Billion) Forecast, by Segment 2, 2018-2029
Table 3: Global Automatic Pot Filling Machine Market Revenue (USD Billion) Forecast, by Segment 3, 2018-2029
Table 4: Global Automatic Pot Filling Machine Market Revenue (USD Billion) Forecast, by Region, 2018-2029
Table 5: North America Automatic Pot Filling Machine Market Revenue (USD Billion) Forecast, by Segment 1, 2018-2029
Table 6: North America Automatic Pot Filling Machine Market Revenue (USD Billion) Forecast, by Segment 2, 2018-2029
Table 7: North America Automatic Pot Filling Machine Market Revenue (USD Billion) Forecast, by Segment 3, 2018-2029
Table 8: North America Automatic Pot Filling Machine Market Revenue (USD Billion) Forecast, by Country, 2018-2029
Table 9: Europe Automatic Pot Filling Machine Market Revenue (USD Billion) Forecast, by Segment 1, 2018-2029
Table 10: Europe Automatic Pot Filling Machine Market Revenue (USD Billion) Forecast, by Segment 2, 2018-2029
Table 11: Europe Automatic Pot Filling Machine Market Revenue (USD Billion) Forecast, by Segment 3, 2018-2029
Table 12: Europe Automatic Pot Filling Machine Market Revenue (USD Billion) Forecast, by Country, 2018-2029
Table 13: Latin America Automatic Pot Filling Machine Market Revenue (USD Billion) Forecast, by Segment 1, 2018-2029
Table 14: Latin America Automatic Pot Filling Machine Market Revenue (USD Billion) Forecast, by Segment 2, 2018-2029
Table 15: Latin America Automatic Pot Filling Machine Market Revenue (USD Billion) Forecast, by Segment 3, 2018-2029
Table 16: Latin America Automatic Pot Filling Machine Market Revenue (USD Billion) Forecast, by Country, 2018-2029
Table 17: Asia Pacific Automatic Pot Filling Machine Market Revenue (USD Billion) Forecast, by Segment 1, 2018-2029
Table 18: Asia Pacific Automatic Pot Filling Machine Market Revenue (USD Billion) Forecast, by Segment 2, 2018-2029
Table 19: Asia Pacific Automatic Pot Filling Machine Market Revenue (USD Billion) Forecast, by Segment 3, 2018-2029
Table 20: Asia Pacific Automatic Pot Filling Machine Market Revenue (USD Billion) Forecast, by Country, 2018-2029
Table 21: Middle East & Africa Automatic Pot Filling Machine Market Revenue (USD Billion) Forecast, by Segment 1, 2018-2029
Table 22: Middle East & Africa Automatic Pot Filling Machine Market Revenue (USD Billion) Forecast, by Segment 2, 2018-2029
Table 23: Middle East & Africa Automatic Pot Filling Machine Market Revenue (USD Billion) Forecast, by Segment 3, 2018-2029
Table 24: Middle East & Africa Automatic Pot Filling Machine Market Revenue (USD Billion) Forecast, by Country, 2018-2029
Research Process
Data Library Research are conducted by industry experts who offer insight on
industry structure, market segmentations technology assessment and competitive landscape (CL), and penetration, as well as on emerging trends. Their analysis is based on primary interviews (~ 80%) and secondary research (~ 20%) as well as years of professional expertise in their respective industries. Adding to this, by analysing historical trends and current market positions, our analysts predict where the market will be headed for the next five years. Furthermore, the varying trends of segment & categories geographically presented are also studied and the estimated based on the primary & secondary research.
In this particular report from the supply side Data Library Research has conducted primary surveys (interviews) with the key level executives (VP, CEO’s, Marketing Director, Business Development Manager
and SOFT) of the companies that active & prominent as well as the midsized organization
FIGURE 1: DLR RESEARH PROCESS
![research-methodology1]()
Primary Research
Extensive primary research was conducted to gain a deeper insight of the market and industry performance. The analysis is based on both primary and secondary research as well as years of professional expertise in the respective industries.
In addition to analysing current and historical trends, our analysts predict where the market is headed over the next five years.
It varies by segment for these categories geographically presented in the list of market tables. Speaking about this particular report we have conducted primary surveys (interviews) with the key level executives (VP, CEO’s, Marketing Director, Business Development Manager and many more) of the major players active in the market.
Secondary Research
Secondary research was mainly used to collect and identify information useful for the extensive, technical, market-oriented, and Friend’s study of the Global Extra Neutral Alcohol. It was also used to obtain key information about major players, market classification and segmentation according to the industry trends, geographical markets, and developments related to the market and technology perspectives. For this study, analysts have gathered information from various credible sources, such as annual reports, sec filings, journals, white papers, SOFT presentations, and company web sites.
Market Size Estimation
Both, top-down and bottom-up approaches were used to estimate and validate the size of the Global market and to estimate the size of various other dependent submarkets in the overall Extra Neutral Alcohol. The key players in the market were identified through secondary research and their market contributions in the respective geographies were determined through primary and secondary research.
Forecast Model
![research-methodology2]()