Bispecific Antibody Molecular Drug Market Overview and Analysis

The Global Bispecific Antibody Molecular Drug Market is estimated to grow from USD 5.98 billion in 2025, to USD 15.8 billion by 2032, at a CAGR of 11.5% from 2025-2032.

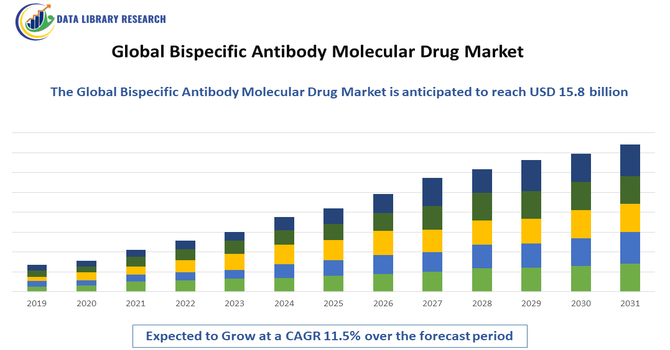
The Global Bispecific Antibody Molecular Drug Market refers to the worldwide industry focused on developing, manufacturing, and commercializing bispecific antibody drugs—therapeutic molecules engineered to bind two different antigens or epitopes simultaneously. These innovative biologics enhance targeted treatment efficacy, especially in oncology and autoimmune diseases. Fueled by advancements in biologics engineering and clinical validation, this market is expanding rapidly as pharmaceutical companies and research institutions develop next-generation therapies for complex diseases.

Bispecific Antibody Molecular Drug Market Latest Trends

The bispecific antibody market is driven by increased R&D investment and clinical successes in cancer immunotherapy, particularly in hematologic malignancies and solid tumors. Advancements in engineering platforms, such as BiTEs (bispecific T cell engagers) and dual affinity retargeting (DART) technologies, are enabling more effective and safer drug candidates. Strategic collaborations between biotech firms and large pharmaceutical companies are accelerating pipeline development and regulatory approvals. Additionally, expansion into non oncology indications, such as inflammatory and neurological diseases, is broadening market potential. Regulatory agencies are also providing accelerated pathways for breakthrough therapies, further encouraging innovation and adoption of bispecific antibody drugs globally.

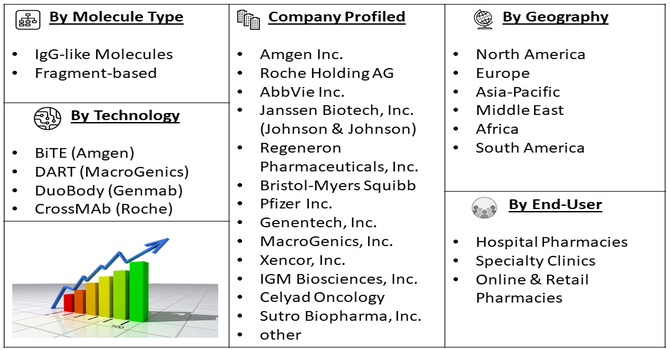
Segmentation: The Global Bispecific Antibody Molecular Drug Market is segmented by Therapeutic Area (Oncology, Autoimmune & Inflammatory Diseases, Hematology and Infectious Diseases & Others), Molecule Type (IgG-like Molecules and Fragment-based), Mechanism of Action (Immune Cell Redirectors and Dual Pathway Blockers), Technology Platform (BiTE (Amgen), DART (MacroGenics), DuoBody (Genmab) and CrossMAb (Roche)), End-User (Hospital Pharmacies, Specialty Clinics and Online & Retail Pharmacies), and Geography (North America, Europe, Asia-Pacific, Middle East and Africa, and South America). The report provides the value (in USD million) for the above segments.

Market Drivers:

  • Rising Prevalence of Cancer and Chronic Diseases

The increasing global prevalence of cancer and other chronic diseases is a key driver for the bispecific antibody molecular drug market. Bispecific antibodies offer targeted therapy by simultaneously binding to two distinct antigens, enhancing therapeutic efficacy and reducing off-target effects compared to traditional monoclonal antibodies.

With cancer incidence rising and many patients developing resistance to conventional therapies, demand for innovative treatments is accelerating. For instance, The Lancet reported that by 2050, 30.5 million new diagnoses , with over half of cases and two-thirds of deaths occurring in low- and middle-income countries, highlighting a critical need for urgent action and targeted funding.

Governments and healthcare providers are prioritizing advanced biologics to improve patient outcomes. This rising disease burden, coupled with awareness of bispecific antibodies’ potential to treat complex conditions, is driving research, development, and market adoption globally.

  • Technological Advancements in Biologics and Antibody Engineering

Technological advancements in antibody engineering, including BiTEs (bispecific T-cell engagers), DART (dual affinity retargeting), and other platforms, are significantly driving the bispecific antibody market. Innovations allow the creation of antibodies with higher specificity, improved stability, and reduced immunogenicity, enabling effective targeting of tumors and immune modulation. Integration of AI-driven drug design and high-throughput screening accelerates candidate identification and preclinical development.

In October 2025, Alphamab Oncology announced the first patient dosing in a Phase I trial of JSKN022, an innovative bispecific antibody-drug conjugate targeting PD-L1 and integrin αvβ6, marking the world’s first PD-L1/αvβ6 bispecific ADC to enter clinical development. These technological advancements empower pharmaceutical companies to produce safer, more effective bispecific antibodies, expanding clinical applications and strengthening global market growth.

Market Restraints:

  • High Development Costs and Complex Manufacturing

High development costs and complex manufacturing processes remain significant restraints for the bispecific antibody molecular drug market. Producing bispecific antibodies involves intricate protein engineering, quality control, and scaling challenges, leading to substantial R&D and production expenses. Regulatory compliance, clinical trial requirements, and stringent safety standards further increase costs and development timelines. These factors limit the ability of smaller companies to compete and slow the introduction of new therapies. Additionally, high treatment costs for patients can restrict market penetration in price-sensitive regions. Consequently, despite strong demand and technological advances, financial and operational barriers continue to constrain widespread adoption of bispecific antibody drugs globally.

Socioeconomic Impact on Bispecific Antibody Molecular Drug Market

Bispecific antibody drugs significantly impact healthcare by offering more effective treatments for conditions with unmet medical needs, improving patient survival and quality of life, particularly in oncology. These therapies can reduce long term healthcare costs by enhancing treatment specificity and reducing adverse effects. However, high development and treatment costs raise affordability and access challenges, especially in low and middle income regions. The demand for specialized manufacturing and skilled professionals creates high value jobs and stimulates biotech innovation. Policymakers and healthcare systems must balance encouraging innovation with ensuring equitable access. Ultimately, bispecific antibodies represent a transformative class of therapeutics that influence clinical outcomes and healthcare economics globally.

Segmental Analysis: 

  • Oncology segment is expected to witness highest growth over the forecast period

The oncology segment is projected to witness the highest growth over the forecast period due to the rising global incidence of cancer and the urgent need for targeted therapies. Bispecific antibodies can simultaneously engage tumor antigens and immune effector cells, enhancing antitumor activity and improving patient outcomes. Clinical successes in hematologic malignancies and solid tumors have demonstrated efficacy, encouraging adoption in cancer treatment protocols. Strategic collaborations between pharmaceutical companies and oncology research centers are accelerating the development of novel bispecific therapies. With growing investment in oncology R&D and increasing regulatory approvals, bispecific antibodies are poised to become a central component of cancer therapy.

  • IgG-like Molecules segment is expected to witness highest growth over the forecast period

The IgG-like molecules segment is expected to experience the highest growth due to their structural similarity to natural antibodies, which provides favorable pharmacokinetics, stability, and reduced immunogenicity. These molecules are versatile, allowing for dual targeting of tumor antigens and immune cells, making them suitable for multiple therapeutic applications. Advances in protein engineering and high-throughput screening have enhanced the efficiency of IgG-like bispecific antibodies, supporting large-scale production and clinical translation. Their proven safety profiles and adaptability across oncology and autoimmune indications increase market demand. As pharmaceutical companies prioritize effective and reliable antibody formats, the IgG-like segment is projected to dominate growth in the bispecific antibody market.

  • Immune Cell Redirectors segment is expected to witness highest growth over the forecast period

The immune cell redirectors segment is anticipated to witness the highest growth as these bispecific antibodies actively engage and redirect immune effector cells, such as T-cells, to target diseased cells. This approach enhances the body’s natural immune response against cancer and other conditions with high precision. Successes in T-cell engager therapies and ongoing clinical trials highlight their efficacy in hematologic and solid tumors. Increasing investment in immuno-oncology and advancements in safety and specificity further drive adoption. As healthcare providers seek therapies that combine high efficacy with reduced systemic toxicity, immune cell redirectors are becoming a focal point of bispecific antibody development and commercialization.

  • DART (MacroGenics) segment is expected to witness highest growth over the forecast period

The DART (Dual-Affinity Re-Targeting) segment by MacroGenics is expected to witness significant growth due to its innovative platform for creating bispecific antibodies with enhanced stability, potency, and dual-targeting capabilities. DART molecules efficiently redirect immune cells to target tumor cells, improving therapeutic efficacy and reducing off-target effects. Ongoing clinical trials and early approvals in oncology and immunology validate the platform’s potential. Strategic partnerships and licensing agreements expand global access and pipeline development. With increasing demand for next-generation bispecific therapies, the DART platform offers a reliable and scalable solution, positioning it as a leading technology in the global bispecific antibody market.

  • North America region is expected to witness highest growth over the forecast period

North America is projected to witness the highest growth in the bispecific antibody molecular drug market due to advanced healthcare infrastructure, high R&D investment, and early adoption of innovative biologics.

The region hosts leading pharmaceutical companies, biotech startups, and research institutions driving pipeline development and clinical trials. For instance, in January 2023, the FDA approved Genentech’s bispecific antibodies for lymphoma treatment, marking a significant milestone in North America’s bispecific antibody market. This approval validated the clinical efficacy and safety of bispecific therapies, accelerating adoption in oncology treatment protocols. It strengthened the region’s position as a leader in innovative biologics, encouraged further R&D investment, and enhanced market confidence. Consequently, it boosted demand for next-generation bispecific antibodies, driving growth and reinforcing North America’s dominance in the global bispecific antibody molecular drug market.

Rising cancer prevalence, favorable reimbursement policies, and strong regulatory support for breakthrough therapies further accelerate adoption. For instance, the American Cancer Society reported that, cancer incidence increased from around 805 cases per 100,000 in 1998 to 832 cases per 100,000 in 2021. The incidence rate for women younger than 50 has increased from 51% higher than men in 2002 to 82% higher in 2021. Rising cancer incidence, as reported by the American Cancer Society, highlights the growing demand for targeted therapies. The increasing prevalence, especially among younger women, is expected to drive the adoption and growth of bispecific antibody molecular drugs globally.

Technological advancements in antibody engineering, combined with robust funding and collaborations, enhance the region’s capacity to develop and commercialize bispecific antibodies. Consequently, North America remains a dominant hub for market growth and innovation in bispecific antibody therapeutics.

Bispecific Antibody Molecular Drug Market Competitive Landscape

The competitive landscape features established pharmaceutical giants and agile biotech innovators developing diverse bispecific antibody platforms. Leading companies differentiate through proprietary technologies, extensive clinical pipelines, and strategic partnerships that enhance scale and market reach. Many firms focus on niche indications and novel mechanisms of action to gain competitive advantage. Licensing agreements, mergers, and acquisitions are common as larger players seek access to cutting edge platforms developed by smaller biotechs. Regulatory experience and manufacturing capabilities also influence competitive positioning, as biologics production demands high quality and scalability. Overall, competition revolves around clinical efficacy, safety profiles, and the ability to navigate complex regulatory environments efficiently.

The major players for above market:

  • Amgen Inc.
  • Roche Holding AG
  • AbbVie Inc.
  • Janssen Biotech, Inc. (Johnson & Johnson) 
  • Regeneron Pharmaceuticals, Inc.
  • Bristol-Myers Squibb
  • Pfizer Inc.
  • Genentech, Inc.
  • MacroGenics, Inc.
  • Xencor, Inc.
  • IGM Biosciences, Inc.
  • Celyad Oncology
  • Sutro Biopharma, Inc.
  • Affimed N.V.
  • Immunocore Limited
  • Alligator Bioscience AB
  • F-star Therapeutics Ltd.
  • AbCheck Biotech Co., Ltd.
  • Adaptimmune Therapeutics plc
  • BioInvent International AB

Recent Development

  • In De ember 2025, BioNTech and Bristol Myers Squibb released interim Phase 2 trial results evaluating pumitamig, a bispecific antibody targeting PD-L1 and VEGF-A, combined with chemotherapy, in patients with locally advanced or metastatic triple-negative breast cancer, regardless of PD-L1 expression.


  • In April 2025, Roche obtained European Commission approval to use glofitamab (Columvi) in combination with chemotherapy agents gemcitabine and oxaliplatin for the treatment of diffuse large B-cell lymphoma. This regulatory clearance enables broader clinical application of the therapy, supporting improved patient outcomes and reinforcing Roche’s presence in the bispecific antibody market.


Frequently Asked Questions (FAQ) :

Q1. What are the main growth-driving factors for this market?

The primary driver is the rising global prevalence of cancer and autoimmune diseases. Unlike standard antibodies that hit one target, bispecific antibodies can bind to two different targets at once—for example, grabbing a cancer cell and an immune cell simultaneously. This superior clinical effectiveness is fueling massive investment and regulatory approvals.

Q2. What are the main restraining factors for this market?

Growth is hindered by the extreme complexity and high cost of manufacturing these drugs. Designing a stable molecule that binds to two targets without falling apart is a significant technical challenge. Additionally, strict regulatory requirements and the potential for severe side effects, like cytokine release syndrome, can delay market entry.

Q3. Which segment is expected to witness high growth?

The Oncology segment is expected to witness the highest growth. Bispecific antibodies are proving to be game-changers in treating blood cancers and solid tumors that have become resistant to traditional therapies. Their ability to "redirect" the body’s own immune system to attack specific tumors makes them a dominant force in cancer research.

Q4. Who are the top major players for this market?

The market is led by global pharmaceutical giants with advanced biotechnology platforms. Key players include Amgen, Roche (Genentech), Johnson & Johnson (Janssen), and Regeneron Pharmaceuticals. These companies have successfully launched pioneering drugs like Blincyto and Hemlibra, setting the standard for the next generation of immunotherapy.

Q5. Which country is the largest player?

The United States is the largest player in this market. This dominance is due to its world-leading biotechnology research infrastructure, high healthcare spending, and the presence of major pharmaceutical headquarters. The U.S. FDA also provides specialized pathways that accelerate the approval of these breakthrough "orphan" and "fast-track" drugs.

Bispecific Antibody Molecular Drug MARKET STUDY GLOBAL MARKET ANALYSIS, INSIGHTS AND FORECAST, 2022-2029

    1. Introduction

    • 1.1. Research Scope
    • 1.2. Market Segmentation
    • 1.3. Research Methodology
    • 1.4. Definitions and Assumptions

    2. Executive Summary

      3. Market Dynamics

      • 3.1. Market Drivers
      • 3.2. Market Restraints
      • 3.3. Market Opportunities

      4. Key Insights

      • 4.1. Key Emerging Trends – For Major Countries
      • 4.2. Latest Technological Advancement
      • 4.3. Regulatory Landscape
      • 4.4. Industry SWOT Analysis
      • 4.5. Porters Five Forces Analysis

      5. Global Bispecific Antibody Molecular Drug Market Analysis (USD Billion), Insights and Forecast, 2018-2029

      • 5.1. Key Findings / Summary
      • 5.2. Market Analysis, Insights and Forecast – By Segment 1
        • 5.2.1. Sub-Segment 1
        • 5.2.2. Sub-Segment 2
      • 5.3. Market Analysis, Insights and Forecast – By Segment 2
        • 5.3.1. Sub-Segment 1
        • 5.3.2. Sub-Segment 2
        • 5.3.3. Sub-Segment 3
        • 5.3.4. Others
      • 5.4. Market Analysis, Insights and Forecast – By Segment 3
        • 5.4.1. Sub-Segment 1
        • 5.4.2. Sub-Segment 2
        • 5.4.3. Sub-Segment 3
        • 5.4.4. Others
      • 5.5. Market Analysis, Insights and Forecast – By Region
        • 5.5.1. North America
        • 5.5.2. Latin America
        • 5.5.3. Europe
        • 5.5.4. Asia Pacific
        • 5.5.5. Middle East and Africa

      6. North America Bispecific Antibody Molecular Drug Market Analysis (USD Billion), Insights and Forecast, 2018-2029

      • 6.1. Key Findings / Summary
      • 6.2. Market Analysis, Insights and Forecast – By Segment 1
        • 6.2.1. Sub-Segment 1
        • 6.2.2. Sub-Segment 2
      • 6.3. Market Analysis, Insights and Forecast – By Segment 2
        • 6.3.1. Sub-Segment 1
        • 6.3.2. Sub-Segment 2
        • 6.3.3. Sub-Segment 3
        • 6.3.4. Others
      • 6.4. Market Analysis, Insights and Forecast – By Segment 3
        • 6.4.1. Sub-Segment 1
        • 6.4.2. Sub-Segment 2
        • 6.4.3. Sub-Segment 3
        • 6.4.4. Others
      • 6.5. Market Analysis, Insights and Forecast – By Country
        • 6.5.1. U.S.
        • 6.5.2. Canada

      7. Latin America Bispecific Antibody Molecular Drug Market Analysis (USD Billion), Insights and Forecast, 2018-2029

      • 7.1. Key Findings / Summary
      • 7.2. Market Analysis, Insights and Forecast – By Segment 1
        • 7.2.1. Sub-Segment 1
        • 7.2.2. Sub-Segment 2
      • 7.3. Market Analysis, Insights and Forecast – By Segment 2
        • 7.3.1. Sub-Segment 1
        • 7.3.2. Sub-Segment 2
        • 7.3.3. Sub-Segment 3
        • 7.3.4. Others
      • 7.4. Market Analysis, Insights and Forecast – By Segment 3
        • 7.4.1. Sub-Segment 1
        • 7.4.2. Sub-Segment 2
        • 7.4.3. Sub-Segment 3
        • 7.4.4. Others
      • 7.5. Insights and Forecast – By Country
        • 7.5.1. Brazil
        • 7.5.2. Mexico
        • 7.5.3. Rest of Latin America

      8. Europe Bispecific Antibody Molecular Drug Market Analysis (USD Billion), Insights and Forecast, 2018-2029

      • 8.1. Key Findings / Summary
      • 8.2. Market Analysis, Insights and Forecast – By Segment 1
        • 8.2.1. Sub-Segment 1
        • 8.2.2. Sub-Segment 2
      • 8.3. Market Analysis, Insights and Forecast – By Segment 2
        • 8.3.1. Sub-Segment 1
        • 8.3.2. Sub-Segment 2
        • 8.3.3. Sub-Segment 3
        • 8.3.4. Others
      • 8.4. Market Analysis, Insights and Forecast – By Segment 3
        • 8.4.1. Sub-Segment 1
        • 8.4.2. Sub-Segment 2
        • 8.4.3. Sub-Segment 3
        • 8.4.4. Others
      • 8.5. Market Analysis, Insights and Forecast – By Country
        • 8.5.1. UK
        • 8.5.2. Germany
        • 8.5.3. France
        • 8.5.4. Italy
        • 8.5.5. Spain
        • 8.5.6. Russia
        • 8.5.7. Rest of Europe

      9. Asia Pacific Bispecific Antibody Molecular Drug Market Analysis (USD Billion), Insights and Forecast, 2018-2029

      • 9.1. Key Findings / Summary
      • 9.2. Market Analysis, Insights and Forecast – By Segment 1
        • 9.2.1. Sub-Segment 1
        • 9.2.2. Sub-Segment 2
      • 9.3. Market Analysis, Insights and Forecast – By Segment 2
        • 9.3.1. Sub-Segment 1
        • 9.3.2. Sub-Segment 2
        • 9.3.3. Sub-Segment 3
        • 9.3.4. Others
      • 9.4. Market Analysis, Insights and Forecast – By Segment 3
        • 9.4.1. Sub-Segment 1
        • 9.4.2. Sub-Segment 2
        • 9.4.3. Sub-Segment 3
        • 9.4.4. Others
      • 9.5. Market Analysis, Insights and Forecast – By Country
        • 9.5.1. China
        • 9.5.2. India
        • 9.5.3. Japan
        • 9.5.4. Australia
        • 9.5.5. South East Asia
        • 9.5.6. Rest of Asia Pacific

      10. Middle East & Africa Bispecific Antibody Molecular Drug Market Analysis (USD Billion), Insights and Forecast, 2018-2029

      • 10.1. Key Findings / Summary
      • 10.2. Market Analysis, Insights and Forecast – By Segment 1
        • 10.2.1. Sub-Segment 1
        • 10.2.2. Sub-Segment 2
      • 10.3. Market Analysis, Insights and Forecast – By Segment 2
        • 10.3.1. Sub-Segment 1
        • 10.3.2. Sub-Segment 2
        • 10.3.3. Sub-Segment 3
        • 10.3.4. Others
      • 10.4. Market Analysis, Insights and Forecast – By Segment 3
        • 10.4.1. Sub-Segment 1
        • 10.4.2. Sub-Segment 2
        • 10.4.3. Sub-Segment 3
        • 10.4.4. Others
      • 10.5. Market Analysis, Insights and Forecast – By Country
        • 10.5.1. GCC
        • 10.5.2. South Africa
        • 10.5.3. Rest of Middle East & Africa

      11. Competitive Analysis

      • 11.1. Company Market Share Analysis, 2018
      • 11.2. Key Industry Developments
      • 11.3. Company Profile
        • 11.3.1. Company 1
          • 11.3.1.1. Business Overview
          • 11.3.1.2. Segment 1 & Service Offering
          • 11.3.1.3. Overall Revenue
          • 11.3.1.4. Geographic Presence
          • 11.3.1.5. Recent Development
        *Similar details will be provided for the following companies
        • 11.3.2. Company 2
        • 11.3.3. Company 3
        • 11.3.4. Company 4
        • 11.3.5. Company 5
        • 11.3.6. Company 6
        • 11.3.7. Company 7
        • 11.3.8. Company 8
        • 11.3.9. Company 9
        • 11.3.10. Company 10
        • 11.3.11. Company 11
        • 11.3.12. Company 12
      List of Figures

      Figure 1: Global Bispecific Antibody Molecular Drug Market Revenue Breakdown (USD Billion, %) by Region, 2022 & 2029
      Figure 2: Global Bispecific Antibody Molecular Drug Market Value Share (%), By Segment 1, 2022 & 2029
      Figure 3: Global Bispecific Antibody Molecular Drug Market Forecast (USD Billion), by Sub-Segment 1, 2018-2029
      Figure 4: Global Bispecific Antibody Molecular Drug Market Forecast (USD Billion), by Sub-Segment 2, 2018-2029
      Figure 5: Global Bispecific Antibody Molecular Drug Market Value Share (%), By Segment 2, 2022 & 2029
      Figure 6: Global Bispecific Antibody Molecular Drug Market Forecast (USD Billion), by Sub-Segment 1, 2018-2029
      Figure 7: Global Bispecific Antibody Molecular Drug Market Forecast (USD Billion), by Sub-Segment 2, 2018-2029
      Figure 8: Global Bispecific Antibody Molecular Drug Market Forecast (USD Billion), by Sub-Segment 3, 2018-2029
      Figure 9: Global Bispecific Antibody Molecular Drug Market Forecast (USD Billion), by Others, 2018-2029
      Figure 10: Global Bispecific Antibody Molecular Drug Market Value Share (%), By Segment 3, 2022 & 2029
      Figure 11: Global Bispecific Antibody Molecular Drug Market Forecast (USD Billion), by Sub-Segment 1, 2018-2029
      Figure 12: Global Bispecific Antibody Molecular Drug Market Forecast (USD Billion), by Sub-Segment 2, 2018-2029
      Figure 13: Global Bispecific Antibody Molecular Drug Market Forecast (USD Billion), by Sub-Segment 3, 2018-2029
      Figure 14: Global Bispecific Antibody Molecular Drug Market Forecast (USD Billion), by Others, 2018-2029
      Figure 15: Global Bispecific Antibody Molecular Drug Market Value (USD Billion), by Region, 2022 & 2029
      Figure 16: North America Bispecific Antibody Molecular Drug Market Value Share (%), By Segment 1, 2022 & 2029
      Figure 17: North America Bispecific Antibody Molecular Drug Market Forecast (USD Billion), by Sub-Segment 1, 2018-2029
      Figure 18: North America Bispecific Antibody Molecular Drug Market Forecast (USD Billion), by Sub-Segment 2, 2018-2029
      Figure 19: North America Bispecific Antibody Molecular Drug Market Value Share (%), By Segment 2, 2022 & 2029
      Figure 20: North America Bispecific Antibody Molecular Drug Market Forecast (USD Billion), by Sub-Segment 1, 2018-2029
      Figure 21: North America Bispecific Antibody Molecular Drug Market Forecast (USD Billion), by Sub-Segment 2, 2018-2029
      Figure 22: North America Bispecific Antibody Molecular Drug Market Forecast (USD Billion), by Sub-Segment 3, 2018-2029
      Figure 23: North America Bispecific Antibody Molecular Drug Market Forecast (USD Billion), by Others, 2018-2029
      Figure 24: North America Bispecific Antibody Molecular Drug Market Value Share (%), By Segment 3, 2022 & 2029
      Figure 25: North America Bispecific Antibody Molecular Drug Market Forecast (USD Billion), by Sub-Segment 1, 2018-2029
      Figure 26: North America Bispecific Antibody Molecular Drug Market Forecast (USD Billion), by Sub-Segment 2, 2018-2029
      Figure 27: North America Bispecific Antibody Molecular Drug Market Forecast (USD Billion), by Sub-Segment 3, 2018-2029
      Figure 28: North America Bispecific Antibody Molecular Drug Market Forecast (USD Billion), by Others, 2018-2029
      Figure 29: North America Bispecific Antibody Molecular Drug Market Forecast (USD Billion), by U.S., 2018-2029
      Figure 30: North America Bispecific Antibody Molecular Drug Market Forecast (USD Billion), by Canada, 2018-2029
      Figure 31: Latin America Bispecific Antibody Molecular Drug Market Value Share (%), By Segment 1, 2022 & 2029
      Figure 32: Latin America Bispecific Antibody Molecular Drug Market Forecast (USD Billion), by Sub-Segment 1, 2018-2029
      Figure 33: Latin America Bispecific Antibody Molecular Drug Market Forecast (USD Billion), by Sub-Segment 2, 2018-2029
      Figure 34: Latin America Bispecific Antibody Molecular Drug Market Value Share (%), By Segment 2, 2022 & 2029
      Figure 35: Latin America Bispecific Antibody Molecular Drug Market Forecast (USD Billion), by Sub-Segment 1, 2018-2029
      Figure 36: Latin America Bispecific Antibody Molecular Drug Market Forecast (USD Billion), by Sub-Segment 2, 2018-2029
      Figure 37: Latin America Bispecific Antibody Molecular Drug Market Forecast (USD Billion), by Sub-Segment 3, 2018-2029
      Figure 38: Latin America Bispecific Antibody Molecular Drug Market Forecast (USD Billion), by Others, 2018-2029
      Figure 39: Latin America Bispecific Antibody Molecular Drug Market Value Share (%), By Segment 3, 2022 & 2029
      Figure 40: Latin America Bispecific Antibody Molecular Drug Market Forecast (USD Billion), by Sub-Segment 1, 2018-2029
      Figure 41: Latin America Bispecific Antibody Molecular Drug Market Forecast (USD Billion), by Sub-Segment 2, 2018-2029
      Figure 42: Latin America Bispecific Antibody Molecular Drug Market Forecast (USD Billion), by Sub-Segment 3, 2018-2029
      Figure 43: Latin America Bispecific Antibody Molecular Drug Market Forecast (USD Billion), by Others, 2018-2029
      Figure 44: Latin America Bispecific Antibody Molecular Drug Market Forecast (USD Billion), by Brazil, 2018-2029
      Figure 45: Latin America Bispecific Antibody Molecular Drug Market Forecast (USD Billion), by Mexico, 2018-2029
      Figure 46: Latin America Bispecific Antibody Molecular Drug Market Forecast (USD Billion), by Rest of Latin America, 2018-2029
      Figure 47: Europe Bispecific Antibody Molecular Drug Market Value Share (%), By Segment 1, 2022 & 2029
      Figure 48: Europe Bispecific Antibody Molecular Drug Market Forecast (USD Billion), by Sub-Segment 1, 2018-2029
      Figure 49: Europe Bispecific Antibody Molecular Drug Market Forecast (USD Billion), by Sub-Segment 2, 2018-2029
      Figure 50: Europe Bispecific Antibody Molecular Drug Market Value Share (%), By Segment 2, 2022 & 2029
      Figure 51: Europe Bispecific Antibody Molecular Drug Market Forecast (USD Billion), by Sub-Segment 1, 2018-2029
      Figure 52: Europe Bispecific Antibody Molecular Drug Market Forecast (USD Billion), by Sub-Segment 2, 2018-2029
      Figure 53: Europe Bispecific Antibody Molecular Drug Market Forecast (USD Billion), by Sub-Segment 3, 2018-2029
      Figure 54: Europe Bispecific Antibody Molecular Drug Market Forecast (USD Billion), by Others, 2018-2029
      Figure 55: Europe Bispecific Antibody Molecular Drug Market Value Share (%), By Segment 3, 2022 & 2029
      Figure 56: Europe Bispecific Antibody Molecular Drug Market Forecast (USD Billion), by Sub-Segment 1, 2018-2029
      Figure 57: Europe Bispecific Antibody Molecular Drug Market Forecast (USD Billion), by Sub-Segment 2, 2018-2029
      Figure 58: Europe Bispecific Antibody Molecular Drug Market Forecast (USD Billion), by Sub-Segment 3, 2018-2029
      Figure 59: Europe Bispecific Antibody Molecular Drug Market Forecast (USD Billion), by Others, 2018-2029
      Figure 60: Europe Bispecific Antibody Molecular Drug Market Forecast (USD Billion), by U.K., 2018-2029
      Figure 61: Europe Bispecific Antibody Molecular Drug Market Forecast (USD Billion), by Germany, 2018-2029
      Figure 62: Europe Bispecific Antibody Molecular Drug Market Forecast (USD Billion), by France, 2018-2029
      Figure 63: Europe Bispecific Antibody Molecular Drug Market Forecast (USD Billion), by Italy, 2018-2029
      Figure 64: Europe Bispecific Antibody Molecular Drug Market Forecast (USD Billion), by Spain, 2018-2029
      Figure 65: Europe Bispecific Antibody Molecular Drug Market Forecast (USD Billion), by Russia, 2018-2029
      Figure 66: Europe Bispecific Antibody Molecular Drug Market Forecast (USD Billion), by Rest of Europe, 2018-2029
      Figure 67: Asia Pacific Bispecific Antibody Molecular Drug Market Value Share (%), By Segment 1, 2022 & 2029
      Figure 68: Asia Pacific Bispecific Antibody Molecular Drug Market Forecast (USD Billion), by Sub-Segment 1, 2018-2029
      Figure 69: Asia Pacific Bispecific Antibody Molecular Drug Market Forecast (USD Billion), by Sub-Segment 2, 2018-2029
      Figure 70: Asia Pacific Bispecific Antibody Molecular Drug Market Value Share (%), By Segment 2, 2022 & 2029
      Figure 71: Asia Pacific Bispecific Antibody Molecular Drug Market Forecast (USD Billion), by Sub-Segment 1, 2018-2029
      Figure 72: Asia Pacific Bispecific Antibody Molecular Drug Market Forecast (USD Billion), by Sub-Segment 2, 2018-2029
      Figure 73: Asia Pacific Bispecific Antibody Molecular Drug Market Forecast (USD Billion), by Sub-Segment 3, 2018-2029
      Figure 74: Asia Pacific Bispecific Antibody Molecular Drug Market Forecast (USD Billion), by Others, 2018-2029
      Figure 75: Asia Pacific Bispecific Antibody Molecular Drug Market Value Share (%), By Segment 3, 2022 & 2029
      Figure 76: Asia Pacific Bispecific Antibody Molecular Drug Market Forecast (USD Billion), by Sub-Segment 1, 2018-2029
      Figure 77: Asia Pacific Bispecific Antibody Molecular Drug Market Forecast (USD Billion), by Sub-Segment 2, 2018-2029
      Figure 78: Asia Pacific Bispecific Antibody Molecular Drug Market Forecast (USD Billion), by Sub-Segment 3, 2018-2029
      Figure 79: Asia Pacific Bispecific Antibody Molecular Drug Market Forecast (USD Billion), by Others, 2018-2029
      Figure 80: Asia Pacific Bispecific Antibody Molecular Drug Market Forecast (USD Billion), by China, 2018-2029
      Figure 81: Asia Pacific Bispecific Antibody Molecular Drug Market Forecast (USD Billion), by India, 2018-2029
      Figure 82: Asia Pacific Bispecific Antibody Molecular Drug Market Forecast (USD Billion), by Japan, 2018-2029
      Figure 83: Asia Pacific Bispecific Antibody Molecular Drug Market Forecast (USD Billion), by Australia, 2018-2029
      Figure 84: Asia Pacific Bispecific Antibody Molecular Drug Market Forecast (USD Billion), by Southeast Asia, 2018-2029
      Figure 85: Asia Pacific Bispecific Antibody Molecular Drug Market Forecast (USD Billion), by Rest of Asia Pacific, 2018-2029
      Figure 86: Middle East & Africa Bispecific Antibody Molecular Drug Market Value Share (%), By Segment 1, 2022 & 2029
      Figure 87: Middle East & Africa Bispecific Antibody Molecular Drug Market Forecast (USD Billion), by Sub-Segment 1, 2018-2029
      Figure 88: Middle East & Africa Bispecific Antibody Molecular Drug Market Forecast (USD Billion), by Sub-Segment 2, 2018-2029
      Figure 89: Middle East & Africa Bispecific Antibody Molecular Drug Market Value Share (%), By Segment 2, 2022 & 2029
      Figure 90: Middle East & Africa Bispecific Antibody Molecular Drug Market Forecast (USD Billion), by Sub-Segment 1, 2018-2029
      Figure 91: Middle East & Africa Bispecific Antibody Molecular Drug Market Forecast (USD Billion), by Sub-Segment 2, 2018-2029
      Figure 92: Middle East & Africa Bispecific Antibody Molecular Drug Market Forecast (USD Billion), by Sub-Segment 3, 2018-2029
      Figure 93: Middle East & Africa Bispecific Antibody Molecular Drug Market Forecast (USD Billion), by Others, 2018-2029
      Figure 94: Middle East & Africa Bispecific Antibody Molecular Drug Market Value Share (%), By Segment 3, 2022 & 2029
      Figure 95: Middle East & Africa Bispecific Antibody Molecular Drug Market Forecast (USD Billion), by Sub-Segment 1, 2018-2029
      Figure 96: Middle East & Africa Bispecific Antibody Molecular Drug Market Forecast (USD Billion), by Sub-Segment 2, 2018-2029
      Figure 97: Middle East & Africa Bispecific Antibody Molecular Drug Market Forecast (USD Billion), by Sub-Segment 3, 2018-2029
      Figure 98: Middle East & Africa Bispecific Antibody Molecular Drug Market Forecast (USD Billion), by Others, 2018-2029
      Figure 99: Middle East & Africa Bispecific Antibody Molecular Drug Market Forecast (USD Billion), by GCC, 2018-2029
      Figure 100: Middle East & Africa Bispecific Antibody Molecular Drug Market Forecast (USD Billion), by South Africa, 2018-2029
      Figure 101: Middle East & Africa Bispecific Antibody Molecular Drug Market Forecast (USD Billion), by Rest of Middle East & Africa, 2018-2029 
      List of Tables
      Table 1: Global Bispecific Antibody Molecular Drug Market Revenue (USD Billion) Forecast, by Segment 1, 2018-2029
      Table 2: Global Bispecific Antibody Molecular Drug Market Revenue (USD Billion) Forecast, by Segment 2, 2018-2029
      Table 3: Global Bispecific Antibody Molecular Drug Market Revenue (USD Billion) Forecast, by Segment 3, 2018-2029
      Table 4: Global Bispecific Antibody Molecular Drug Market Revenue (USD Billion) Forecast, by Region, 2018-2029
      Table 5: North America Bispecific Antibody Molecular Drug Market Revenue (USD Billion) Forecast, by Segment 1, 2018-2029
      Table 6: North America Bispecific Antibody Molecular Drug Market Revenue (USD Billion) Forecast, by Segment 2, 2018-2029
      Table 7: North America Bispecific Antibody Molecular Drug Market Revenue (USD Billion) Forecast, by Segment 3, 2018-2029
      Table 8: North America Bispecific Antibody Molecular Drug Market Revenue (USD Billion) Forecast, by Country, 2018-2029
      Table 9: Europe Bispecific Antibody Molecular Drug Market Revenue (USD Billion) Forecast, by Segment 1, 2018-2029
      Table 10: Europe Bispecific Antibody Molecular Drug Market Revenue (USD Billion) Forecast, by Segment 2, 2018-2029
      Table 11: Europe Bispecific Antibody Molecular Drug Market Revenue (USD Billion) Forecast, by Segment 3, 2018-2029
      Table 12: Europe Bispecific Antibody Molecular Drug Market Revenue (USD Billion) Forecast, by Country, 2018-2029
      Table 13: Latin America Bispecific Antibody Molecular Drug Market Revenue (USD Billion) Forecast, by Segment 1, 2018-2029
      Table 14: Latin America Bispecific Antibody Molecular Drug Market Revenue (USD Billion) Forecast, by Segment 2, 2018-2029
      Table 15: Latin America Bispecific Antibody Molecular Drug Market Revenue (USD Billion) Forecast, by Segment 3, 2018-2029
      Table 16: Latin America Bispecific Antibody Molecular Drug Market Revenue (USD Billion) Forecast, by Country, 2018-2029
      Table 17: Asia Pacific Bispecific Antibody Molecular Drug Market Revenue (USD Billion) Forecast, by Segment 1, 2018-2029
      Table 18: Asia Pacific Bispecific Antibody Molecular Drug Market Revenue (USD Billion) Forecast, by Segment 2, 2018-2029
      Table 19: Asia Pacific Bispecific Antibody Molecular Drug Market Revenue (USD Billion) Forecast, by Segment 3, 2018-2029
      Table 20: Asia Pacific Bispecific Antibody Molecular Drug Market Revenue (USD Billion) Forecast, by Country, 2018-2029
      Table 21: Middle East & Africa Bispecific Antibody Molecular Drug Market Revenue (USD Billion) Forecast, by Segment 1, 2018-2029
      Table 22: Middle East & Africa Bispecific Antibody Molecular Drug Market Revenue (USD Billion) Forecast, by Segment 2, 2018-2029
      Table 23: Middle East & Africa Bispecific Antibody Molecular Drug Market Revenue (USD Billion) Forecast, by Segment 3, 2018-2029
      Table 24: Middle East & Africa Bispecific Antibody Molecular Drug Market Revenue (USD Billion) Forecast, by Country, 2018-2029
      Research Process

      Data Library Research are conducted by industry experts who offer insight on industry structure, market segmentations technology assessment and competitive landscape (CL), and penetration, as well as on emerging trends. Their analysis is based on primary interviews (~ 80%) and secondary research (~ 20%) as well as years of professional expertise in their respective industries. Adding to this, by analysing historical trends and current market positions, our analysts predict where the market will be headed for the next five years. Furthermore, the varying trends of segment & categories geographically presented are also studied and the estimated based on the primary & secondary research.

      In this particular report from the supply side Data Library Research has conducted primary surveys (interviews) with the key level executives (VP, CEO’s, Marketing Director, Business Development Manager and SOFT) of the companies that active & prominent as well as the midsized organization

      FIGURE 1: DLR RESEARH PROCESS

      research-methodology1

      Primary Research

      Extensive primary research was conducted to gain a deeper insight of the market and industry performance. The analysis is based on both primary and secondary research as well as years of professional expertise in the respective industries.

      In addition to analysing current and historical trends, our analysts predict where the market is headed over the next five years.

      It varies by segment for these categories geographically presented in the list of market tables. Speaking about this particular report we have conducted primary surveys (interviews) with the key level executives (VP, CEO’s, Marketing Director, Business Development Manager and many more) of the major players active in the market.

      Secondary Research

      Secondary research was mainly used to collect and identify information useful for the extensive, technical, market-oriented, and Friend’s study of the Global Extra Neutral Alcohol. It was also used to obtain key information about major players, market classification and segmentation according to the industry trends, geographical markets, and developments related to the market and technology perspectives. For this study, analysts have gathered information from various credible sources, such as annual reports, sec filings, journals, white papers, SOFT presentations, and company web sites.

      Market Size Estimation

      Both, top-down and bottom-up approaches were used to estimate and validate the size of the Global market and to estimate the size of various other dependent submarkets in the overall Extra Neutral Alcohol. The key players in the market were identified through secondary research and their market contributions in the respective geographies were determined through primary and secondary research.

      Forecast Model

      research-methodology2