Get Complete Analysis Of The Report - Download Updated Free Sample PDF
The growth of the Global Business TV Service Market is primarily driven by the rapid expansion of hybrid and remote work models, which has increased the need for real-time corporate broadcasting, internal communications, and training content across geographically dispersed teams. Advancements in broadband connectivity and the widespread adoption of connected and smart TVs are further enabling high-quality video delivery in commercial environments, strengthening market penetration.
The Global Business TV Service Market is witnessing several key trends that are reshaping service delivery, content strategy, and technology integration. One of the most prominent trends is the shift from traditional cable and satellite systems to IP-based, cloud-delivered Business TV platforms, enabling greater scalability, flexibility, and remote management across multi-site enterprises. Another major trend is the growing convergence of Business TV with digital signage and commercial display ecosystems, as companies increasingly deploy screens for branding, advertising, customer engagement, and real-time information delivery in retail, hospitality, transportation, and corporate environments.
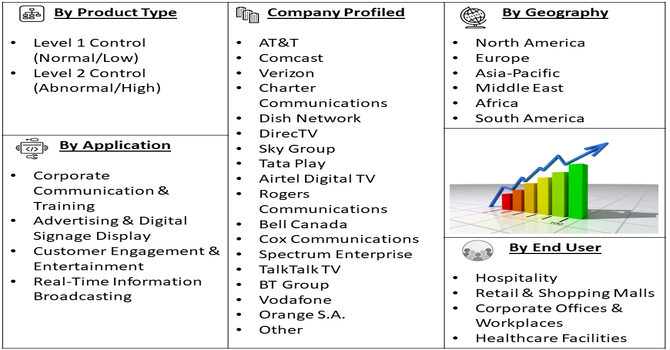
Segmentation: Global Business TV Service Market is segmented By Service Type (Cable TV Services, Satellite TV Services, OTT-Based Business TV Services), Deployment Mode (On-Premise, Cloud-Based, Hybrid Deployment), Application (Corporate Communication & Training, Advertising & Digital Signage Display, Customer Engagement & Entertainment, Real-Time Information Broadcasting), End-Use Industry (Hospitality, Retail & Shopping Malls, Corporate Offices & Workplaces, Healthcare Facilities), Distribution Channel (Direct Sales, Service Providers / Operators, Managed Service Providers (MSPs), and Geography (North America, Europe, Asia-Pacific, Middle East and Africa, and South America). The report provides the value (in USD million) for the above segments.
For Detailed Market Segmentation - Get a Free Sample PDF
Market Drivers:
A major driver of the Global Business TV Service Market is the rapid digital transformation across industries, which is pushing organizations to adopt cloud-based, IP-driven television and content delivery systems. As businesses expand geographically and operate through multiple branches, the need for a unified, centrally managed content communication platform has become essential. Cloud-based Business TV services enable enterprises to seamlessly distribute live broadcasts, announcements, training videos, promotional material, and branded content across all locations without heavy infrastructure investment. These systems also offer remote monitoring, content scheduling, analytics, and instant updates—making them far more efficient than traditional cable or satellite models.
Another strong driver is the increasing integration of Business TV services with digital signage platforms to enhance customer engagement and in-venue media experiences. For instance, 2020, Samsung Electronics UK’s launch of its new Business TVs, designed for small businesses and managed through a mobile app, strengthened the integration of business TV with digital signage and customer engagement tools. This advance simplified setup, expanded accessibility, and boosted adoption, positively influencing growth and innovation within the global business TV service market. As consumer-facing industries like retail stores, hotels, quick-service restaurants (QSRs), airports, gyms, and entertainment venues prioritize digital engagement, Business TV systems are evolving into multi-purpose communication tools. This convergence enables businesses to replace static displays with dynamic content that captures attention and drives customer conversions.
Market Restraints
A significant restraint for the Global Business TV Service Market is the high initial cost associated with deploying and integrating advanced Business TV systems—especially for large enterprises with multiple branches or customer-facing locations. Setting up a complete system often requires investments in commercial-grade displays, media players, set-top boxes, secure network infrastructure, high-bandwidth connections, and content management platforms. For industries like retail, hospitality, and transportation that operate hundreds of outlets or venues, the cumulative cost becomes substantial.
The global business TV service market is growing as more companies use television content to improve communication, branding, and customer engagement. Businesses rely on TV services to share updates, display advertisements, and create a more welcoming environment in offices, hotels, retail stores, and public spaces. The rise of high-quality digital displays and easy streaming options is helping organizations deliver clearer and more dynamic content. Many companies also prefer customizable TV solutions that match their brand and audience. As technology continues to advance, the demand for flexible, affordable, and reliable business TV services is expected to increase across different industries worldwide.
Segmental Analysis:
OTT-Based Business TV Services represent the fastest-growing segment as enterprises increasingly shift from traditional cable and satellite models toward internet-based content delivery. OTT platforms provide greater flexibility, allowing businesses to stream live channels, corporate messages, training videos, and promotional content through cloud-connected systems without dedicated hardware dependencies. Their ability to support HD/4K content, central content control, instant updates, and integration with digital signage tools makes them highly preferred across modern commercial environments. The cost efficiency, scalability, and device compatibility of OTT services continue to attract retail chains, hospitality brands, and corporate enterprises, driving substantial value growth within this segment.
Cloud-based deployment is gaining strong traction due to its ability to simplify content management and reduce infrastructure investment for enterprises. With cloud platforms, organizations can centrally manage broadcasts, schedule content, push updates, and monitor screen networks in real time across multiple locations. This model eliminates the need for significant on-premise hardware and supports seamless scalability as business operations grow. Additionally, cloud-based Business TV solutions offer enhanced security features, remote collaboration capabilities, and integration with analytics tools, making them ideal for multi-site businesses and global enterprises seeking cost-effective and agile communication systems.
The Advertising & Digital Signage Display segment is emerging as a leading application area as businesses across retail, hospitality, transportation, and workplaces increasingly deploy screens for customer engagement and revenue generation. Business TV platforms support dynamic advertisements, promotional videos, product showcases, real-time offers, and branded content, replacing static signage with digital, visually impactful communication. This segment benefits from growing demand for personalized and data-driven marketing content, as well as the integration of AI-based content scheduling and audience analytics. The rising adoption of digital signage for in-store experience enhancement and brand visibility is boosting the value contribution from this application segment.
The Hospitality segment remains a major end-user due to widespread adoption of Business TV systems in hotels, resorts, and serviced apartments. Hospitality operators rely on Business TV to deliver high-quality entertainment, multilingual channels, facility information, promotional messages, and customized in-room content to enhance guest experience. The rise of smart hotel concepts and digital guest engagement solutions is accelerating the shift toward IPTV and OTT-based Business TV platforms. Additionally, cloud-managed content allows hotel chains to maintain consistent branding and messaging across properties, further increasing the value and growth potential of this segment.
Service Providers and Operators form a dominant distribution channel as they offer bundled packages, ongoing maintenance, technical support, and large-scale deployment capabilities tailored to enterprise needs. These providers often integrate Business TV offerings with internet services, digital signage platforms, cloud CMS systems, and customized content solutions, making them a preferred choice for businesses seeking a comprehensive solution. Their established networks, competitive pricing models, and expertise in managing large client accounts contribute significantly to market value, especially for retail chains, hotels, and corporate campuses.
North America accounts for a substantial share of the market and continues to lead due to early adoption of advanced communication technologies, strong broadband infrastructure, and the presence of major Business TV service providers. Enterprises in the region actively invest in digital signage, IPTV systems, connected displays, and cloud-based communication platforms to enhance customer engagement and internal operations.
High demand from hospitality chains, retail giants, airports, corporate offices, and healthcare facilities further drives market expansion. For instance, in February 2025, Telia Company’s decision to sell its TV & Media business to Schibsted Media signaled a strategic shift toward core connectivity services, indirectly influencing the North American business TV service market. The move highlighted a broader global trend of telecom operators refocusing on connectivity while partnering with specialized media firms, reinforcing expectations for more streamlined content distribution and stronger collaboration-driven TV service models in the region.
The region’s focus on digital transformation, AI-enabled content systems, and integration with IoT-driven solutions positions North America as a high-value contributor to the global market.
| Report Matrics | Details |
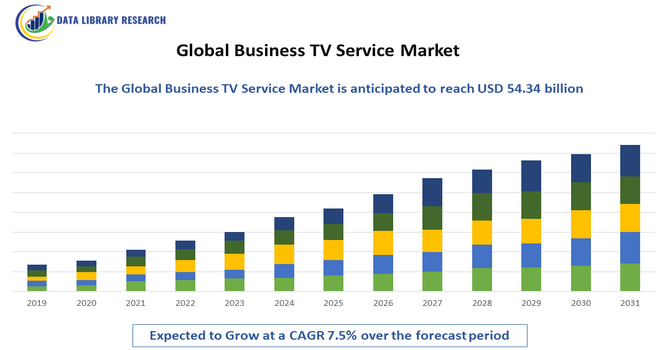
| Market Size Value | USD 54.34 billion |
| Growth Rate | CAGR of 7.5% |
| Forecast | 2026-2033 |
| Historical data | 2021-2024 |
| Base Year | 2025 |
| Report Coverage | Forecasted revenue, company rating, competitive environment, growth drivers, and trends |
| Segment Coverage | Type, Application, End-User, Geography |
| Regional Scope | North America, Europe, Asia Pacific, Middle East |
| Customized scope | Free customization of reports (With 3 months' analysis support) |
| To Learn More About This Report | Request a Free Sample Copy |
The competitive landscape of the Global Business TV Service Market is characterized by a mix of established telecommunications providers, cable and satellite operators, IPTV/OTT platform providers, and digital signage technology companies competing to deliver advanced content distribution, enterprise communication, and customer engagement solutions. Companies are focusing on cloud-based service models, AI-driven content management, personalized advertising capabilities, and integrated digital signage platforms to strengthen their market presence. Strategic partnerships, multi-location deployment capabilities, and bundled service offerings are key competitive strategies used to capture enterprise clients across hospitality, retail, corporate, healthcare, and transportation sectors. The market is also witnessing increased innovation in high-definition streaming, real-time broadcasting, and unified communication integration, intensifying competition among global and regional players.
The major players for this market are:
Recent Development
Q1. What are the main growth-driving factors for this market?
The biggest driver is the rapidly rising global number of people suffering from chronic diseases like diabetes and hypertension. Since microalbuminuria is an early warning sign of kidney damage in these patients, the growing need for routine monitoring and early detection testing fuels the demand for high-quality control materials.
Q2. What are the main restraining factors for this market?
A key challenge is the high cost of advanced diagnostic equipment and the associated control solutions, which limits adoption in developing or resource-constrained countries. Another restraint is ensuring standardization and accuracy across different types of testing platforms and reagent kits, which affects reliability.
Q3. Which segment is expected to witness high growth?
The segment related to Point-of-Care (POC) Testing is expected to show high growth. This involves portable microalbumin control kits used outside central laboratories, such as in doctor's offices or for home testing. This trend makes monitoring quicker and more accessible for chronic disease management.
Q4. Who are the top major players for this market?
Top major players include established companies specializing in diagnostics and laboratory quality control. Leading firms are typically large manufacturers such as Bio-Rad Laboratories, Quantimetrix, and Randox Laboratories, which provide certified control materials for accurate clinical testing.
Q5. Which country is the largest player?
North America, specifically the United States, holds the largest market share. This dominance is due to its advanced healthcare infrastructure, high prevalence of chronic diseases, and widespread adoption of stringent quality control practices in clinical laboratories and hospitals.
Data Library Research are conducted by industry experts who offer insight on industry structure, market segmentations technology assessment and competitive landscape (CL), and penetration, as well as on emerging trends. Their analysis is based on primary interviews (~ 80%) and secondary research (~ 20%) as well as years of professional expertise in their respective industries. Adding to this, by analysing historical trends and current market positions, our analysts predict where the market will be headed for the next five years. Furthermore, the varying trends of segment & categories geographically presented are also studied and the estimated based on the primary & secondary research.
In this particular report from the supply side Data Library Research has conducted primary surveys (interviews) with the key level executives (VP, CEO’s, Marketing Director, Business Development Manager and SOFT) of the companies that active & prominent as well as the midsized organization
FIGURE 1: DLR RESEARH PROCESS
Extensive primary research was conducted to gain a deeper insight of the market and industry performance. The analysis is based on both primary and secondary research as well as years of professional expertise in the respective industries.
In addition to analysing current and historical trends, our analysts predict where the market is headed over the next five years.
It varies by segment for these categories geographically presented in the list of market tables. Speaking about this particular report we have conducted primary surveys (interviews) with the key level executives (VP, CEO’s, Marketing Director, Business Development Manager and many more) of the major players active in the market.
Secondary ResearchSecondary research was mainly used to collect and identify information useful for the extensive, technical, market-oriented, and Friend’s study of the Global Extra Neutral Alcohol. It was also used to obtain key information about major players, market classification and segmentation according to the industry trends, geographical markets, and developments related to the market and technology perspectives. For this study, analysts have gathered information from various credible sources, such as annual reports, sec filings, journals, white papers, SOFT presentations, and company web sites.
Market Size EstimationBoth, top-down and bottom-up approaches were used to estimate and validate the size of the Global market and to estimate the size of various other dependent submarkets in the overall Extra Neutral Alcohol. The key players in the market were identified through secondary research and their market contributions in the respective geographies were determined through primary and secondary research.
Forecast Model