Capillary Gel Electrophoresis CGE Service Market Overview and Analysis
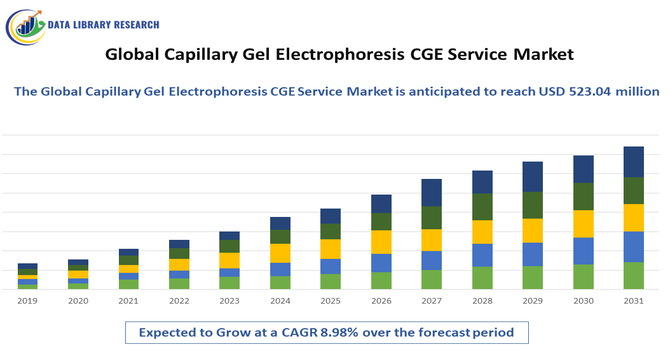
- The Global Capillary Gel Electrophoresis (CGE) Service Market size was estimated at USD 370.3 million in 2026 and is projected to reach USD 523.04 million by 2034, growing with a CAGR of 8.98% from 2026-2033.
Get Complete Analysis Of The Report - Download Updated Free Sample PDF
The Global Capillary Gel Electrophoresis (CGE) Service Market encompasses services offering high-resolution analytical techniques for separating and characterizing biomolecules such as proteins, nucleic acids, and polymers. CGE services are widely used in pharmaceutical, biotechnology, and clinical research for quality control, drug development, and molecular diagnostics. The market includes contract research organizations (CROs) and specialized service providers delivering CGE-based analysis, method development, and validation. Key drivers include increasing biologics development, demand for precision analytics, and the need for rapid, reproducible, and automated molecular characterization.
Capillary Gel Electrophoresis CGE Service Market Latest Trends
The CGE service market has witnessed rapid growth driven by increasing adoption of biologics, biosimilars, and advanced therapeutic proteins. Automation, miniaturization, and high-throughput CGE systems are reshaping workflows, enabling faster and more precise molecular analysis. Integration with advanced data analytics and cloud-based platforms is enhancing result interpretation and reproducibility. Additionally, rising demand for contract analytical services is prompting CROs to expand CGE offerings. The market also trends toward multiplexing and capillary array technologies, improving throughput.
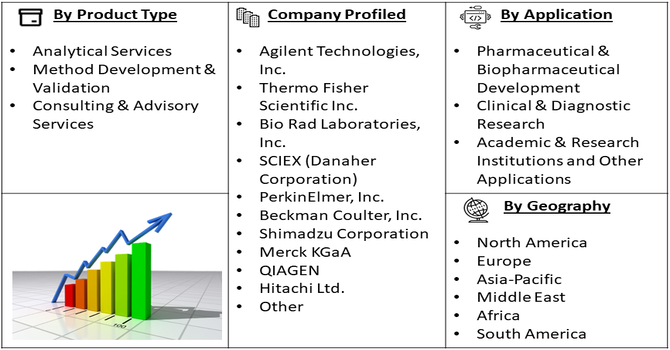
Segmentation: The Global Capillary Gel Electrophoresis (CGE) Service Market is segmented by Service Type (Analytical Services, Method Development & Validation and Consulting & Advisory Services), Application (Pharmaceutical & Biopharmaceutical Development, Clinical & Diagnostic Research, Academic & Research Institutions and Other Applications), Technology (Capillary Gel Electrophoresis (CGE), Capillary Array Electrophoresis (CAE) and Microfluidics-based CGE), and Geography (North America, Europe, Asia-Pacific, Middle East and Africa, and South America). The report provides the value (in USD million) for the above segments.
For Detailed Market Segmentation - Get a Free Sample PDF
Market Drivers:
- Increasing Biologics and Biosimilars Development
The rapid growth of biologics, biosimilars, and advanced therapeutic proteins has significantly driven the CGE service market. Biopharmaceutical companies require precise molecular characterization to ensure protein purity, stability, and efficacy, making CGE an essential analytical tool. The rise in monoclonal antibody and recombinant protein development has created high demand for outsourcing CGE services to specialized CROs. Additionally, stringent regulatory requirements for biologics necessitate robust, reproducible, and high-throughput analytical methods, further fueling CGE adoption. As more companies invest in novel therapeutics, the need for accurate preclinical and quality control analyses strengthens, supporting sustained growth in CGE service utilization globally.
- Adoption of Advanced Automation and High-Throughput Technologies
Advancements in automation, miniaturization, and high-throughput capillary gel electrophoresis technologies have propelled market growth. Automated CGE systems reduce human error, improve reproducibility, and accelerate molecular analysis workflows, making them attractive to pharmaceutical, biotechnology, and clinical research sectors. Integration with data analytics and cloud-based platforms enhances result interpretation, storage, and regulatory compliance.
Companies increasingly seek CROs offering these advanced capabilities to optimize time and resource efficiency. For instance, The Sun Lab at Michigan State University (MSU) hosted its inaugural Summer School for Capillary Electrophoresis-Mass Spectrometry (CE-MS) from July 22 to 24, 2024. The program provided practical training for five graduate students from four universities, covering coated capillary preparation, CE-MS setup for proteomics, and result validation. Funded by a National Science Foundation (NSF) CAREER Award grant, the successful event is scheduled to be repeated in summer 2025.
Market Restraints:
- High Operational Costs and Specialized Expertise Requirement
Despite its advantages, the CGE service market faces challenges due to high operational costs and the need for highly skilled personnel. Specialized instrumentation, reagents, and maintenance expenses make it expensive for small-scale laboratories or emerging market players to adopt CGE internally. Moreover, method development, validation, and data interpretation require trained scientists with expertise in molecular biology and analytical chemistry. These factors limit widespread adoption and may force companies to rely on outsourcing, which can introduce project management and timeline complexities. High costs and expertise barriers act as a significant restraint, potentially slowing market penetration, especially in developing regions with limited analytical infrastructure.
Socioeconomic Impact on Capillary Gel Electrophoresis CGE Service Market
The CGE service market contributes significantly to healthcare and economic development. By enabling precise protein and nucleic acid analysis, it accelerates drug discovery, biopharmaceutical quality control, and diagnostic innovations, ultimately improving patient outcomes. Expansion of CROs offering CGE services generates employment for skilled technicians, scientists, and bioinformaticians. The market also supports academic research and fosters collaborations across biotech hubs worldwide. Economically, it reduces the cost and time of biologics development through outsourcing and efficient workflows. Access to high-quality analytical services promotes equitable healthcare advancements, enabling emerging economies to participate in global biopharmaceutical innovation and improve local healthcare infrastructure.
Segmental Analysis:
- Analytical Services segment is expected to witness highest growth over the forecast period
The analytical services segment is projected to experience the highest growth over the forecast period due to the increasing reliance on outsourced, high-precision molecular characterization. Pharmaceutical, biopharmaceutical, and academic organizations increasingly prefer CGE service providers for protein, nucleic acid, and polymer analysis, ensuring accurate, reproducible, and regulatory-compliant results. The demand for routine quality control, stability studies, and biomolecule profiling has surged, driven by biologics and biosimilar development. Advanced analytical services incorporating automation, high-throughput capillary arrays, and cloud-based data management have further boosted adoption. This segment’s growth is reinforced by the cost-effectiveness and efficiency of outsourcing over in-house CGE infrastructure.
- Pharmaceutical & Biopharmaceutical Development segment is expected to witness highest growth over the forecast period
The pharmaceutical and biopharmaceutical development segment is anticipated to witness the highest growth over the forecast period. Increasing investments in monoclonal antibodies, recombinant proteins, gene therapies, and biosimilars are driving demand for precise, high-throughput molecular analysis. CGE services play a critical role in ensuring quality, stability, and regulatory compliance throughout drug discovery and development. Outsourcing CGE workflows allows companies to accelerate preclinical studies and reduce operational costs. Furthermore, stringent FDA and EMA regulations for biologics necessitate accurate characterization, validating the role of specialized CGE service providers. Rising R&D expenditure globally has made this segment a primary growth driver.
- Capillary Gel Electrophoresis (CGE) segment is expected to witness highest growth over the forecast period
The CGE technology segment is expected to achieve the highest growth over the forecast period due to its widespread adoption for protein, nucleic acid, and polymer analysis. CGE offers high resolution, reproducibility, and automation compared with traditional electrophoresis techniques, making it a preferred choice in pharmaceutical, biotech, and clinical research. Continuous technological advancements, such as microfluidic integration and capillary array systems, have enhanced throughput and efficiency, attracting greater demand from CROs and service laboratories. The capability of CGE to support regulatory compliance, method validation, and high-volume analysis strengthens its market position, driving rapid adoption across research, preclinical, and quality control applications.
- North American Region is expected to witness highest growth over the forecast period
The North American region is projected to witness the highest growth over the forecast period, driven by the U.S. and Canada’s robust pharmaceutical and biotechnology sectors. High R&D investment, advanced laboratory infrastructure, and a strong presence of CROs and analytical service providers support CGE service adoption. For instance, In June 2024, CMP Scientific introduced the BioSummit CVA system, an advanced Capillary Electrophoresis-Mass Spectrometry (cIEF-MS) platform tailored for precise charge variant analysis of protein therapeutics. This system incorporates the innovative EMASS-II CE-MS technology, streamlines workflows for greater efficiency, and includes proprietary data analysis software to enhance sensitivity and analytical strength.
Similarly, In May 2022, Promega introduced the Spectrum CE System, a new capillary electrophoresis instrument that supports advanced 8-color STR analysis while maintaining full compatibility with existing 5- and 6-color kits. The system features flexible plate handling, streamlined workflows, and intuitive software designed to simplify forensic DNA analysis.
Strict regulatory frameworks from the FDA and growing demand for biologics, monoclonal antibodies, and gene therapies further accelerate the market. The region’s early adoption of automated, high-throughput CGE technologies, coupled with increasing outsourcing trends, enhances operational efficiency. North America’s leadership in innovation and healthcare IT integration positions it as the largest and fastest-growing regional market.
| Report Matrics |
Details |
| Market Size Value |
USD 523.04 million |
| Growth Rate |
CAGR of 8.98 % |
| Forecast |
2026-2033 |
| Historical data |
2021-2024 |
| Base Year |
2025 |
| Report Coverage |
Forecasted revenue, company rating, competitive environment, growth drivers, and trends |
| Segment Coverage |
Type, Application, End-User, Geography |
| Regional Scope |
North America, Europe, Asia Pacific, Middle East |
| Customized scope |
Free customization of reports (With 3 months' Analysis Support ) |
| To Learn More About This Report |
Request a Free Sample Copy |
Capillary Gel Electrophoresis CGE Service Market Competitive Landscape
The CGE service market is highly competitive, dominated by specialized analytical service providers, global CROs, and instrument manufacturers offering end-to-end solutions. Key players differentiate through technological innovation, automation, and high-throughput capabilities. Strategic partnerships, acquisitions, and geographic expansion are common to enhance service portfolios and client reach. Companies invest in proprietary CGE methods, regulatory-compliant workflows, and integrated data management solutions to maintain competitive advantage. Small and regional players focus on niche services or specialized biomolecule analysis. Continuous innovation, such as capillary array technology, microfluidics, and cloud-enabled analytics, defines the competitive dynamics, driving service quality, efficiency, and adoption across pharmaceutical, biotech, and academic sectors.
The major players are:
- Agilent Technologies, Inc.
- Thermo Fisher Scientific Inc.
- Bio Rad Laboratories, Inc.
- SCIEX (Danaher Corporation)
- PerkinElmer, Inc.
- Beckman Coulter, Inc.
- Shimadzu Corporation
- Promega Corporation
- Lumex Instruments
- LABGENE Scientific SA
- Merck KGaA
- QIAGEN
- Hitachi Ltd.
- Teledyne Technologies Incorporated
- Avance Biosciences / AvanceBio
- Charles River Laboratories International, Inc.
- BioDuro Sundia
- Solvias
- PolyAnalytik Inc.
- Crown Bioscience
Recent Development
- In January 2024, Agilent Technologies announced a new automated parallel capillary electrophoresis ‘ProteoAnalyzer’ system designed to enhance proteomics research and analysis capabilities. The system integrated advanced liquid chromatography with mass spectrometry (LC-MS) technologies, offering improved sensitivity and throughput for protein characterization and identification. This innovation aimed to address the growing demand for high-resolution proteomics solutions in pharmaceutical research, biomarker discovery, and clinical diagnostics.
- In May 2022, QIAGEN expanded its automation capabilities with the introduction of the QIAxcel Connect, a high-performance capillary electrophoresis instrument that offers rapid, precise, and ultra-sensitive analysis for nucleic acid detection. This latest addition to QIAGEN's automation solutions enables high-speed, high-resolution, and high-sensitivity results for a range of applications
Frequently Asked Questions (FAQ) :
Q1. What are the main growth-driving factors for this market?
The market thrived due to the rising demand for high-resolution biomolecule analysis in biopharmaceutical research. Increasing investments in proteomics and genomics, coupled with the automation of DNA sequencing, accelerated adoption. Furthermore, the expansion of the biologics pipeline and the need for rigorous quality control in biosimilar production fueled global service demand.
Q2. What are the main restraining factors for this market?
High capital investment for sophisticated electrophoresis equipment and expensive specialized reagents acted as significant barriers. Additionally, the availability of alternative high-performance liquid chromatography (HPLC) techniques and a shortage of skilled laboratory technicians slowed market expansion. Stringent regulatory approval processes for diagnostic applications also limited the immediate entry of new service providers.
Q3. Which segment is expected to witness high growth?
The DNA sequencing and analysis segment witnessed the most robust growth. This surge was driven by the increasing prevalence of genetic disorders and the widespread adoption of personalized medicine. As researchers required faster, more accurate mapping of complex genetic structures, CGE services became indispensable for modern forensic science and clinical diagnostics.
Q4. Who are the top major players for this market?
The competitive landscape featured prominent leaders including AB Sciex (Danaher Corporation), Thermo Fisher Scientific, and Agilent Technologies. Other influential participants such as PerkinElmer, Bio-Rad Laboratories, and Qiagen also maintained significant market shares. These companies stayed ahead by offering integrated service platforms, advanced capillary systems, and comprehensive technical support to laboratories.
Q5. Which country is the largest player?
The United States stood as the largest player in the global CGE service market. Its dominance was underpinned by a massive biopharmaceutical sector, extensive government funding for medical research, and early adoption of advanced analytical technologies. A dense concentration of leading biotechnology firms and research universities further solidified its market leadership/
List of Figures
Figure 1: Global Capillary Gel Electrophoresis CGE Service Market Revenue Breakdown (USD Billion, %) by Region, 2022 & 2029
Figure 2: Global Capillary Gel Electrophoresis CGE Service Market Value Share (%), By Segment 1, 2022 & 2029
Figure 3: Global Capillary Gel Electrophoresis CGE Service Market Forecast (USD Billion), by Sub-Segment 1, 2018-2029
Figure 4: Global Capillary Gel Electrophoresis CGE Service Market Forecast (USD Billion), by Sub-Segment 2, 2018-2029
Figure 5: Global Capillary Gel Electrophoresis CGE Service Market Value Share (%), By Segment 2, 2022 & 2029
Figure 6: Global Capillary Gel Electrophoresis CGE Service Market Forecast (USD Billion), by Sub-Segment 1, 2018-2029
Figure 7: Global Capillary Gel Electrophoresis CGE Service Market Forecast (USD Billion), by Sub-Segment 2, 2018-2029
Figure 8: Global Capillary Gel Electrophoresis CGE Service Market Forecast (USD Billion), by Sub-Segment 3, 2018-2029
Figure 9: Global Capillary Gel Electrophoresis CGE Service Market Forecast (USD Billion), by Others, 2018-2029
Figure 10: Global Capillary Gel Electrophoresis CGE Service Market Value Share (%), By Segment 3, 2022 & 2029
Figure 11: Global Capillary Gel Electrophoresis CGE Service Market Forecast (USD Billion), by Sub-Segment 1, 2018-2029
Figure 12: Global Capillary Gel Electrophoresis CGE Service Market Forecast (USD Billion), by Sub-Segment 2, 2018-2029
Figure 13: Global Capillary Gel Electrophoresis CGE Service Market Forecast (USD Billion), by Sub-Segment 3, 2018-2029
Figure 14: Global Capillary Gel Electrophoresis CGE Service Market Forecast (USD Billion), by Others, 2018-2029
Figure 15: Global Capillary Gel Electrophoresis CGE Service Market Value (USD Billion), by Region, 2022 & 2029
Figure 16: North America Capillary Gel Electrophoresis CGE Service Market Value Share (%), By Segment 1, 2022 & 2029
Figure 17: North America Capillary Gel Electrophoresis CGE Service Market Forecast (USD Billion), by Sub-Segment 1, 2018-2029
Figure 18: North America Capillary Gel Electrophoresis CGE Service Market Forecast (USD Billion), by Sub-Segment 2, 2018-2029
Figure 19: North America Capillary Gel Electrophoresis CGE Service Market Value Share (%), By Segment 2, 2022 & 2029
Figure 20: North America Capillary Gel Electrophoresis CGE Service Market Forecast (USD Billion), by Sub-Segment 1, 2018-2029
Figure 21: North America Capillary Gel Electrophoresis CGE Service Market Forecast (USD Billion), by Sub-Segment 2, 2018-2029
Figure 22: North America Capillary Gel Electrophoresis CGE Service Market Forecast (USD Billion), by Sub-Segment 3, 2018-2029
Figure 23: North America Capillary Gel Electrophoresis CGE Service Market Forecast (USD Billion), by Others, 2018-2029
Figure 24: North America Capillary Gel Electrophoresis CGE Service Market Value Share (%), By Segment 3, 2022 & 2029
Figure 25: North America Capillary Gel Electrophoresis CGE Service Market Forecast (USD Billion), by Sub-Segment 1, 2018-2029
Figure 26: North America Capillary Gel Electrophoresis CGE Service Market Forecast (USD Billion), by Sub-Segment 2, 2018-2029
Figure 27: North America Capillary Gel Electrophoresis CGE Service Market Forecast (USD Billion), by Sub-Segment 3, 2018-2029
Figure 28: North America Capillary Gel Electrophoresis CGE Service Market Forecast (USD Billion), by Others, 2018-2029
Figure 29: North America Capillary Gel Electrophoresis CGE Service Market Forecast (USD Billion), by U.S., 2018-2029
Figure 30: North America Capillary Gel Electrophoresis CGE Service Market Forecast (USD Billion), by Canada, 2018-2029
Figure 31: Latin America Capillary Gel Electrophoresis CGE Service Market Value Share (%), By Segment 1, 2022 & 2029
Figure 32: Latin America Capillary Gel Electrophoresis CGE Service Market Forecast (USD Billion), by Sub-Segment 1, 2018-2029
Figure 33: Latin America Capillary Gel Electrophoresis CGE Service Market Forecast (USD Billion), by Sub-Segment 2, 2018-2029
Figure 34: Latin America Capillary Gel Electrophoresis CGE Service Market Value Share (%), By Segment 2, 2022 & 2029
Figure 35: Latin America Capillary Gel Electrophoresis CGE Service Market Forecast (USD Billion), by Sub-Segment 1, 2018-2029
Figure 36: Latin America Capillary Gel Electrophoresis CGE Service Market Forecast (USD Billion), by Sub-Segment 2, 2018-2029
Figure 37: Latin America Capillary Gel Electrophoresis CGE Service Market Forecast (USD Billion), by Sub-Segment 3, 2018-2029
Figure 38: Latin America Capillary Gel Electrophoresis CGE Service Market Forecast (USD Billion), by Others, 2018-2029
Figure 39: Latin America Capillary Gel Electrophoresis CGE Service Market Value Share (%), By Segment 3, 2022 & 2029
Figure 40: Latin America Capillary Gel Electrophoresis CGE Service Market Forecast (USD Billion), by Sub-Segment 1, 2018-2029
Figure 41: Latin America Capillary Gel Electrophoresis CGE Service Market Forecast (USD Billion), by Sub-Segment 2, 2018-2029
Figure 42: Latin America Capillary Gel Electrophoresis CGE Service Market Forecast (USD Billion), by Sub-Segment 3, 2018-2029
Figure 43: Latin America Capillary Gel Electrophoresis CGE Service Market Forecast (USD Billion), by Others, 2018-2029
Figure 44: Latin America Capillary Gel Electrophoresis CGE Service Market Forecast (USD Billion), by Brazil, 2018-2029
Figure 45: Latin America Capillary Gel Electrophoresis CGE Service Market Forecast (USD Billion), by Mexico, 2018-2029
Figure 46: Latin America Capillary Gel Electrophoresis CGE Service Market Forecast (USD Billion), by Rest of Latin America, 2018-2029
Figure 47: Europe Capillary Gel Electrophoresis CGE Service Market Value Share (%), By Segment 1, 2022 & 2029
Figure 48: Europe Capillary Gel Electrophoresis CGE Service Market Forecast (USD Billion), by Sub-Segment 1, 2018-2029
Figure 49: Europe Capillary Gel Electrophoresis CGE Service Market Forecast (USD Billion), by Sub-Segment 2, 2018-2029
Figure 50: Europe Capillary Gel Electrophoresis CGE Service Market Value Share (%), By Segment 2, 2022 & 2029
Figure 51: Europe Capillary Gel Electrophoresis CGE Service Market Forecast (USD Billion), by Sub-Segment 1, 2018-2029
Figure 52: Europe Capillary Gel Electrophoresis CGE Service Market Forecast (USD Billion), by Sub-Segment 2, 2018-2029
Figure 53: Europe Capillary Gel Electrophoresis CGE Service Market Forecast (USD Billion), by Sub-Segment 3, 2018-2029
Figure 54: Europe Capillary Gel Electrophoresis CGE Service Market Forecast (USD Billion), by Others, 2018-2029
Figure 55: Europe Capillary Gel Electrophoresis CGE Service Market Value Share (%), By Segment 3, 2022 & 2029
Figure 56: Europe Capillary Gel Electrophoresis CGE Service Market Forecast (USD Billion), by Sub-Segment 1, 2018-2029
Figure 57: Europe Capillary Gel Electrophoresis CGE Service Market Forecast (USD Billion), by Sub-Segment 2, 2018-2029
Figure 58: Europe Capillary Gel Electrophoresis CGE Service Market Forecast (USD Billion), by Sub-Segment 3, 2018-2029
Figure 59: Europe Capillary Gel Electrophoresis CGE Service Market Forecast (USD Billion), by Others, 2018-2029
Figure 60: Europe Capillary Gel Electrophoresis CGE Service Market Forecast (USD Billion), by U.K., 2018-2029
Figure 61: Europe Capillary Gel Electrophoresis CGE Service Market Forecast (USD Billion), by Germany, 2018-2029
Figure 62: Europe Capillary Gel Electrophoresis CGE Service Market Forecast (USD Billion), by France, 2018-2029
Figure 63: Europe Capillary Gel Electrophoresis CGE Service Market Forecast (USD Billion), by Italy, 2018-2029
Figure 64: Europe Capillary Gel Electrophoresis CGE Service Market Forecast (USD Billion), by Spain, 2018-2029
Figure 65: Europe Capillary Gel Electrophoresis CGE Service Market Forecast (USD Billion), by Russia, 2018-2029
Figure 66: Europe Capillary Gel Electrophoresis CGE Service Market Forecast (USD Billion), by Rest of Europe, 2018-2029
Figure 67: Asia Pacific Capillary Gel Electrophoresis CGE Service Market Value Share (%), By Segment 1, 2022 & 2029
Figure 68: Asia Pacific Capillary Gel Electrophoresis CGE Service Market Forecast (USD Billion), by Sub-Segment 1, 2018-2029
Figure 69: Asia Pacific Capillary Gel Electrophoresis CGE Service Market Forecast (USD Billion), by Sub-Segment 2, 2018-2029
Figure 70: Asia Pacific Capillary Gel Electrophoresis CGE Service Market Value Share (%), By Segment 2, 2022 & 2029
Figure 71: Asia Pacific Capillary Gel Electrophoresis CGE Service Market Forecast (USD Billion), by Sub-Segment 1, 2018-2029
Figure 72: Asia Pacific Capillary Gel Electrophoresis CGE Service Market Forecast (USD Billion), by Sub-Segment 2, 2018-2029
Figure 73: Asia Pacific Capillary Gel Electrophoresis CGE Service Market Forecast (USD Billion), by Sub-Segment 3, 2018-2029
Figure 74: Asia Pacific Capillary Gel Electrophoresis CGE Service Market Forecast (USD Billion), by Others, 2018-2029
Figure 75: Asia Pacific Capillary Gel Electrophoresis CGE Service Market Value Share (%), By Segment 3, 2022 & 2029
Figure 76: Asia Pacific Capillary Gel Electrophoresis CGE Service Market Forecast (USD Billion), by Sub-Segment 1, 2018-2029
Figure 77: Asia Pacific Capillary Gel Electrophoresis CGE Service Market Forecast (USD Billion), by Sub-Segment 2, 2018-2029
Figure 78: Asia Pacific Capillary Gel Electrophoresis CGE Service Market Forecast (USD Billion), by Sub-Segment 3, 2018-2029
Figure 79: Asia Pacific Capillary Gel Electrophoresis CGE Service Market Forecast (USD Billion), by Others, 2018-2029
Figure 80: Asia Pacific Capillary Gel Electrophoresis CGE Service Market Forecast (USD Billion), by China, 2018-2029
Figure 81: Asia Pacific Capillary Gel Electrophoresis CGE Service Market Forecast (USD Billion), by India, 2018-2029
Figure 82: Asia Pacific Capillary Gel Electrophoresis CGE Service Market Forecast (USD Billion), by Japan, 2018-2029
Figure 83: Asia Pacific Capillary Gel Electrophoresis CGE Service Market Forecast (USD Billion), by Australia, 2018-2029
Figure 84: Asia Pacific Capillary Gel Electrophoresis CGE Service Market Forecast (USD Billion), by Southeast Asia, 2018-2029
Figure 85: Asia Pacific Capillary Gel Electrophoresis CGE Service Market Forecast (USD Billion), by Rest of Asia Pacific, 2018-2029
Figure 86: Middle East & Africa Capillary Gel Electrophoresis CGE Service Market Value Share (%), By Segment 1, 2022 & 2029
Figure 87: Middle East & Africa Capillary Gel Electrophoresis CGE Service Market Forecast (USD Billion), by Sub-Segment 1, 2018-2029
Figure 88: Middle East & Africa Capillary Gel Electrophoresis CGE Service Market Forecast (USD Billion), by Sub-Segment 2, 2018-2029
Figure 89: Middle East & Africa Capillary Gel Electrophoresis CGE Service Market Value Share (%), By Segment 2, 2022 & 2029
Figure 90: Middle East & Africa Capillary Gel Electrophoresis CGE Service Market Forecast (USD Billion), by Sub-Segment 1, 2018-2029
Figure 91: Middle East & Africa Capillary Gel Electrophoresis CGE Service Market Forecast (USD Billion), by Sub-Segment 2, 2018-2029
Figure 92: Middle East & Africa Capillary Gel Electrophoresis CGE Service Market Forecast (USD Billion), by Sub-Segment 3, 2018-2029
Figure 93: Middle East & Africa Capillary Gel Electrophoresis CGE Service Market Forecast (USD Billion), by Others, 2018-2029
Figure 94: Middle East & Africa Capillary Gel Electrophoresis CGE Service Market Value Share (%), By Segment 3, 2022 & 2029
Figure 95: Middle East & Africa Capillary Gel Electrophoresis CGE Service Market Forecast (USD Billion), by Sub-Segment 1, 2018-2029
Figure 96: Middle East & Africa Capillary Gel Electrophoresis CGE Service Market Forecast (USD Billion), by Sub-Segment 2, 2018-2029
Figure 97: Middle East & Africa Capillary Gel Electrophoresis CGE Service Market Forecast (USD Billion), by Sub-Segment 3, 2018-2029
Figure 98: Middle East & Africa Capillary Gel Electrophoresis CGE Service Market Forecast (USD Billion), by Others, 2018-2029
Figure 99: Middle East & Africa Capillary Gel Electrophoresis CGE Service Market Forecast (USD Billion), by GCC, 2018-2029
Figure 100: Middle East & Africa Capillary Gel Electrophoresis CGE Service Market Forecast (USD Billion), by South Africa, 2018-2029
Figure 101: Middle East & Africa Capillary Gel Electrophoresis CGE Service Market Forecast (USD Billion), by Rest of Middle East & Africa, 2018-2029
List of Tables
Table 1: Global Capillary Gel Electrophoresis CGE Service Market Revenue (USD Billion) Forecast, by Segment 1, 2018-2029
Table 2: Global Capillary Gel Electrophoresis CGE Service Market Revenue (USD Billion) Forecast, by Segment 2, 2018-2029
Table 3: Global Capillary Gel Electrophoresis CGE Service Market Revenue (USD Billion) Forecast, by Segment 3, 2018-2029
Table 4: Global Capillary Gel Electrophoresis CGE Service Market Revenue (USD Billion) Forecast, by Region, 2018-2029
Table 5: North America Capillary Gel Electrophoresis CGE Service Market Revenue (USD Billion) Forecast, by Segment 1, 2018-2029
Table 6: North America Capillary Gel Electrophoresis CGE Service Market Revenue (USD Billion) Forecast, by Segment 2, 2018-2029
Table 7: North America Capillary Gel Electrophoresis CGE Service Market Revenue (USD Billion) Forecast, by Segment 3, 2018-2029
Table 8: North America Capillary Gel Electrophoresis CGE Service Market Revenue (USD Billion) Forecast, by Country, 2018-2029
Table 9: Europe Capillary Gel Electrophoresis CGE Service Market Revenue (USD Billion) Forecast, by Segment 1, 2018-2029
Table 10: Europe Capillary Gel Electrophoresis CGE Service Market Revenue (USD Billion) Forecast, by Segment 2, 2018-2029
Table 11: Europe Capillary Gel Electrophoresis CGE Service Market Revenue (USD Billion) Forecast, by Segment 3, 2018-2029
Table 12: Europe Capillary Gel Electrophoresis CGE Service Market Revenue (USD Billion) Forecast, by Country, 2018-2029
Table 13: Latin America Capillary Gel Electrophoresis CGE Service Market Revenue (USD Billion) Forecast, by Segment 1, 2018-2029
Table 14: Latin America Capillary Gel Electrophoresis CGE Service Market Revenue (USD Billion) Forecast, by Segment 2, 2018-2029
Table 15: Latin America Capillary Gel Electrophoresis CGE Service Market Revenue (USD Billion) Forecast, by Segment 3, 2018-2029
Table 16: Latin America Capillary Gel Electrophoresis CGE Service Market Revenue (USD Billion) Forecast, by Country, 2018-2029
Table 17: Asia Pacific Capillary Gel Electrophoresis CGE Service Market Revenue (USD Billion) Forecast, by Segment 1, 2018-2029
Table 18: Asia Pacific Capillary Gel Electrophoresis CGE Service Market Revenue (USD Billion) Forecast, by Segment 2, 2018-2029
Table 19: Asia Pacific Capillary Gel Electrophoresis CGE Service Market Revenue (USD Billion) Forecast, by Segment 3, 2018-2029
Table 20: Asia Pacific Capillary Gel Electrophoresis CGE Service Market Revenue (USD Billion) Forecast, by Country, 2018-2029
Table 21: Middle East & Africa Capillary Gel Electrophoresis CGE Service Market Revenue (USD Billion) Forecast, by Segment 1, 2018-2029
Table 22: Middle East & Africa Capillary Gel Electrophoresis CGE Service Market Revenue (USD Billion) Forecast, by Segment 2, 2018-2029
Table 23: Middle East & Africa Capillary Gel Electrophoresis CGE Service Market Revenue (USD Billion) Forecast, by Segment 3, 2018-2029
Table 24: Middle East & Africa Capillary Gel Electrophoresis CGE Service Market Revenue (USD Billion) Forecast, by Country, 2018-2029
Research Process
Data Library Research are conducted by industry experts who offer insight on
industry structure, market segmentations technology assessment and competitive landscape (CL), and penetration, as well as on emerging trends. Their analysis is based on primary interviews (~ 80%) and secondary research (~ 20%) as well as years of professional expertise in their respective industries. Adding to this, by analysing historical trends and current market positions, our analysts predict where the market will be headed for the next five years. Furthermore, the varying trends of segment & categories geographically presented are also studied and the estimated based on the primary & secondary research.
In this particular report from the supply side Data Library Research has conducted primary surveys (interviews) with the key level executives (VP, CEO’s, Marketing Director, Business Development Manager
and SOFT) of the companies that active & prominent as well as the midsized organization
FIGURE 1: DLR RESEARH PROCESS
![research-methodology1]()
Primary Research
Extensive primary research was conducted to gain a deeper insight of the market and industry performance. The analysis is based on both primary and secondary research as well as years of professional expertise in the respective industries.
In addition to analysing current and historical trends, our analysts predict where the market is headed over the next five years.
It varies by segment for these categories geographically presented in the list of market tables. Speaking about this particular report we have conducted primary surveys (interviews) with the key level executives (VP, CEO’s, Marketing Director, Business Development Manager and many more) of the major players active in the market.
Secondary Research
Secondary research was mainly used to collect and identify information useful for the extensive, technical, market-oriented, and Friend’s study of the Global Extra Neutral Alcohol. It was also used to obtain key information about major players, market classification and segmentation according to the industry trends, geographical markets, and developments related to the market and technology perspectives. For this study, analysts have gathered information from various credible sources, such as annual reports, sec filings, journals, white papers, SOFT presentations, and company web sites.
Market Size Estimation
Both, top-down and bottom-up approaches were used to estimate and validate the size of the Global market and to estimate the size of various other dependent submarkets in the overall Extra Neutral Alcohol. The key players in the market were identified through secondary research and their market contributions in the respective geographies were determined through primary and secondary research.
Forecast Model
![research-methodology2]()