Chicken Polyclonal IgY Antibody Market Overview and Analysis
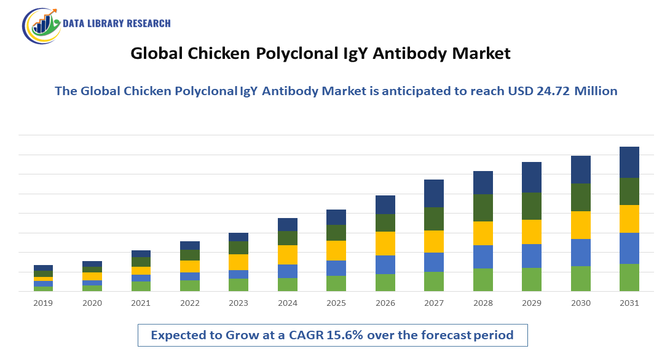
- The Chicken Polyclonal IgY Antibody Market size was valued at USD 10.31 Million in 2025 and is projected to reach USD 24.72 Million by 2032, growing at a CAGR of 15.6% during the forecast period 2025-2032.
Get Complete Analysis Of The Report - Download Updated Free Sample PDF
The Global Chicken Polyclonal IgY Antibody Market involves the production and sale of antibodies derived from chicken eggs, which are used in research, diagnostics, and healthcare. These antibodies are popular because they can target a wide range of diseases and conditions, offering a safe and effective alternative to traditional mammalian antibodies. Increasing demand in medical testing, disease diagnosis, and therapeutic applications, along with advances in biotechnology, is driving growth in this market. The market includes various players supplying these antibodies to pharmaceutical companies, research labs, and diagnostic centers worldwide, with a focus on improving health outcomes through innovative antibody solutions.
Chicken Polyclonal IgY Antibody Market Latest Trends
The Global Chicken Polyclonal IgY Antibody Market is witnessing significant growth driven by increasing demand in biomedical research, diagnostics, and therapeutic applications. A major trend is the shift towards non-mammalian antibodies like IgY due to their high specificity, low cross-reactivity with mammalian proteins, and ethical advantages since they are harvested from egg yolks without harming animals. Technological advancements have improved the extraction and purification processes, enhancing antibody quality and availability. Additionally, rising awareness about alternative antibodies in immunotherapy and veterinary diagnostics is expanding market adoption.
Segmentation: The Chicken Polyclonal IgY Antibody Market is Segmented by Source (Commercially Available and Custom Production), Application (Research, Diagnostics, Therapeutics and Veterinary), End User Industry (Pharma & Bio Tech Companies, Medical & Research and Agriculture), and Geography (North America, Europe, Asia-Pacific, Latin America, Middle East & Africa). The report provides the value (in USD million) for the above segments.

For Detailed Market Segmentation - Get a Free Sample PDF
Market Drivers:
- Growing Demand for Ethical and Sustainable Antibody Alternatives
The primary drivers of the Chicken Polyclonal IgY Antibody Market is the increasing demand for ethical and sustainable alternatives to traditional mammalian antibodies. IgY antibodies, sourced from chicken eggs, offer a non-invasive production method that avoids animal suffering, aligning with rising ethical standards in research and biotechnology. Additionally, IgY antibodies demonstrate reduced cross-reactivity with mammalian proteins, enhancing their effectiveness and reliability in diagnostics and therapeutics. These advantages have prompted widespread adoption across biomedical research, diagnostics, and veterinary medicine, fueling market growth as institutions and companies prioritize sustainability and humane practices.
- Expansion of Diagnostic and Therapeutic Applications
The expanding applications of Chicken Polyclonal IgY antibodies in diagnostics and therapeutics are a key market driver. Their high specificity and stability make them ideal for use in immunoassays, biosensors, and disease-targeted therapies. Growing prevalence of infectious diseases, cancer, and chronic conditions worldwide has increased the need for accurate diagnostic tools and innovative treatments, driving demand for reliable antibodies like IgY. Moreover, the use of IgY in veterinary diagnostics and disease management further broadens market opportunities. Continuous research uncovering new applications and improvements in antibody technology sustain strong demand and stimulate ongoing market expansion.
Market Restraints:
- Limited Awareness and Adoption Challenges
A significant restraint for the Chicken Polyclonal IgY Antibody Market is limited awareness and adoption barriers, particularly in regions where traditional mammalian antibodies have been the norm for decades. Many researchers and diagnostic developers remain unfamiliar with IgY’s advantages or hesitant to switch due to concerns about compatibility, validation, and supply consistency. Additionally, regulatory challenges and the need for standardized protocols for IgY use in clinical settings slow widespread acceptance. This lack of awareness and entrenched preferences can delay market penetration, especially in emerging markets, restricting growth potential despite the clear benefits of IgY antibodies.
Socio Economic Impact on Chicken Polyclonal IgY Antibody Market
The Chicken Polyclonal IgY Antibody Market positively impacts society and the economy by supporting advancements in medical research, diagnostics, and therapeutics that improve human and animal health. By providing a more ethical and sustainable alternative to mammalian antibodies, IgY technology reduces the need for animal testing, aligning with growing ethical standards in biotechnology. The market fosters job creation in biotech manufacturing, research, and supply chains globally. Furthermore, improved diagnostics and treatments enabled by IgY antibodies can lower healthcare costs by facilitating earlier disease detection and better-targeted therapies. This market supports innovation ecosystems, particularly in regions investing in life sciences, contributing to economic growth and enhanced public health outcomes worldwide.
Segmental Analysis:
- Custom Production Segment is Expected to Witness Significant Growth Over the Forecast Period
The Custom Production segment is poised for significant growth, fueled by the accelerating shift toward precision medicine and specialized therapeutic development. This growth is driven by researchers and diagnostic companies requiring antibodies tailored for unique, non-standard applications, such as targeting specific epitopes or achieving high species specificity that off-the-shelf products cannot meet. Custom solutions offer a comprehensive approach, allowing clients to collaborate closely with manufacturers to optimize desired affinity and specificity for novel antigen targets. The rising global investment in sophisticated biomedical research, particularly in proteomics and advanced diagnostics, further amplifies the need for bespoke IgY batches. As technologies advance, the ability to produce highly specific, customized IgY antibodies efficiently will cement this segment's rapid expansion throughout the forecast period.
- Veterinary Segment is Expected to Witness Significant Growth Over the Forecast Period
The Veterinary segment is expected to witness substantial growth, propelled by the rising global trends of pet humanization and increasing animal healthcare expenditure. IgY antibodies offer a promising, non-invasive platform for both diagnostics and passive immunization in companion and livestock animals. The demand for IgY-based solutions is accelerating due to the high prevalence of chronic diseases in pets, such as atopic dermatitis and osteoarthritis, and the growing regulatory push to curb the use of conventional antibiotics in livestock. IgY's ability to provide effective protection against common enteric infections like Salmonella and E. coli in cattle and poultry positions it as a crucial, cost-effective antimicrobial alternative, driving its widespread adoption in advanced livestock management programs worldwide.
- Agriculture Segment is Expected to Witness Significant Growth Over the Forecast Period
The Agriculture segment, primarily driven by the imperative for sustainable and antibiotic-free livestock production. Chicken Polyclonal IgY antibodies are highly valued here for passive immunization, offering effective prophylactic and therapeutic treatments against prevalent diseases affecting poultry, swine, and aquaculture. The non-mammalian origin of IgY ensures no cross-reactivity with common animal pathogens or tissue components, making it ideal for large-scale, cost-effective administration in animal feed or water. This approach provides robust humoral immunity, protecting offspring until their immune systems mature. consequently, the increasing global concern over zoonotic diseases and antibiotic resistance is compelling farmers and producers to adopt IgY as a natural, scalable biosecurity measure, underpinning this segment’s strong market expansion.
- North America Region is Expected to Witness Significant Growth Over the Forecast Period
The North America region is anticipated to maintain its dominant position and exhibit significant growth, primarily due to its robust research ecosystem and massive R&D investments. The region, already accounting for a substantial market share, benefits from the presence of numerous top-tier academic institutions, major biopharmaceutical companies, and advanced clinical research organizations. High healthcare spending and favorable government funding initiatives supporting biomedical research, especially in cancer and personalized medicine, drive the early and extensive adoption of cutting-edge IgY-based reagents and diagnostic assays. Furthermore, the well-established infrastructure facilitates rapid technological uptake and commercialization, ensuring that North America remains the leading market for primary and secondary chicken polyclonal IgY antibodies throughout the entire forecast period.
To Learn More About This Report - Request a Free Sample Copy
Chicken Polyclonal IgY Antibody Market Competitive Landscape
The competitive landscape of the Chicken Polyclonal IgY Antibody Market features a mix of established biotech companies, specialty suppliers, and emerging startups. Key players compete on factors like antibody specificity, purity, production capacity, and customization services. Companies such as Abcam, Innovative Research, and Immunology Consultants Laboratory have carved strong market positions by offering extensive product portfolios and advanced R&D capabilities. Strategic partnerships and acquisitions are common as firms seek to expand their product lines and geographic reach. Differentiation through high-quality, ethically sourced antibodies and customer support is critical. With increasing demand, new entrants focusing on innovative extraction technologies and cost-effective production methods are also gaining traction, intensifying competition and driving overall market growth.
The 20 major players for this market are:
- Merck (Millipore, etc.)
- IGY Life Sciences
- Abcam
- GenWay Biotech
- Good Biotech
- Gallus Immunotech
- Creative Diagnostics
- Agrisera
- Innovagen AB
- Capra Science
- YO Proteins
- GeneTex
- Rockland Immunochemicals
- Aves Labs
- Thermo Fisher Scientific
- Novus Biologicals
- Jackson Immun
- Research Laboratories
- Santa Cruz Biotechnology
- R&D Systems
- Bio Rad Laboratories
Recent Development:
- In April 2025, an article pub;ished by researchers of Faculty of Veterinary Medicine, “Ion Ionescu de la Brad” Iasi University of Life Sciences, Romania reported that IgY (avian immunoglobulin Y) has emerged in recent years as a versatile, ethically sustainable alternative to mammalian antibodies, showing promise across diagnostics, prophylaxis, and therapy—especially for infectious diseases, allergy, oral health, and food safety. Its advantages include large scale non invasive production (via egg yolk), low cross reactivity with mammalian immune components, and reasonable stability; it has been used for diagnostics (e.g. immunoassays), passive immunization via oral delivery, and in veterinary and One Health contexts. This trajectory suggests growing demand for well standardized, high sensitivity IgY antibodies; increased innovation in formats (e.g. oral, topical, diagnostic sensors); more companies entering or expanding in the IgY space; pressure for regulatory harmonization and quality standards; and potential shifts in pricing and production scales as applications broaden.
- In January 2024, an article published in the journal, Scientic Reports, reported that study reports a label free electrochemical impedimetric immunosensor that uses purified chicken IgY antibodies against the SARS CoV 2 spike (S) protein to detect viral antigen in nasopharyngeal clinical samples. The sensor is built on a three electrode platform functionalized with anti S IgY, and its specificity was validated via ELISA and immunoblot assays. It achieves an ultra low detection limit of 5.65 pg/mL, enabling detection without amplification, and covers a wide dynamic range from 11.56 to 740 ng/mL. Its high sensitivity and broad quantification window make it well suited for point of care (POC) diagnostics, particularly in cases with low analyte levels, potentially enabling early detection in clinical settings. Thus, this kind of research helps validate IgY as a viable, competitive alternative in diagnostic and clinical markets, potentially boosting market growth, innovation, and application diversification.
Frequently Asked Questions (FAQ) :
Q1. What the main growth driving factors for this market?
The main drivers are the unique advantages of IgY antibodies, including their high specificity, low cross-reactivity with mammalian proteins, and ethical, high-yield production from chicken egg yolks. This makes them highly desirable in diagnostic and research applications as a cost-effective alternative to traditional mammalian antibodies. Furthermore, the rising global prevalence of infectious and chronic diseases, such as cancer and autoimmune disorders, is fueling demand for reliable diagnostic kits and novel therapeutic agents based on IgY technology. Expanding adoption in veterinary medicine also acts as a significant growth catalyst.
Q2. What are the main restraining factors for this market?
The market faces significant constraints primarily related to costs and awareness. The high production costs associated with the specialized extraction and purification processes required to achieve high-purity IgY antibodies limit widespread adoption, especially in resource-constrained regions. Additionally, a lack of comprehensive awareness and familiarity with IgY technology among healthcare professionals and researchers in certain developing markets acts as a major barrier. The highly competitive nature of the antibody market, which offers numerous alternatives like monoclonal antibodies, also poses a challenge.
Q3. Which segment is expected to witness high growth?
While the academic research segment currently accounts for the largest volume of IgY antibody usage, the Commercial Application segment is poised to witness the highest rate of growth. This segment encompasses diagnostic kit manufacturing, contract research organizations (CROs), and biotech product development. Geographically, the Asia-Pacific region is projected to be the fastest-growing market. This acceleration is driven by increasing government and private investment in life sciences R&D and the rapid expansion of biotechnology industries in countries like China and India.
Q4. Who are the top major players for this market?
The competitive landscape includes established global life sciences corporations and specialized IgY firms. The top major players dominating the chicken polyclonal IgY antibody market include Merck KGaA, which supplies a substantial percentage of IgY-based kits globally, and Abcam plc, a leading antibody supplier. Other key companies are Creative Diagnostics and IGY Life Sciences, which focus on patented purification technology and specialized products. These players are focused on expanding their product panels for diagnostics and therapeutic target validation.
Q5. Which country is the largest player?
The United States (U.S.), within the broader North America region, is the largest and most dominant player in the global market, consistently holding the largest revenue share. This dominance is attributed to a highly advanced and robust biotechnology and pharmaceutical research infrastructure. The U.S. benefits from substantial private and governmental funding for life sciences research, a high concentration of leading academic and clinical research institutions, and a proactive environment for the early adoption of advanced diagnostic and therapeutic methodologies.
List of Figures
Figure 1: Global Chicken Polyclonal IgY Antibody Market Revenue Breakdown (USD Billion, %) by Region, 2023 & 2029
Figure 2: Global Chicken Polyclonal IgY Antibody Market Value Share (%), By Segment 1, 2023 & 2029
Figure 3: Global Chicken Polyclonal IgY Antibody Market Forecast (USD Billion), by Sub-Segment 1, 2018-2029
Figure 4: Global Chicken Polyclonal IgY Antibody Market Forecast (USD Billion), by Sub-Segment 2, 2018-2029
Figure 5: Global Chicken Polyclonal IgY Antibody Market Value Share (%), By Segment 2, 2023 & 2029
Figure 6: Global Chicken Polyclonal IgY Antibody Market Forecast (USD Billion), by Sub-Segment 1, 2018-2029
Figure 7: Global Chicken Polyclonal IgY Antibody Market Forecast (USD Billion), by Sub-Segment 2, 2018-2029
Figure 8: Global Chicken Polyclonal IgY Antibody Market Forecast (USD Billion), by Sub-Segment 3, 2018-2029
Figure 9: Global Chicken Polyclonal IgY Antibody Market Forecast (USD Billion), by Others, 2018-2029
Figure 10: Global Chicken Polyclonal IgY Antibody Market Value Share (%), By Segment 3, 2023 & 2029
Figure 11: Global Chicken Polyclonal IgY Antibody Market Forecast (USD Billion), by Sub-Segment 1, 2018-2029
Figure 12: Global Chicken Polyclonal IgY Antibody Market Forecast (USD Billion), by Sub-Segment 2, 2018-2029
Figure 13: Global Chicken Polyclonal IgY Antibody Market Forecast (USD Billion), by Sub-Segment 3, 2018-2029
Figure 14: Global Chicken Polyclonal IgY Antibody Market Forecast (USD Billion), by Others, 2018-2029
Figure 15: Global Chicken Polyclonal IgY Antibody Market Value (USD Billion), by Region, 2023 & 2029
Figure 16: North America Chicken Polyclonal IgY Antibody Market Value Share (%), By Segment 1, 2023 & 2029
Figure 17: North America Chicken Polyclonal IgY Antibody Market Forecast (USD Billion), by Sub-Segment 1, 2018-2029
Figure 18: North America Chicken Polyclonal IgY Antibody Market Forecast (USD Billion), by Sub-Segment 2, 2018-2029
Figure 19: North America Chicken Polyclonal IgY Antibody Market Value Share (%), By Segment 2, 2023 & 2029
Figure 20: North America Chicken Polyclonal IgY Antibody Market Forecast (USD Billion), by Sub-Segment 1, 2018-2029
Figure 21: North America Chicken Polyclonal IgY Antibody Market Forecast (USD Billion), by Sub-Segment 2, 2018-2029
Figure 22: North America Chicken Polyclonal IgY Antibody Market Forecast (USD Billion), by Sub-Segment 3, 2018-2029
Figure 23: North America Chicken Polyclonal IgY Antibody Market Forecast (USD Billion), by Others, 2018-2029
Figure 24: North America Chicken Polyclonal IgY Antibody Market Value Share (%), By Segment 3, 2023 & 2029
Figure 25: North America Chicken Polyclonal IgY Antibody Market Forecast (USD Billion), by Sub-Segment 1, 2018-2029
Figure 26: North America Chicken Polyclonal IgY Antibody Market Forecast (USD Billion), by Sub-Segment 2, 2018-2029
Figure 27: North America Chicken Polyclonal IgY Antibody Market Forecast (USD Billion), by Sub-Segment 3, 2018-2029
Figure 28: North America Chicken Polyclonal IgY Antibody Market Forecast (USD Billion), by Others, 2018-2029
Figure 29: North America Chicken Polyclonal IgY Antibody Market Forecast (USD Billion), by U.S., 2018-2029
Figure 30: North America Chicken Polyclonal IgY Antibody Market Forecast (USD Billion), by Canada, 2018-2029
Figure 31: Latin America Chicken Polyclonal IgY Antibody Market Value Share (%), By Segment 1, 2023 & 2029
Figure 32: Latin America Chicken Polyclonal IgY Antibody Market Forecast (USD Billion), by Sub-Segment 1, 2018-2029
Figure 33: Latin America Chicken Polyclonal IgY Antibody Market Forecast (USD Billion), by Sub-Segment 2, 2018-2029
Figure 34: Latin America Chicken Polyclonal IgY Antibody Market Value Share (%), By Segment 2, 2023 & 2029
Figure 35: Latin America Chicken Polyclonal IgY Antibody Market Forecast (USD Billion), by Sub-Segment 1, 2018-2029
Figure 36: Latin America Chicken Polyclonal IgY Antibody Market Forecast (USD Billion), by Sub-Segment 2, 2018-2029
Figure 37: Latin America Chicken Polyclonal IgY Antibody Market Forecast (USD Billion), by Sub-Segment 3, 2018-2029
Figure 38: Latin America Chicken Polyclonal IgY Antibody Market Forecast (USD Billion), by Others, 2018-2029
Figure 39: Latin America Chicken Polyclonal IgY Antibody Market Value Share (%), By Segment 3, 2023 & 2029
Figure 40: Latin America Chicken Polyclonal IgY Antibody Market Forecast (USD Billion), by Sub-Segment 1, 2018-2029
Figure 41: Latin America Chicken Polyclonal IgY Antibody Market Forecast (USD Billion), by Sub-Segment 2, 2018-2029
Figure 42: Latin America Chicken Polyclonal IgY Antibody Market Forecast (USD Billion), by Sub-Segment 3, 2018-2029
Figure 43: Latin America Chicken Polyclonal IgY Antibody Market Forecast (USD Billion), by Others, 2018-2029
Figure 44: Latin America Chicken Polyclonal IgY Antibody Market Forecast (USD Billion), by Brazil, 2018-2029
Figure 45: Latin America Chicken Polyclonal IgY Antibody Market Forecast (USD Billion), by Mexico, 2018-2029
Figure 46: Latin America Chicken Polyclonal IgY Antibody Market Forecast (USD Billion), by Rest of Latin America, 2018-2029
Figure 47: Europe Chicken Polyclonal IgY Antibody Market Value Share (%), By Segment 1, 2023 & 2029
Figure 48: Europe Chicken Polyclonal IgY Antibody Market Forecast (USD Billion), by Sub-Segment 1, 2018-2029
Figure 49: Europe Chicken Polyclonal IgY Antibody Market Forecast (USD Billion), by Sub-Segment 2, 2018-2029
Figure 50: Europe Chicken Polyclonal IgY Antibody Market Value Share (%), By Segment 2, 2023 & 2029
Figure 51: Europe Chicken Polyclonal IgY Antibody Market Forecast (USD Billion), by Sub-Segment 1, 2018-2029
Figure 52: Europe Chicken Polyclonal IgY Antibody Market Forecast (USD Billion), by Sub-Segment 2, 2018-2029
Figure 53: Europe Chicken Polyclonal IgY Antibody Market Forecast (USD Billion), by Sub-Segment 3, 2018-2029
Figure 54: Europe Chicken Polyclonal IgY Antibody Market Forecast (USD Billion), by Others, 2018-2029
Figure 55: Europe Chicken Polyclonal IgY Antibody Market Value Share (%), By Segment 3, 2023 & 2029
Figure 56: Europe Chicken Polyclonal IgY Antibody Market Forecast (USD Billion), by Sub-Segment 1, 2018-2029
Figure 57: Europe Chicken Polyclonal IgY Antibody Market Forecast (USD Billion), by Sub-Segment 2, 2018-2029
Figure 58: Europe Chicken Polyclonal IgY Antibody Market Forecast (USD Billion), by Sub-Segment 3, 2018-2029
Figure 59: Europe Chicken Polyclonal IgY Antibody Market Forecast (USD Billion), by Others, 2018-2029
Figure 60: Europe Chicken Polyclonal IgY Antibody Market Forecast (USD Billion), by U.K., 2018-2029
Figure 61: Europe Chicken Polyclonal IgY Antibody Market Forecast (USD Billion), by Germany, 2018-2029
Figure 62: Europe Chicken Polyclonal IgY Antibody Market Forecast (USD Billion), by France, 2018-2029
Figure 63: Europe Chicken Polyclonal IgY Antibody Market Forecast (USD Billion), by Italy, 2018-2029
Figure 64: Europe Chicken Polyclonal IgY Antibody Market Forecast (USD Billion), by Spain, 2018-2029
Figure 65: Europe Chicken Polyclonal IgY Antibody Market Forecast (USD Billion), by Russia, 2018-2029
Figure 66: Europe Chicken Polyclonal IgY Antibody Market Forecast (USD Billion), by Rest of Europe, 2018-2029
Figure 67: Asia Pacific Chicken Polyclonal IgY Antibody Market Value Share (%), By Segment 1, 2023 & 2029
Figure 68: Asia Pacific Chicken Polyclonal IgY Antibody Market Forecast (USD Billion), by Sub-Segment 1, 2018-2029
Figure 69: Asia Pacific Chicken Polyclonal IgY Antibody Market Forecast (USD Billion), by Sub-Segment 2, 2018-2029
Figure 70: Asia Pacific Chicken Polyclonal IgY Antibody Market Value Share (%), By Segment 2, 2023 & 2029
Figure 71: Asia Pacific Chicken Polyclonal IgY Antibody Market Forecast (USD Billion), by Sub-Segment 1, 2018-2029
Figure 72: Asia Pacific Chicken Polyclonal IgY Antibody Market Forecast (USD Billion), by Sub-Segment 2, 2018-2029
Figure 73: Asia Pacific Chicken Polyclonal IgY Antibody Market Forecast (USD Billion), by Sub-Segment 3, 2018-2029
Figure 74: Asia Pacific Chicken Polyclonal IgY Antibody Market Forecast (USD Billion), by Others, 2018-2029
Figure 75: Asia Pacific Chicken Polyclonal IgY Antibody Market Value Share (%), By Segment 3, 2023 & 2029
Figure 76: Asia Pacific Chicken Polyclonal IgY Antibody Market Forecast (USD Billion), by Sub-Segment 1, 2018-2029
Figure 77: Asia Pacific Chicken Polyclonal IgY Antibody Market Forecast (USD Billion), by Sub-Segment 2, 2018-2029
Figure 78: Asia Pacific Chicken Polyclonal IgY Antibody Market Forecast (USD Billion), by Sub-Segment 3, 2018-2029
Figure 79: Asia Pacific Chicken Polyclonal IgY Antibody Market Forecast (USD Billion), by Others, 2018-2029
Figure 80: Asia Pacific Chicken Polyclonal IgY Antibody Market Forecast (USD Billion), by China, 2018-2029
Figure 81: Asia Pacific Chicken Polyclonal IgY Antibody Market Forecast (USD Billion), by India, 2018-2029
Figure 82: Asia Pacific Chicken Polyclonal IgY Antibody Market Forecast (USD Billion), by Japan, 2018-2029
Figure 83: Asia Pacific Chicken Polyclonal IgY Antibody Market Forecast (USD Billion), by Australia, 2018-2029
Figure 84: Asia Pacific Chicken Polyclonal IgY Antibody Market Forecast (USD Billion), by Southeast Asia, 2018-2029
Figure 85: Asia Pacific Chicken Polyclonal IgY Antibody Market Forecast (USD Billion), by Rest of Asia Pacific, 2018-2029
Figure 86: Middle East & Africa Chicken Polyclonal IgY Antibody Market Value Share (%), By Segment 1, 2023 & 2029
Figure 87: Middle East & Africa Chicken Polyclonal IgY Antibody Market Forecast (USD Billion), by Sub-Segment 1, 2018-2029
Figure 88: Middle East & Africa Chicken Polyclonal IgY Antibody Market Forecast (USD Billion), by Sub-Segment 2, 2018-2029
Figure 89: Middle East & Africa Chicken Polyclonal IgY Antibody Market Value Share (%), By Segment 2, 2023 & 2029
Figure 90: Middle East & Africa Chicken Polyclonal IgY Antibody Market Forecast (USD Billion), by Sub-Segment 1, 2018-2029
Figure 91: Middle East & Africa Chicken Polyclonal IgY Antibody Market Forecast (USD Billion), by Sub-Segment 2, 2018-2029
Figure 92: Middle East & Africa Chicken Polyclonal IgY Antibody Market Forecast (USD Billion), by Sub-Segment 3, 2018-2029
Figure 93: Middle East & Africa Chicken Polyclonal IgY Antibody Market Forecast (USD Billion), by Others, 2018-2029
Figure 94: Middle East & Africa Chicken Polyclonal IgY Antibody Market Value Share (%), By Segment 3, 2023 & 2029
Figure 95: Middle East & Africa Chicken Polyclonal IgY Antibody Market Forecast (USD Billion), by Sub-Segment 1, 2018-2029
Figure 96: Middle East & Africa Chicken Polyclonal IgY Antibody Market Forecast (USD Billion), by Sub-Segment 2, 2018-2029
Figure 97: Middle East & Africa Chicken Polyclonal IgY Antibody Market Forecast (USD Billion), by Sub-Segment 3, 2018-2029
Figure 98: Middle East & Africa Chicken Polyclonal IgY Antibody Market Forecast (USD Billion), by Others, 2018-2029
Figure 99: Middle East & Africa Chicken Polyclonal IgY Antibody Market Forecast (USD Billion), by GCC, 2018-2029
Figure 100: Middle East & Africa Chicken Polyclonal IgY Antibody Market Forecast (USD Billion), by South Africa, 2018-2029
Figure 101: Middle East & Africa Chicken Polyclonal IgY Antibody Market Forecast (USD Billion), by Rest of Middle East & Africa, 2018-2029
List of Tables
Table 1: Global Chicken Polyclonal IgY Antibody Market Revenue (USD Billion) Forecast, by Segment 1, 2018-2029
Table 2: Global Chicken Polyclonal IgY Antibody Market Revenue (USD Billion) Forecast, by Segment 2, 2018-2029
Table 3: Global Chicken Polyclonal IgY Antibody Market Revenue (USD Billion) Forecast, by Segment 3, 2018-2029
Table 4: Global Chicken Polyclonal IgY Antibody Market Revenue (USD Billion) Forecast, by Region, 2018-2029
Table 5: North America Chicken Polyclonal IgY Antibody Market Revenue (USD Billion) Forecast, by Segment 1, 2018-2029
Table 6: North America Chicken Polyclonal IgY Antibody Market Revenue (USD Billion) Forecast, by Segment 2, 2018-2029
Table 7: North America Chicken Polyclonal IgY Antibody Market Revenue (USD Billion) Forecast, by Segment 3, 2018-2029
Table 8: North America Chicken Polyclonal IgY Antibody Market Revenue (USD Billion) Forecast, by Country, 2018-2029
Table 9: Europe Chicken Polyclonal IgY Antibody Market Revenue (USD Billion) Forecast, by Segment 1, 2018-2029
Table 10: Europe Chicken Polyclonal IgY Antibody Market Revenue (USD Billion) Forecast, by Segment 2, 2018-2029
Table 11: Europe Chicken Polyclonal IgY Antibody Market Revenue (USD Billion) Forecast, by Segment 3, 2018-2029
Table 12: Europe Chicken Polyclonal IgY Antibody Market Revenue (USD Billion) Forecast, by Country, 2018-2029
Table 13: Latin America Chicken Polyclonal IgY Antibody Market Revenue (USD Billion) Forecast, by Segment 1, 2018-2029
Table 14: Latin America Chicken Polyclonal IgY Antibody Market Revenue (USD Billion) Forecast, by Segment 2, 2018-2029
Table 15: Latin America Chicken Polyclonal IgY Antibody Market Revenue (USD Billion) Forecast, by Segment 3, 2018-2029
Table 16: Latin America Chicken Polyclonal IgY Antibody Market Revenue (USD Billion) Forecast, by Country, 2018-2029
Table 17: Asia Pacific Chicken Polyclonal IgY Antibody Market Revenue (USD Billion) Forecast, by Segment 1, 2018-2029
Table 18: Asia Pacific Chicken Polyclonal IgY Antibody Market Revenue (USD Billion) Forecast, by Segment 2, 2018-2029
Table 19: Asia Pacific Chicken Polyclonal IgY Antibody Market Revenue (USD Billion) Forecast, by Segment 3, 2018-2029
Table 20: Asia Pacific Chicken Polyclonal IgY Antibody Market Revenue (USD Billion) Forecast, by Country, 2018-2029
Table 21: Middle East & Africa Chicken Polyclonal IgY Antibody Market Revenue (USD Billion) Forecast, by Segment 1, 2018-2029
Table 22: Middle East & Africa Chicken Polyclonal IgY Antibody Market Revenue (USD Billion) Forecast, by Segment 2, 2018-2029
Table 23: Middle East & Africa Chicken Polyclonal IgY Antibody Market Revenue (USD Billion) Forecast, by Segment 3, 2018-2029
Table 24: Middle East & Africa Chicken Polyclonal IgY Antibody Market Revenue (USD Billion) Forecast, by Country, 2018-2029
Research Process
Data Library Research are conducted by industry experts who offer insight on
industry structure, market segmentations technology assessment and competitive landscape (CL), and penetration, as well as on emerging trends. Their analysis is based on primary interviews (~ 80%) and secondary research (~ 20%) as well as years of professional expertise in their respective industries. Adding to this, by analysing historical trends and current market positions, our analysts predict where the market will be headed for the next five years. Furthermore, the varying trends of segment & categories geographically presented are also studied and the estimated based on the primary & secondary research.
In this particular report from the supply side Data Library Research has conducted primary surveys (interviews) with the key level executives (VP, CEO’s, Marketing Director, Business Development Manager
and SOFT) of the companies that active & prominent as well as the midsized organization
FIGURE 1: DLR RESEARH PROCESS
![research-methodology1]()
Primary Research
Extensive primary research was conducted to gain a deeper insight of the market and industry performance. The analysis is based on both primary and secondary research as well as years of professional expertise in the respective industries.
In addition to analysing current and historical trends, our analysts predict where the market is headed over the next five years.
It varies by segment for these categories geographically presented in the list of market tables. Speaking about this particular report we have conducted primary surveys (interviews) with the key level executives (VP, CEO’s, Marketing Director, Business Development Manager and many more) of the major players active in the market.
Secondary Research
Secondary research was mainly used to collect and identify information useful for the extensive, technical, market-oriented, and Friend’s study of the Global Extra Neutral Alcohol. It was also used to obtain key information about major players, market classification and segmentation according to the industry trends, geographical markets, and developments related to the market and technology perspectives. For this study, analysts have gathered information from various credible sources, such as annual reports, sec filings, journals, white papers, SOFT presentations, and company web sites.
Market Size Estimation
Both, top-down and bottom-up approaches were used to estimate and validate the size of the Global market and to estimate the size of various other dependent submarkets in the overall Extra Neutral Alcohol. The key players in the market were identified through secondary research and their market contributions in the respective geographies were determined through primary and secondary research.
Forecast Model
![research-methodology2]()