Children's Health Product Market Overview and Analysis

The Global Children's Health Product Market is forecast to grow at a Compound Annual Growth Rate (CAGR) of approximately 6.5% between 2025 and 2032. The market is projected to nearly double, increasing from an estimated USD 15.8 billion in 2025 to reach approximately USD 32.5 billion by 2032.

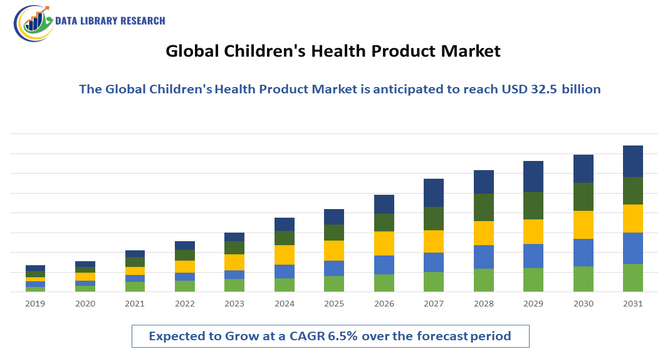
The Global Children’s Health Product Market is experiencing robust growth driven primarily by increasing awareness among parents regarding child nutrition, immunity, and overall well-being. Rising incidences of childhood malnutrition, vitamin deficiencies, and chronic health conditions have intensified demand for fortified foods, dietary supplements, probiotics, and immunity-boosting products. Additionally, growing disposable incomes, urbanization, and the influence of e-commerce platforms are expanding accessibility to health products targeted at children.

Children's Health Product Market Latest Trends

The Global Children’s Health Product Market is witnessing several key trends shaping its growth. There is a significant shift toward natural, organic, and plant-based formulations, as parents increasingly prefer products free from artificial additives, preservatives, and synthetic ingredients. Personalized nutrition is also gaining traction, with tailored supplements and fortified foods designed to meet specific age-related nutritional needs, such as immunity boosters, cognitive enhancers, and bone-strengthening products. Additionally, the rise of digital health platforms and e-commerce has made children’s health products more accessible, while brands are focusing on innovative, child-friendly formats like gummies, flavored powders, and fortified snacks to enhance compliance and appeal.

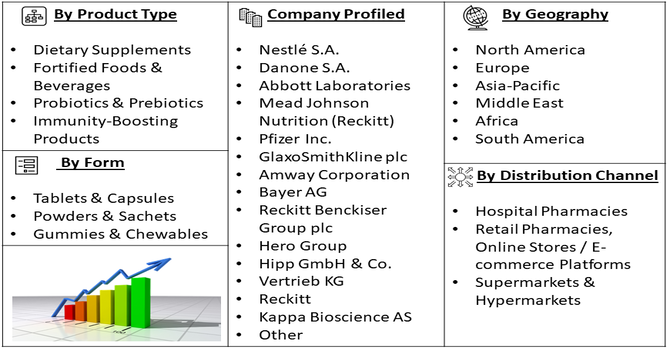
Segmentation: Global Children's Health Product Market is segmented By Product Type (Dietary Supplements, Fortified Foods & Beverages, Probiotics & Prebiotics, Immunity-Boosting Products), By Form (Tablets & Capsules, Powders & Sachets, Gummies & Chewables), By Age Group (Infants, Toddlers, Children, Adolescents), By Distribution Channel (Hospital Pharmacies, Retail Pharmacies, Online Stores / E-commerce Platforms, Supermarkets & Hypermarkets), and Geography (North America, Europe, Asia-Pacific, Middle East and Africa, and South America). The report provides the value (in USD million) for the above segments.

Market Drivers:

  • Increasing Awareness About Child Nutrition and Immunity

Growing awareness among parents and caregivers about the importance of proper nutrition and immune health is a major driver for the children’s health product market. With rising concerns about childhood malnutrition, vitamin deficiencies, obesity, and lifestyle-related health issues, parents are proactively seeking products that support overall growth, immunity, and cognitive development. For instance, in January 2024, article published in Clinical and Experimental Pediatrics, reported that, according to the Comprehensive National Nutrition Survey, vitamin B12 deficiency affected 14% of preschool children (1–4 years), 17% of school-age children (5–9 years), and 31% of adolescents (10–19 years), highlighting the critical need for supplementation in at-risk populations.

The surge in health campaigns by governments, pediatricians, and non-profit organizations emphasizing preventive healthcare further motivates the adoption of dietary supplements, fortified foods, and immunity-boosting products for children. This trend is especially strong in urban and high-income households where parents prioritize wellness from an early age.

  • Growing Disposable Income and Expanding E-Commerce Access

Rising disposable income, especially in emerging markets, has enabled families to spend more on premium children’s health products, including organic, fortified, and specialized nutritional supplements. At the same time, the proliferation of e-commerce platforms and online pharmacies has made these products more accessible, allowing parents to conveniently purchase a wide range of health-focused items tailored for children. The combination of affordability, accessibility, and convenience encourages higher adoption, enabling brands to reach a larger audience and introduce innovative, child-friendly products like flavored gummies, powders, and ready-to-drink supplements.

Market Restraints:

  • Regulatory Challenges and Stringent Safety Standards

The children’s health product market is heavily regulated to ensure safety and efficacy, given the vulnerability of the target age group. Compliance with different regulations across countries—covering ingredient approvals, labeling requirements, permissible claims, and quality standards—can pose significant challenges for manufacturers, especially those operating in multiple regions. Delays in regulatory approvals, variability in international standards, and the risk of product recalls due to safety concerns may hinder product launches, increase operational costs, and restrict market expansion. These regulatory barriers act as a restraint, particularly for new entrants and smaller brands.

Socioeconomic Impact on Children's Health Product Market

The global children’s health product market has significant socioeconomic impact by improving pediatric health outcomes and reducing disease burden among children. Widespread access to vaccines, nutritional supplements, and pediatric medications decreases morbidity and mortality, lowering healthcare costs and hospitalizations. Healthier children contribute to better school attendance, cognitive development, and long-term productivity, positively affecting societal growth. The market also generates employment in research, manufacturing, and distribution of pediatric products, fostering economic development. Additionally, government initiatives and NGO programs promoting child health amplify social equity, ensuring vulnerable populations access essential healthcare products, ultimately strengthening public health infrastructure and societal well-being worldwide.

Segmental Analysis:

  • Dietary Supplements segment is expected to witness highest growth over the forecast period

Dietary supplements dominate the children’s health product market due to their ability to provide essential vitamins, minerals, and nutrients that support growth, immunity, and cognitive development. Parents increasingly rely on supplements to address nutrient deficiencies, picky eating habits, and specific health concerns in children. The availability of child-friendly formulations, including flavored chewables and gummies, enhances adoption and compliance, making dietary supplements a key contributor to market growth.

  • Gummies & Chewables segment is expected to witness highest growth over the forecast period

Gummies and chewables are gaining popularity as they combine convenience with taste, making it easier for children to consume supplements regularly. These formats improve adherence among children who may resist tablets or powders and are available across vitamins, minerals, and probiotics. Their fun shapes, flavors, and easy-to-administer nature are driving market adoption, particularly in urban and high-income households.

  • Toddlers (3–5 years) segment is expected to witness highest growth over the forecast period

The toddler segment is growing rapidly as children in this age group require nutritional support for rapid physical and cognitive development. Parents are increasingly investing in targeted supplements, fortified foods, and immunity-boosting products to ensure toddlers meet developmental milestones and maintain overall health. This age group also responds well to innovative, child-friendly product formats, further fueling demand.

  • Online Stores / E-commerce Platforms segment is expected to witness highest growth over the forecast period

Online channels are witnessing significant growth due to convenience, wide product variety, and doorstep delivery. E-commerce platforms allow parents to compare products, read reviews, and purchase specialized children’s health products, including international and premium brands, which may not be easily available in retail outlets. The COVID-19 pandemic further accelerated the adoption of online shopping for health products globally.

  • North America segment is expected to witness highest growth over the forecast period

North America is a leading market due to high consumer awareness, increasing healthcare expenditure, and preference for premium, organic, and fortified children’s health products.

The region also benefits from strong e-commerce infrastructure, proactive parental focus on preventive healthcare, and government initiatives promoting child nutrition, driving consistent growth in the market. For instance, December 2025, NUK, trusted for over 70 years, expanded its Perfect Match line in North America with three new products: the Air Pacifier, Learner Cup, and Straw Cup. Building on prior success, these innovations supported babies’ natural development, reinforcing NUK’s market leadership and driving growth in the region’s children’s health product market.

Similarly, in November 2025, the WHO released six target product profiles for child-friendly cancer medicines, guiding manufacturers in developing optimized pediatric formulations. By addressing dosing challenges and treatment risks, this initiative supported improved access and therapeutic outcomes, strengthening North America’s children’s health product market and encouraging innovation in pediatric oncology treatments.

Thus, North America’s strong market position is reinforced by rising consumer awareness, growing healthcare spending, and a shift toward premium, organic, and fortified children’s health products. These factors, combined with ongoing innovation and expanding e-commerce channels, are expected to sustain robust growth and shape the future of the region’s children’s health product market.

Children's Health Product Market Competitive Landscape

The competitive landscape of the global children’s health product market is shaped by a combination of large multinational nutrition and pharmaceutical firms, specialized pediatric supplement brands, and emerging startups focusing on organic, clean-label, and child friendly formulations. The competition centers on product formulation (immunity boosters, vitamins, probiotics), taste and format (gummies, chewables, syrups), regulatory compliance for safety in children, and effective branding and distribution across retail and online channels. Companies differentiate through innovations in ingredients, fortification levels, natural/organic positioning, and pan regional distribution networks to capture market share among parents seeking the best for child health and development.

Key Players:

  • Nestlé S.A.
  • Danone S.A.
  • Abbott Laboratories
  • Mead Johnson Nutrition (Reckitt)
  • Pfizer Inc.
  • GlaxoSmithKline plc
  • Amway Corporation
  • Bayer AG
  • Reckitt Benckiser Group plc
  • Hero Group
  • Hipp GmbH & Co.
  • Vertrieb KG
  • Reckitt
  • Kappa Bioscience AS
  • DSM Nutritional Products AG
  • Nature’s Way (NaturaLife LLC)
  • Garden of Life, LLC
  • Zoetis Inc. (Pediatric nutrition division)
  • Blackmores Limited
  • Herbalife Nutrition Ltd.
  • CHR. Hansen Holding A/S


Recent News

  • In September 2025, KinderFarms launched KinderMed Pain & Fever, an OTC medicine for infants and children offering relief with the same active ingredient as leading brands but without dyes or artificial additives. This addressed rising demand for cleaner, safer pediatric products, strengthening offerings and driving growth in the global children’s health product market.


  • In November 2023, Abbott launched the new PediaSure with Nutri-Pull System in India to support catch-up growth and overall child health. Its 37-nutrient formulation, including casein phosphopeptides (CPPs), enhanced nutrient absorption and mineral utilization, addressing malnutrition and stunting, thereby strengthening the global children’s health product market.


Frequently Asked Questions (FAQ) :

Q1. What are the main growth-driving factors for this market?

Growth is driven by increasing parental awareness about child nutrition, safety, and preventative care. Rising disposable incomes, especially in developing countries, allow families to spend more on high-quality and premium wellness products specifically designed for children.

Q2. What are the main restraining factors for this market?

The high cost of specialized pediatric products and treatments can restrict market growth, particularly in lower-income regions. Furthermore, stringent safety regulations and the widespread availability of cheaper, counterfeit, or low-quality products pose significant challenges to legitimate manufacturers.

Q3. Which segment is expected to witness high growth?

The online stores and e-commerce platforms segment is expected to witness the highest growth, driven by increasing consumer preference for convenient, home-delivered children’s health products, rising digital adoption, and the expansion of online pediatric product offerings worldwide.

Q4. Who are the top major players for this market?

Top market players include leading pharmaceutical and consumer goods corporations. Key companies are Nestlé S.A., Danone S.A., Abbott Laboratories, Reckitt Benckiser Group plc, and GlaxoSmithKline (GSK). These companies focus on pediatric nutrition and specialty care.

Q5. Which country is the largest player?

The United States holds the largest market share in the children's health sector, driving the North American region's dominance. This is attributed to its well-established, advanced healthcare system, high levels of per capita health expenditure, and rapid adoption of new medical technologies.

Children's Health Product MARKET STUDY GLOBAL MARKET ANALYSIS, INSIGHTS AND FORECAST, 2022-2029

    1. Introduction

    • 1.1. Research Scope
    • 1.2. Market Segmentation
    • 1.3. Research Methodology
    • 1.4. Definitions and Assumptions

    2. Executive Summary

      3. Market Dynamics

      • 3.1. Market Drivers
      • 3.2. Market Restraints
      • 3.3. Market Opportunities

      4. Key Insights

      • 4.1. Key Emerging Trends – For Major Countries
      • 4.2. Latest Technological Advancement
      • 4.3. Regulatory Landscape
      • 4.4. Industry SWOT Analysis
      • 4.5. Porters Five Forces Analysis

      5. Global Children's Health Product Market Analysis (USD Billion), Insights and Forecast, 2018-2029

      • 5.1. Key Findings / Summary
      • 5.2. Market Analysis, Insights and Forecast – By Segment 1
        • 5.2.1. Sub-Segment 1
        • 5.2.2. Sub-Segment 2
      • 5.3. Market Analysis, Insights and Forecast – By Segment 2
        • 5.3.1. Sub-Segment 1
        • 5.3.2. Sub-Segment 2
        • 5.3.3. Sub-Segment 3
        • 5.3.4. Others
      • 5.4. Market Analysis, Insights and Forecast – By Segment 3
        • 5.4.1. Sub-Segment 1
        • 5.4.2. Sub-Segment 2
        • 5.4.3. Sub-Segment 3
        • 5.4.4. Others
      • 5.5. Market Analysis, Insights and Forecast – By Region
        • 5.5.1. North America
        • 5.5.2. Latin America
        • 5.5.3. Europe
        • 5.5.4. Asia Pacific
        • 5.5.5. Middle East and Africa

      6. North America Children's Health Product Market Analysis (USD Billion), Insights and Forecast, 2018-2029

      • 6.1. Key Findings / Summary
      • 6.2. Market Analysis, Insights and Forecast – By Segment 1
        • 6.2.1. Sub-Segment 1
        • 6.2.2. Sub-Segment 2
      • 6.3. Market Analysis, Insights and Forecast – By Segment 2
        • 6.3.1. Sub-Segment 1
        • 6.3.2. Sub-Segment 2
        • 6.3.3. Sub-Segment 3
        • 6.3.4. Others
      • 6.4. Market Analysis, Insights and Forecast – By Segment 3
        • 6.4.1. Sub-Segment 1
        • 6.4.2. Sub-Segment 2
        • 6.4.3. Sub-Segment 3
        • 6.4.4. Others
      • 6.5. Market Analysis, Insights and Forecast – By Country
        • 6.5.1. U.S.
        • 6.5.2. Canada

      7. Latin America Children's Health Product Market Analysis (USD Billion), Insights and Forecast, 2018-2029

      • 7.1. Key Findings / Summary
      • 7.2. Market Analysis, Insights and Forecast – By Segment 1
        • 7.2.1. Sub-Segment 1
        • 7.2.2. Sub-Segment 2
      • 7.3. Market Analysis, Insights and Forecast – By Segment 2
        • 7.3.1. Sub-Segment 1
        • 7.3.2. Sub-Segment 2
        • 7.3.3. Sub-Segment 3
        • 7.3.4. Others
      • 7.4. Market Analysis, Insights and Forecast – By Segment 3
        • 7.4.1. Sub-Segment 1
        • 7.4.2. Sub-Segment 2
        • 7.4.3. Sub-Segment 3
        • 7.4.4. Others
      • 7.5. Insights and Forecast – By Country
        • 7.5.1. Brazil
        • 7.5.2. Mexico
        • 7.5.3. Rest of Latin America

      8. Europe Children's Health Product Market Analysis (USD Billion), Insights and Forecast, 2018-2029

      • 8.1. Key Findings / Summary
      • 8.2. Market Analysis, Insights and Forecast – By Segment 1
        • 8.2.1. Sub-Segment 1
        • 8.2.2. Sub-Segment 2
      • 8.3. Market Analysis, Insights and Forecast – By Segment 2
        • 8.3.1. Sub-Segment 1
        • 8.3.2. Sub-Segment 2
        • 8.3.3. Sub-Segment 3
        • 8.3.4. Others
      • 8.4. Market Analysis, Insights and Forecast – By Segment 3
        • 8.4.1. Sub-Segment 1
        • 8.4.2. Sub-Segment 2
        • 8.4.3. Sub-Segment 3
        • 8.4.4. Others
      • 8.5. Market Analysis, Insights and Forecast – By Country
        • 8.5.1. UK
        • 8.5.2. Germany
        • 8.5.3. France
        • 8.5.4. Italy
        • 8.5.5. Spain
        • 8.5.6. Russia
        • 8.5.7. Rest of Europe

      9. Asia Pacific Children's Health Product Market Analysis (USD Billion), Insights and Forecast, 2018-2029

      • 9.1. Key Findings / Summary
      • 9.2. Market Analysis, Insights and Forecast – By Segment 1
        • 9.2.1. Sub-Segment 1
        • 9.2.2. Sub-Segment 2
      • 9.3. Market Analysis, Insights and Forecast – By Segment 2
        • 9.3.1. Sub-Segment 1
        • 9.3.2. Sub-Segment 2
        • 9.3.3. Sub-Segment 3
        • 9.3.4. Others
      • 9.4. Market Analysis, Insights and Forecast – By Segment 3
        • 9.4.1. Sub-Segment 1
        • 9.4.2. Sub-Segment 2
        • 9.4.3. Sub-Segment 3
        • 9.4.4. Others
      • 9.5. Market Analysis, Insights and Forecast – By Country
        • 9.5.1. China
        • 9.5.2. India
        • 9.5.3. Japan
        • 9.5.4. Australia
        • 9.5.5. South East Asia
        • 9.5.6. Rest of Asia Pacific

      10. Middle East & Africa Children's Health Product Market Analysis (USD Billion), Insights and Forecast, 2018-2029

      • 10.1. Key Findings / Summary
      • 10.2. Market Analysis, Insights and Forecast – By Segment 1
        • 10.2.1. Sub-Segment 1
        • 10.2.2. Sub-Segment 2
      • 10.3. Market Analysis, Insights and Forecast – By Segment 2
        • 10.3.1. Sub-Segment 1
        • 10.3.2. Sub-Segment 2
        • 10.3.3. Sub-Segment 3
        • 10.3.4. Others
      • 10.4. Market Analysis, Insights and Forecast – By Segment 3
        • 10.4.1. Sub-Segment 1
        • 10.4.2. Sub-Segment 2
        • 10.4.3. Sub-Segment 3
        • 10.4.4. Others
      • 10.5. Market Analysis, Insights and Forecast – By Country
        • 10.5.1. GCC
        • 10.5.2. South Africa
        • 10.5.3. Rest of Middle East & Africa

      11. Competitive Analysis

      • 11.1. Company Market Share Analysis, 2018
      • 11.2. Key Industry Developments
      • 11.3. Company Profile
        • 11.3.1. Company 1
          • 11.3.1.1. Business Overview
          • 11.3.1.2. Segment 1 & Service Offering
          • 11.3.1.3. Overall Revenue
          • 11.3.1.4. Geographic Presence
          • 11.3.1.5. Recent Development
        *Similar details will be provided for the following companies
        • 11.3.2. Company 2
        • 11.3.3. Company 3
        • 11.3.4. Company 4
        • 11.3.5. Company 5
        • 11.3.6. Company 6
        • 11.3.7. Company 7
        • 11.3.8. Company 8
        • 11.3.9. Company 9
        • 11.3.10. Company 10
        • 11.3.11. Company 11
        • 11.3.12. Company 12
      List of Figures

      Figure 1: Global Children's Health Product Market Revenue Breakdown (USD Billion, %) by Region, 2022 & 2029
      Figure 2: Global Children's Health Product Market Value Share (%), By Segment 1, 2022 & 2029
      Figure 3: Global Children's Health Product Market Forecast (USD Billion), by Sub-Segment 1, 2018-2029
      Figure 4: Global Children's Health Product Market Forecast (USD Billion), by Sub-Segment 2, 2018-2029
      Figure 5: Global Children's Health Product Market Value Share (%), By Segment 2, 2022 & 2029
      Figure 6: Global Children's Health Product Market Forecast (USD Billion), by Sub-Segment 1, 2018-2029
      Figure 7: Global Children's Health Product Market Forecast (USD Billion), by Sub-Segment 2, 2018-2029
      Figure 8: Global Children's Health Product Market Forecast (USD Billion), by Sub-Segment 3, 2018-2029
      Figure 9: Global Children's Health Product Market Forecast (USD Billion), by Others, 2018-2029
      Figure 10: Global Children's Health Product Market Value Share (%), By Segment 3, 2022 & 2029
      Figure 11: Global Children's Health Product Market Forecast (USD Billion), by Sub-Segment 1, 2018-2029
      Figure 12: Global Children's Health Product Market Forecast (USD Billion), by Sub-Segment 2, 2018-2029
      Figure 13: Global Children's Health Product Market Forecast (USD Billion), by Sub-Segment 3, 2018-2029
      Figure 14: Global Children's Health Product Market Forecast (USD Billion), by Others, 2018-2029
      Figure 15: Global Children's Health Product Market Value (USD Billion), by Region, 2022 & 2029
      Figure 16: North America Children's Health Product Market Value Share (%), By Segment 1, 2022 & 2029
      Figure 17: North America Children's Health Product Market Forecast (USD Billion), by Sub-Segment 1, 2018-2029
      Figure 18: North America Children's Health Product Market Forecast (USD Billion), by Sub-Segment 2, 2018-2029
      Figure 19: North America Children's Health Product Market Value Share (%), By Segment 2, 2022 & 2029
      Figure 20: North America Children's Health Product Market Forecast (USD Billion), by Sub-Segment 1, 2018-2029
      Figure 21: North America Children's Health Product Market Forecast (USD Billion), by Sub-Segment 2, 2018-2029
      Figure 22: North America Children's Health Product Market Forecast (USD Billion), by Sub-Segment 3, 2018-2029
      Figure 23: North America Children's Health Product Market Forecast (USD Billion), by Others, 2018-2029
      Figure 24: North America Children's Health Product Market Value Share (%), By Segment 3, 2022 & 2029
      Figure 25: North America Children's Health Product Market Forecast (USD Billion), by Sub-Segment 1, 2018-2029
      Figure 26: North America Children's Health Product Market Forecast (USD Billion), by Sub-Segment 2, 2018-2029
      Figure 27: North America Children's Health Product Market Forecast (USD Billion), by Sub-Segment 3, 2018-2029
      Figure 28: North America Children's Health Product Market Forecast (USD Billion), by Others, 2018-2029
      Figure 29: North America Children's Health Product Market Forecast (USD Billion), by U.S., 2018-2029
      Figure 30: North America Children's Health Product Market Forecast (USD Billion), by Canada, 2018-2029
      Figure 31: Latin America Children's Health Product Market Value Share (%), By Segment 1, 2022 & 2029
      Figure 32: Latin America Children's Health Product Market Forecast (USD Billion), by Sub-Segment 1, 2018-2029
      Figure 33: Latin America Children's Health Product Market Forecast (USD Billion), by Sub-Segment 2, 2018-2029
      Figure 34: Latin America Children's Health Product Market Value Share (%), By Segment 2, 2022 & 2029
      Figure 35: Latin America Children's Health Product Market Forecast (USD Billion), by Sub-Segment 1, 2018-2029
      Figure 36: Latin America Children's Health Product Market Forecast (USD Billion), by Sub-Segment 2, 2018-2029
      Figure 37: Latin America Children's Health Product Market Forecast (USD Billion), by Sub-Segment 3, 2018-2029
      Figure 38: Latin America Children's Health Product Market Forecast (USD Billion), by Others, 2018-2029
      Figure 39: Latin America Children's Health Product Market Value Share (%), By Segment 3, 2022 & 2029
      Figure 40: Latin America Children's Health Product Market Forecast (USD Billion), by Sub-Segment 1, 2018-2029
      Figure 41: Latin America Children's Health Product Market Forecast (USD Billion), by Sub-Segment 2, 2018-2029
      Figure 42: Latin America Children's Health Product Market Forecast (USD Billion), by Sub-Segment 3, 2018-2029
      Figure 43: Latin America Children's Health Product Market Forecast (USD Billion), by Others, 2018-2029
      Figure 44: Latin America Children's Health Product Market Forecast (USD Billion), by Brazil, 2018-2029
      Figure 45: Latin America Children's Health Product Market Forecast (USD Billion), by Mexico, 2018-2029
      Figure 46: Latin America Children's Health Product Market Forecast (USD Billion), by Rest of Latin America, 2018-2029
      Figure 47: Europe Children's Health Product Market Value Share (%), By Segment 1, 2022 & 2029
      Figure 48: Europe Children's Health Product Market Forecast (USD Billion), by Sub-Segment 1, 2018-2029
      Figure 49: Europe Children's Health Product Market Forecast (USD Billion), by Sub-Segment 2, 2018-2029
      Figure 50: Europe Children's Health Product Market Value Share (%), By Segment 2, 2022 & 2029
      Figure 51: Europe Children's Health Product Market Forecast (USD Billion), by Sub-Segment 1, 2018-2029
      Figure 52: Europe Children's Health Product Market Forecast (USD Billion), by Sub-Segment 2, 2018-2029
      Figure 53: Europe Children's Health Product Market Forecast (USD Billion), by Sub-Segment 3, 2018-2029
      Figure 54: Europe Children's Health Product Market Forecast (USD Billion), by Others, 2018-2029
      Figure 55: Europe Children's Health Product Market Value Share (%), By Segment 3, 2022 & 2029
      Figure 56: Europe Children's Health Product Market Forecast (USD Billion), by Sub-Segment 1, 2018-2029
      Figure 57: Europe Children's Health Product Market Forecast (USD Billion), by Sub-Segment 2, 2018-2029
      Figure 58: Europe Children's Health Product Market Forecast (USD Billion), by Sub-Segment 3, 2018-2029
      Figure 59: Europe Children's Health Product Market Forecast (USD Billion), by Others, 2018-2029
      Figure 60: Europe Children's Health Product Market Forecast (USD Billion), by U.K., 2018-2029
      Figure 61: Europe Children's Health Product Market Forecast (USD Billion), by Germany, 2018-2029
      Figure 62: Europe Children's Health Product Market Forecast (USD Billion), by France, 2018-2029
      Figure 63: Europe Children's Health Product Market Forecast (USD Billion), by Italy, 2018-2029
      Figure 64: Europe Children's Health Product Market Forecast (USD Billion), by Spain, 2018-2029
      Figure 65: Europe Children's Health Product Market Forecast (USD Billion), by Russia, 2018-2029
      Figure 66: Europe Children's Health Product Market Forecast (USD Billion), by Rest of Europe, 2018-2029
      Figure 67: Asia Pacific Children's Health Product Market Value Share (%), By Segment 1, 2022 & 2029
      Figure 68: Asia Pacific Children's Health Product Market Forecast (USD Billion), by Sub-Segment 1, 2018-2029
      Figure 69: Asia Pacific Children's Health Product Market Forecast (USD Billion), by Sub-Segment 2, 2018-2029
      Figure 70: Asia Pacific Children's Health Product Market Value Share (%), By Segment 2, 2022 & 2029
      Figure 71: Asia Pacific Children's Health Product Market Forecast (USD Billion), by Sub-Segment 1, 2018-2029
      Figure 72: Asia Pacific Children's Health Product Market Forecast (USD Billion), by Sub-Segment 2, 2018-2029
      Figure 73: Asia Pacific Children's Health Product Market Forecast (USD Billion), by Sub-Segment 3, 2018-2029
      Figure 74: Asia Pacific Children's Health Product Market Forecast (USD Billion), by Others, 2018-2029
      Figure 75: Asia Pacific Children's Health Product Market Value Share (%), By Segment 3, 2022 & 2029
      Figure 76: Asia Pacific Children's Health Product Market Forecast (USD Billion), by Sub-Segment 1, 2018-2029
      Figure 77: Asia Pacific Children's Health Product Market Forecast (USD Billion), by Sub-Segment 2, 2018-2029
      Figure 78: Asia Pacific Children's Health Product Market Forecast (USD Billion), by Sub-Segment 3, 2018-2029
      Figure 79: Asia Pacific Children's Health Product Market Forecast (USD Billion), by Others, 2018-2029
      Figure 80: Asia Pacific Children's Health Product Market Forecast (USD Billion), by China, 2018-2029
      Figure 81: Asia Pacific Children's Health Product Market Forecast (USD Billion), by India, 2018-2029
      Figure 82: Asia Pacific Children's Health Product Market Forecast (USD Billion), by Japan, 2018-2029
      Figure 83: Asia Pacific Children's Health Product Market Forecast (USD Billion), by Australia, 2018-2029
      Figure 84: Asia Pacific Children's Health Product Market Forecast (USD Billion), by Southeast Asia, 2018-2029
      Figure 85: Asia Pacific Children's Health Product Market Forecast (USD Billion), by Rest of Asia Pacific, 2018-2029
      Figure 86: Middle East & Africa Children's Health Product Market Value Share (%), By Segment 1, 2022 & 2029
      Figure 87: Middle East & Africa Children's Health Product Market Forecast (USD Billion), by Sub-Segment 1, 2018-2029
      Figure 88: Middle East & Africa Children's Health Product Market Forecast (USD Billion), by Sub-Segment 2, 2018-2029
      Figure 89: Middle East & Africa Children's Health Product Market Value Share (%), By Segment 2, 2022 & 2029
      Figure 90: Middle East & Africa Children's Health Product Market Forecast (USD Billion), by Sub-Segment 1, 2018-2029
      Figure 91: Middle East & Africa Children's Health Product Market Forecast (USD Billion), by Sub-Segment 2, 2018-2029
      Figure 92: Middle East & Africa Children's Health Product Market Forecast (USD Billion), by Sub-Segment 3, 2018-2029
      Figure 93: Middle East & Africa Children's Health Product Market Forecast (USD Billion), by Others, 2018-2029
      Figure 94: Middle East & Africa Children's Health Product Market Value Share (%), By Segment 3, 2022 & 2029
      Figure 95: Middle East & Africa Children's Health Product Market Forecast (USD Billion), by Sub-Segment 1, 2018-2029
      Figure 96: Middle East & Africa Children's Health Product Market Forecast (USD Billion), by Sub-Segment 2, 2018-2029
      Figure 97: Middle East & Africa Children's Health Product Market Forecast (USD Billion), by Sub-Segment 3, 2018-2029
      Figure 98: Middle East & Africa Children's Health Product Market Forecast (USD Billion), by Others, 2018-2029
      Figure 99: Middle East & Africa Children's Health Product Market Forecast (USD Billion), by GCC, 2018-2029
      Figure 100: Middle East & Africa Children's Health Product Market Forecast (USD Billion), by South Africa, 2018-2029
      Figure 101: Middle East & Africa Children's Health Product Market Forecast (USD Billion), by Rest of Middle East & Africa, 2018-2029 
      List of Tables
      Table 1: Global Children's Health Product Market Revenue (USD Billion) Forecast, by Segment 1, 2018-2029
      Table 2: Global Children's Health Product Market Revenue (USD Billion) Forecast, by Segment 2, 2018-2029
      Table 3: Global Children's Health Product Market Revenue (USD Billion) Forecast, by Segment 3, 2018-2029
      Table 4: Global Children's Health Product Market Revenue (USD Billion) Forecast, by Region, 2018-2029
      Table 5: North America Children's Health Product Market Revenue (USD Billion) Forecast, by Segment 1, 2018-2029
      Table 6: North America Children's Health Product Market Revenue (USD Billion) Forecast, by Segment 2, 2018-2029
      Table 7: North America Children's Health Product Market Revenue (USD Billion) Forecast, by Segment 3, 2018-2029
      Table 8: North America Children's Health Product Market Revenue (USD Billion) Forecast, by Country, 2018-2029
      Table 9: Europe Children's Health Product Market Revenue (USD Billion) Forecast, by Segment 1, 2018-2029
      Table 10: Europe Children's Health Product Market Revenue (USD Billion) Forecast, by Segment 2, 2018-2029
      Table 11: Europe Children's Health Product Market Revenue (USD Billion) Forecast, by Segment 3, 2018-2029
      Table 12: Europe Children's Health Product Market Revenue (USD Billion) Forecast, by Country, 2018-2029
      Table 13: Latin America Children's Health Product Market Revenue (USD Billion) Forecast, by Segment 1, 2018-2029
      Table 14: Latin America Children's Health Product Market Revenue (USD Billion) Forecast, by Segment 2, 2018-2029
      Table 15: Latin America Children's Health Product Market Revenue (USD Billion) Forecast, by Segment 3, 2018-2029
      Table 16: Latin America Children's Health Product Market Revenue (USD Billion) Forecast, by Country, 2018-2029
      Table 17: Asia Pacific Children's Health Product Market Revenue (USD Billion) Forecast, by Segment 1, 2018-2029
      Table 18: Asia Pacific Children's Health Product Market Revenue (USD Billion) Forecast, by Segment 2, 2018-2029
      Table 19: Asia Pacific Children's Health Product Market Revenue (USD Billion) Forecast, by Segment 3, 2018-2029
      Table 20: Asia Pacific Children's Health Product Market Revenue (USD Billion) Forecast, by Country, 2018-2029
      Table 21: Middle East & Africa Children's Health Product Market Revenue (USD Billion) Forecast, by Segment 1, 2018-2029
      Table 22: Middle East & Africa Children's Health Product Market Revenue (USD Billion) Forecast, by Segment 2, 2018-2029
      Table 23: Middle East & Africa Children's Health Product Market Revenue (USD Billion) Forecast, by Segment 3, 2018-2029
      Table 24: Middle East & Africa Children's Health Product Market Revenue (USD Billion) Forecast, by Country, 2018-2029
      Research Process

      Data Library Research are conducted by industry experts who offer insight on industry structure, market segmentations technology assessment and competitive landscape (CL), and penetration, as well as on emerging trends. Their analysis is based on primary interviews (~ 80%) and secondary research (~ 20%) as well as years of professional expertise in their respective industries. Adding to this, by analysing historical trends and current market positions, our analysts predict where the market will be headed for the next five years. Furthermore, the varying trends of segment & categories geographically presented are also studied and the estimated based on the primary & secondary research.

      In this particular report from the supply side Data Library Research has conducted primary surveys (interviews) with the key level executives (VP, CEO’s, Marketing Director, Business Development Manager and SOFT) of the companies that active & prominent as well as the midsized organization

      FIGURE 1: DLR RESEARH PROCESS

      research-methodology1

      Primary Research

      Extensive primary research was conducted to gain a deeper insight of the market and industry performance. The analysis is based on both primary and secondary research as well as years of professional expertise in the respective industries.

      In addition to analysing current and historical trends, our analysts predict where the market is headed over the next five years.

      It varies by segment for these categories geographically presented in the list of market tables. Speaking about this particular report we have conducted primary surveys (interviews) with the key level executives (VP, CEO’s, Marketing Director, Business Development Manager and many more) of the major players active in the market.

      Secondary Research

      Secondary research was mainly used to collect and identify information useful for the extensive, technical, market-oriented, and Friend’s study of the Global Extra Neutral Alcohol. It was also used to obtain key information about major players, market classification and segmentation according to the industry trends, geographical markets, and developments related to the market and technology perspectives. For this study, analysts have gathered information from various credible sources, such as annual reports, sec filings, journals, white papers, SOFT presentations, and company web sites.

      Market Size Estimation

      Both, top-down and bottom-up approaches were used to estimate and validate the size of the Global market and to estimate the size of various other dependent submarkets in the overall Extra Neutral Alcohol. The key players in the market were identified through secondary research and their market contributions in the respective geographies were determined through primary and secondary research.

      Forecast Model

      research-methodology2