Data Matrix Barcode Reading System Market Overview and Analysis

  • The Global Data Matrix Barcode Reading System Market is valued around USD 8.5 billion in 2026 to potentially over USD 10.58 billion by 2033, at CAGRs often exceeding 11.9% from 2026-2033.

Data Matrix Barcode Reading System Market

Get Complete Analysis Of The Report - Download Updated Free Sample PDF


The Global Data Matrix Barcode Reading System Market focuses on the development, production, and deployment of advanced scanning and recognition systems capable of reading 2D Data Matrix barcodes. These systems are widely used across industries such as pharmaceuticals, automotive, logistics, retail, and manufacturing for inventory management, traceability, and quality control. Market growth is driven by increasing adoption of automation, regulatory requirements for product serialization, and the need for faster, error-free barcode reading. Technological advancements, including high-speed imaging, AI-based decoding, and integration with IoT and warehouse management systems, further enhance efficiency.

Data Matrix Barcode Reading System Market Latest Trends

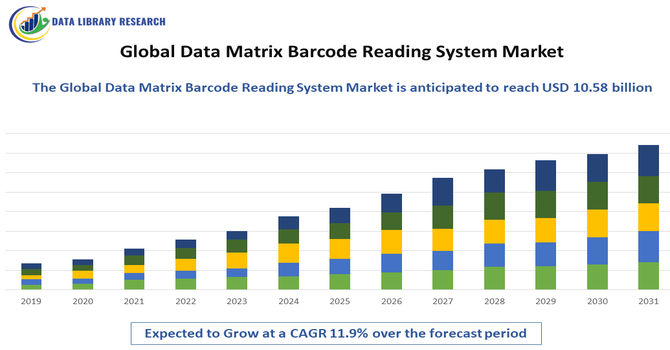
The Global Data Matrix Barcode Reading System Market is witnessing significant growth due to increasing automation across industries such as pharmaceuticals, logistics, retail, and automotive. The demand for real-time tracking, serialization, and inventory management is driving adoption of high-speed, high-accuracy 2D barcode readers. Technological advancements, including AI-powered decoding, machine vision, and integration with IoT and warehouse management systems, are enhancing performance and operational efficiency. The rise of e-commerce and global supply chains further fuels market expansion.

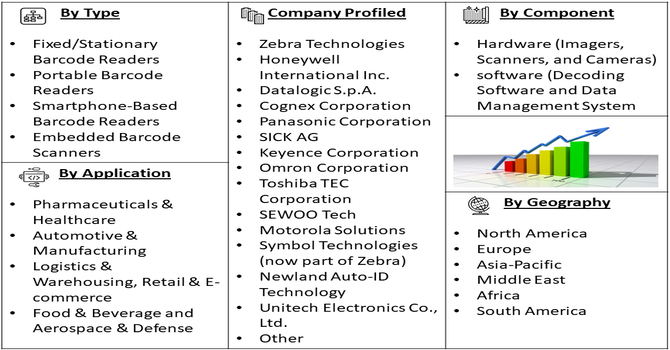
Segmentation: The Global Data Matrix Barcode Reading System Market is segmented by Product Type (Fixed/Stationary Barcode Readers, Portable Barcode Readers, Smartphone-Based Barcode Readers, and Embedded Barcode Scanners), Component (Hardware (Imagers, Scanners, and Cameras), Software (Decoding Software and Data Management Systems) and Services (Installation, Maintenance, and Integration), Application (Pharmaceuticals & Healthcare, Automotive & Manufacturing, Logistics & Warehousing, Retail & E-commerce, Food & Beverage and Aerospace & Defense), and Geography (North America, Europe, Asia-Pacific, Middle East and Africa, and South America). The report provides the value (in USD million) for the above segments.

Data Matrix Barcode Reading System Market segment

For Detailed Market Segmentation - Get a Free Sample PDF

Market Drivers:

  • Rising Automation and Industrial Digitization

The primary drivers of the Global Data Matrix Barcode Reading System Market is the accelerating adoption of automation and digital transformation across industries. Manufacturing, logistics, and retail sectors increasingly rely on real-time tracking, inventory management, and quality control, which Data Matrix barcode readers enable efficiently. For instance, in 2026, poLight ASA received a follow-on order for TLens® from a Chinese barcode scanner manufacturer, supporting existing products and new design-wins. This adoption enhanced DataMatrix barcode reader performance, improving speed and accuracy, and reinforced the impact of rising automation and industrial digitization by enabling more efficient, high-precision scanning in manufacturing and logistics.

Integration with warehouse management systems, IoT platforms, and industrial automation software allows businesses to monitor assets, streamline workflows, and reduce errors. The growth of e-commerce and global supply chains further intensifies the demand for accurate and high-speed barcode reading systems, making automation a critical driver for widespread market adoption.

  • Regulatory Compliance and Product Traceability

Regulatory requirements and the need for traceability significantly drive the Data Matrix barcode reading system market. Industries such as pharmaceuticals, healthcare, aerospace, and food processing must comply with strict serialization, labeling, and tracking regulations to ensure safety, quality, and accountability.

Data Matrix barcodes enable precise tracking of products through the supply chain, preventing counterfeiting and ensuring regulatory adherence. For instance, in 2025, CM MK Stalin launched a QR code-based safety system in Chennai’s auto-rickshaws and rental vehicles, covering over 88,000 units. This initiative strengthened regulatory compliance and product traceability, demonstrating the importance of barcode and QR code systems, thereby increasing awareness and adoption of DataMatrix barcode reading technologies in safety and transport applications globally. As a result, demand for reliable, high-accuracy Data Matrix readers continues to expand across multiple sectors, reinforcing their essential role in regulatory compliance.

Market Restraints:

  • High Implementation and Maintenance Costs

A key restraint for the Global Data Matrix Barcode Reading System Market is the high implementation and maintenance costs associated with advanced scanning systems. Industrial-grade readers, imaging equipment, and integration with enterprise software require significant capital investment, which can be prohibitive for small and medium-sized enterprises. Additionally, ongoing costs for system calibration, software updates, and technical support increase total ownership expenses. In regions with limited IT infrastructure or budget constraints, this can slow adoption. Furthermore, complex integration with existing workflows and supply chain systems may require specialized expertise, making deployment challenging and deterring smaller businesses from investing in sophisticated Data Matrix barcode reading solutions.

Socioeconomic Impact on Data Matrix Barcode Reading System Market

Data Matrix barcode reading systems significantly improve operational efficiency, accuracy, and traceability in multiple sectors, leading to reduced labor costs and fewer errors. In pharmaceuticals, they enhance patient safety through product serialization and counterfeit prevention. In logistics and retail, they streamline inventory management, reduce losses, and improve supply chain transparency. By enabling faster processing and decision-making, these systems contribute to economic productivity. Moreover, they foster job opportunities in technology development, installation, and maintenance while supporting digital transformation initiatives. The adoption of barcode reading systems promotes safer, more efficient, and reliable industrial operations, ultimately benefiting both businesses and consumers.

Segmental Analysis:

  • Portable Barcode Readers segment is expected to witness highest growth over the forecast period

The portable barcode readers segment is expected to witness the highest growth over the forecast period due to their flexibility, mobility, and ease of use across multiple industries. Handheld and mobile devices allow real-time scanning in warehouses, retail outlets, and manufacturing floors, improving inventory accuracy and operational efficiency. Technological advancements, such as wireless connectivity, long-range scanning, and integration with mobile apps and cloud platforms, enhance their appeal. Growing e-commerce, expanding logistics networks, and the need for rapid on-the-go data capture further drive adoption. Portable barcode readers are increasingly preferred for their convenience, cost-effectiveness, and adaptability in dynamic industrial and commercial environments.

  • Data Management Systems segment is expected to witness highest growth over the forecast period

The data management systems segment is projected to witness the highest growth as companies increasingly focus on efficient storage, analysis, and utilization of barcode-generated data. Advanced software solutions enable integration of scanning devices with enterprise resource planning (ERP) systems, warehouse management systems, and cloud platforms, improving operational transparency and decision-making. Industries such as pharmaceuticals, logistics, and retail rely on robust data management for traceability, compliance, and inventory optimization. Growing adoption of IoT-enabled devices and AI-based analytics further enhances the utility of barcode systems. As businesses seek actionable insights from scanned data, demand for sophisticated data management solutions continues to expand rapidly.

  • Pharmaceuticals & Healthcare segment is expected to witness highest growth over the forecast period

The pharmaceuticals and healthcare segment is expected to witness the highest growth due to stringent regulations on serialization, traceability, and patient safety. Data Matrix barcodes are critical for labeling drugs, medical devices, and consumables, ensuring compliance with FDA, EU FMD, and other global standards. Barcode reading systems reduce errors, prevent counterfeit products, and enhance supply chain transparency.

Additionally, hospitals, pharmacies, and laboratories increasingly adopt portable scanners and integrated software for real-time tracking, inventory management, and patient record accuracy. For instance, Macsa ID UK Ltd launched its Serial Pharma software, enabling EU Falsified Medical Directive (FMD) compliance by integrating DataMatrix code reading and alphanumeric control. This advancement increased adoption of DataMatrix barcode reading systems in pharmaceuticals, enhancing traceability, regulatory compliance, and supply chain security, thereby driving growth in the global market. Rising healthcare digitization, combined with the need for secure, error-free operations, is driving rapid adoption of Data Matrix barcode readers in this highly regulated segment.

  • North America Region is expected to witness highest growth over the forecast period

North America is expected to witness the highest growth in the Data Matrix Barcode Reading System market due to widespread adoption of automation, advanced manufacturing, and healthcare digitization. Strong regulatory frameworks, particularly in pharmaceuticals and medical devices, mandate serialization and traceability, boosting demand for high-accuracy barcode readers.

The presence of major technology providers, advanced logistics networks, and well-established retail and e-commerce sectors further supports market expansion. For instance, in January 2025, Cognex Corporation launched the DataMan® 290 and 390 barcode readers, leveraging AI for reliable decoding across manufacturing applications. Their intuitive setup and deployment enhanced operational efficiency, boosting adoption of DataMatrix barcode reading systems in North America and supporting rising automation and industrial digitization across manufacturing and logistics sectors.

Additionally, government initiatives promoting digital supply chains and Industry 4.0 adoption encourage integration of barcode systems with IoT and data management platforms. High awareness of operational efficiency and product safety makes North America a leading growth region globally.

Data Matrix Barcode Reading System Market table

To Learn More About This Report - Request a Free Sample Copy

Data Matrix Barcode Reading System Market Competitive Landscape

The competitive landscape of the Global Data Matrix Barcode Reading System Market is characterized by a mix of established technology providers and specialized barcode solution companies. Key players compete on product accuracy, decoding speed, durability, and ease of integration with enterprise systems. Companies differentiate through innovations in AI-based recognition, machine vision, and IoT-enabled scanning solutions. Strategic partnerships with OEMs, logistics providers, and software developers help expand market reach. Pricing, customer support, and software customization are critical for market leadership. The market remains dynamic, with continuous technological advancements and increasing regulatory compliance requirements driving intense competition among global and regional players.

The major players for above market are:

  • Zebra Technologies
  • Honeywell International Inc.
  • Datalogic S.p.A.
  • Cognex Corporation
  • Panasonic Corporation
  • SICK AG
  • Keyence Corporation
  • Omron Corporation
  • Toshiba TEC Corporation
  • SEWOO Tech
  • Motorola Solutions
  • Symbol Technologies (now part of Zebra)
  • Newland Auto-ID Technology
  • Unitech Electronics Co., Ltd.
  • Code Corporation (part of Datalogic)
  • Intermec (acquired by Honeywell)
  • JADAK (also part of Honeywell)
  • Argox Information Co., Ltd.
  • Captuvo (via Honeywell solutions)
  • Motorola (legacy brand integrated in Zebra/Honeywell)

Recent Development

  • In November 2025, GS1’s collaboration with Google enabled DataMatrix barcode scanning via Google Lens, enhancing access to medical product information and boosting demand for barcode reading systems in healthcare. Increased smartphone-based scanning encouraged manufacturers to adopt robust DataMatrix readers, accelerating market growth in pharmaceuticals and expanding opportunities for advanced barcode technologies globally.


  • In 2022, Cognex Corporation launched the DataMan 280 series, enhancing high-speed, accurate reading of 1D, 2D, and DPM codes in manufacturing and logistics. Its advanced decoding technology and compact design increased adoption of fixed-mount DataMatrix barcode readers, strengthening market growth and driving demand for efficient, reliable barcode reading solutions globally.


Frequently Asked Questions (FAQ) :

Q1. What are the main growth-driving factors for this market?

The surge in high-density data requirements drives market growth. Unlike 1D codes, Data Matrix barcodes store significant information in small spaces, making them essential for electronics and healthcare. Increasing regulatory demands for product traceability, anti-counterfeiting measures, and the expansion of automated logistics globally further accelerate the adoption of advanced reading systems.

Q2. What are the main restraining factors for this market?

High initial installation costs for high-speed, image-based scanners can restrain growth, particularly for small-to-medium enterprises. Additionally, technical challenges such as reading codes on curved, reflective, or damaged surfaces require expensive specialized lighting and optics. The complexity of integrating these systems with legacy software also poses a significant barrier to implementation.

Q3. Which segment is expected to witness high growth?

The Healthcare and Pharmaceuticals segment is expected to witness the highest growth. Strict global mandates for Unique Device Identification (UDI) and medicine serialization require the compact, robust data storage that Data Matrix codes provide. This ensures patient safety through precise tracking of surgical instruments and drugs throughout the supply chain.

Q4. Who are the top major players for this market?

The market is led by prominent automation and imaging giants including Cognex Corporation, Keyence Corporation, and Datalogic S.p.A. Other significant players include Honeywell International, Zebra Technologies, Sick AG, and Omron Microscan Systems. These companies lead through continuous innovation in AI-powered decoding algorithms and high-resolution industrial sensor technology.

Q5. Which country is the largest player?

The United States is currently the largest player in the Data Matrix Barcode Reading System market. This leadership is sustained by a highly technologically advanced manufacturing sector, extensive R&D investments, and early adoption of stringent traceability standards in the aerospace, defense, and pharmaceutical industries, alongside a booming e-commerce infrastructure.

Data Matrix Barcode Reading System MARKET STUDY GLOBAL MARKET ANALYSIS, INSIGHTS AND FORECAST, 2022-2029

    1. Introduction

    • 1.1. Research Scope
    • 1.2. Market Segmentation
    • 1.3. Research Methodology
    • 1.4. Definitions and Assumptions

    2. Executive Summary

      3. Market Dynamics

      • 3.1. Market Drivers
      • 3.2. Market Restraints
      • 3.3. Market Opportunities

      4. Key Insights

      • 4.1. Key Emerging Trends – For Major Countries
      • 4.2. Latest Technological Advancement
      • 4.3. Regulatory Landscape
      • 4.4. Industry SWOT Analysis
      • 4.5. Porters Five Forces Analysis

      5. Global Data Matrix Barcode Reading System Market Analysis (USD Billion), Insights and Forecast, 2018-2029

      • 5.1. Key Findings / Summary
      • 5.2. Market Analysis, Insights and Forecast – By Segment 1
        • 5.2.1. Sub-Segment 1
        • 5.2.2. Sub-Segment 2
      • 5.3. Market Analysis, Insights and Forecast – By Segment 2
        • 5.3.1. Sub-Segment 1
        • 5.3.2. Sub-Segment 2
        • 5.3.3. Sub-Segment 3
        • 5.3.4. Others
      • 5.4. Market Analysis, Insights and Forecast – By Segment 3
        • 5.4.1. Sub-Segment 1
        • 5.4.2. Sub-Segment 2
        • 5.4.3. Sub-Segment 3
        • 5.4.4. Others
      • 5.5. Market Analysis, Insights and Forecast – By Region
        • 5.5.1. North America
        • 5.5.2. Latin America
        • 5.5.3. Europe
        • 5.5.4. Asia Pacific
        • 5.5.5. Middle East and Africa

      6. North America Data Matrix Barcode Reading System Market Analysis (USD Billion), Insights and Forecast, 2018-2029

      • 6.1. Key Findings / Summary
      • 6.2. Market Analysis, Insights and Forecast – By Segment 1
        • 6.2.1. Sub-Segment 1
        • 6.2.2. Sub-Segment 2
      • 6.3. Market Analysis, Insights and Forecast – By Segment 2
        • 6.3.1. Sub-Segment 1
        • 6.3.2. Sub-Segment 2
        • 6.3.3. Sub-Segment 3
        • 6.3.4. Others
      • 6.4. Market Analysis, Insights and Forecast – By Segment 3
        • 6.4.1. Sub-Segment 1
        • 6.4.2. Sub-Segment 2
        • 6.4.3. Sub-Segment 3
        • 6.4.4. Others
      • 6.5. Market Analysis, Insights and Forecast – By Country
        • 6.5.1. U.S.
        • 6.5.2. Canada

      7. Latin America Data Matrix Barcode Reading System Market Analysis (USD Billion), Insights and Forecast, 2018-2029

      • 7.1. Key Findings / Summary
      • 7.2. Market Analysis, Insights and Forecast – By Segment 1
        • 7.2.1. Sub-Segment 1
        • 7.2.2. Sub-Segment 2
      • 7.3. Market Analysis, Insights and Forecast – By Segment 2
        • 7.3.1. Sub-Segment 1
        • 7.3.2. Sub-Segment 2
        • 7.3.3. Sub-Segment 3
        • 7.3.4. Others
      • 7.4. Market Analysis, Insights and Forecast – By Segment 3
        • 7.4.1. Sub-Segment 1
        • 7.4.2. Sub-Segment 2
        • 7.4.3. Sub-Segment 3
        • 7.4.4. Others
      • 7.5. Insights and Forecast – By Country
        • 7.5.1. Brazil
        • 7.5.2. Mexico
        • 7.5.3. Rest of Latin America

      8. Europe Data Matrix Barcode Reading System Market Analysis (USD Billion), Insights and Forecast, 2018-2029

      • 8.1. Key Findings / Summary
      • 8.2. Market Analysis, Insights and Forecast – By Segment 1
        • 8.2.1. Sub-Segment 1
        • 8.2.2. Sub-Segment 2
      • 8.3. Market Analysis, Insights and Forecast – By Segment 2
        • 8.3.1. Sub-Segment 1
        • 8.3.2. Sub-Segment 2
        • 8.3.3. Sub-Segment 3
        • 8.3.4. Others
      • 8.4. Market Analysis, Insights and Forecast – By Segment 3
        • 8.4.1. Sub-Segment 1
        • 8.4.2. Sub-Segment 2
        • 8.4.3. Sub-Segment 3
        • 8.4.4. Others
      • 8.5. Market Analysis, Insights and Forecast – By Country
        • 8.5.1. UK
        • 8.5.2. Germany
        • 8.5.3. France
        • 8.5.4. Italy
        • 8.5.5. Spain
        • 8.5.6. Russia
        • 8.5.7. Rest of Europe

      9. Asia Pacific Data Matrix Barcode Reading System Market Analysis (USD Billion), Insights and Forecast, 2018-2029

      • 9.1. Key Findings / Summary
      • 9.2. Market Analysis, Insights and Forecast – By Segment 1
        • 9.2.1. Sub-Segment 1
        • 9.2.2. Sub-Segment 2
      • 9.3. Market Analysis, Insights and Forecast – By Segment 2
        • 9.3.1. Sub-Segment 1
        • 9.3.2. Sub-Segment 2
        • 9.3.3. Sub-Segment 3
        • 9.3.4. Others
      • 9.4. Market Analysis, Insights and Forecast – By Segment 3
        • 9.4.1. Sub-Segment 1
        • 9.4.2. Sub-Segment 2
        • 9.4.3. Sub-Segment 3
        • 9.4.4. Others
      • 9.5. Market Analysis, Insights and Forecast – By Country
        • 9.5.1. China
        • 9.5.2. India
        • 9.5.3. Japan
        • 9.5.4. Australia
        • 9.5.5. South East Asia
        • 9.5.6. Rest of Asia Pacific

      10. Middle East & Africa Data Matrix Barcode Reading System Market Analysis (USD Billion), Insights and Forecast, 2018-2029

      • 10.1. Key Findings / Summary
      • 10.2. Market Analysis, Insights and Forecast – By Segment 1
        • 10.2.1. Sub-Segment 1
        • 10.2.2. Sub-Segment 2
      • 10.3. Market Analysis, Insights and Forecast – By Segment 2
        • 10.3.1. Sub-Segment 1
        • 10.3.2. Sub-Segment 2
        • 10.3.3. Sub-Segment 3
        • 10.3.4. Others
      • 10.4. Market Analysis, Insights and Forecast – By Segment 3
        • 10.4.1. Sub-Segment 1
        • 10.4.2. Sub-Segment 2
        • 10.4.3. Sub-Segment 3
        • 10.4.4. Others
      • 10.5. Market Analysis, Insights and Forecast – By Country
        • 10.5.1. GCC
        • 10.5.2. South Africa
        • 10.5.3. Rest of Middle East & Africa

      11. Competitive Analysis

      • 11.1. Company Market Share Analysis, 2018
      • 11.2. Key Industry Developments
      • 11.3. Company Profile
        • 11.3.1. Company 1
          • 11.3.1.1. Business Overview
          • 11.3.1.2. Segment 1 & Service Offering
          • 11.3.1.3. Overall Revenue
          • 11.3.1.4. Geographic Presence
          • 11.3.1.5. Recent Development
        *Similar details will be provided for the following companies
        • 11.3.2. Company 2
        • 11.3.3. Company 3
        • 11.3.4. Company 4
        • 11.3.5. Company 5
        • 11.3.6. Company 6
        • 11.3.7. Company 7
        • 11.3.8. Company 8
        • 11.3.9. Company 9
        • 11.3.10. Company 10
        • 11.3.11. Company 11
        • 11.3.12. Company 12
      List of Figures

      Figure 1: Global Data Matrix Barcode Reading System Market Revenue Breakdown (USD Billion, %) by Region, 2022 & 2029
      Figure 2: Global Data Matrix Barcode Reading System Market Value Share (%), By Segment 1, 2022 & 2029
      Figure 3: Global Data Matrix Barcode Reading System Market Forecast (USD Billion), by Sub-Segment 1, 2018-2029
      Figure 4: Global Data Matrix Barcode Reading System Market Forecast (USD Billion), by Sub-Segment 2, 2018-2029
      Figure 5: Global Data Matrix Barcode Reading System Market Value Share (%), By Segment 2, 2022 & 2029
      Figure 6: Global Data Matrix Barcode Reading System Market Forecast (USD Billion), by Sub-Segment 1, 2018-2029
      Figure 7: Global Data Matrix Barcode Reading System Market Forecast (USD Billion), by Sub-Segment 2, 2018-2029
      Figure 8: Global Data Matrix Barcode Reading System Market Forecast (USD Billion), by Sub-Segment 3, 2018-2029
      Figure 9: Global Data Matrix Barcode Reading System Market Forecast (USD Billion), by Others, 2018-2029
      Figure 10: Global Data Matrix Barcode Reading System Market Value Share (%), By Segment 3, 2022 & 2029
      Figure 11: Global Data Matrix Barcode Reading System Market Forecast (USD Billion), by Sub-Segment 1, 2018-2029
      Figure 12: Global Data Matrix Barcode Reading System Market Forecast (USD Billion), by Sub-Segment 2, 2018-2029
      Figure 13: Global Data Matrix Barcode Reading System Market Forecast (USD Billion), by Sub-Segment 3, 2018-2029
      Figure 14: Global Data Matrix Barcode Reading System Market Forecast (USD Billion), by Others, 2018-2029
      Figure 15: Global Data Matrix Barcode Reading System Market Value (USD Billion), by Region, 2022 & 2029
      Figure 16: North America Data Matrix Barcode Reading System Market Value Share (%), By Segment 1, 2022 & 2029
      Figure 17: North America Data Matrix Barcode Reading System Market Forecast (USD Billion), by Sub-Segment 1, 2018-2029
      Figure 18: North America Data Matrix Barcode Reading System Market Forecast (USD Billion), by Sub-Segment 2, 2018-2029
      Figure 19: North America Data Matrix Barcode Reading System Market Value Share (%), By Segment 2, 2022 & 2029
      Figure 20: North America Data Matrix Barcode Reading System Market Forecast (USD Billion), by Sub-Segment 1, 2018-2029
      Figure 21: North America Data Matrix Barcode Reading System Market Forecast (USD Billion), by Sub-Segment 2, 2018-2029
      Figure 22: North America Data Matrix Barcode Reading System Market Forecast (USD Billion), by Sub-Segment 3, 2018-2029
      Figure 23: North America Data Matrix Barcode Reading System Market Forecast (USD Billion), by Others, 2018-2029
      Figure 24: North America Data Matrix Barcode Reading System Market Value Share (%), By Segment 3, 2022 & 2029
      Figure 25: North America Data Matrix Barcode Reading System Market Forecast (USD Billion), by Sub-Segment 1, 2018-2029
      Figure 26: North America Data Matrix Barcode Reading System Market Forecast (USD Billion), by Sub-Segment 2, 2018-2029
      Figure 27: North America Data Matrix Barcode Reading System Market Forecast (USD Billion), by Sub-Segment 3, 2018-2029
      Figure 28: North America Data Matrix Barcode Reading System Market Forecast (USD Billion), by Others, 2018-2029
      Figure 29: North America Data Matrix Barcode Reading System Market Forecast (USD Billion), by U.S., 2018-2029
      Figure 30: North America Data Matrix Barcode Reading System Market Forecast (USD Billion), by Canada, 2018-2029
      Figure 31: Latin America Data Matrix Barcode Reading System Market Value Share (%), By Segment 1, 2022 & 2029
      Figure 32: Latin America Data Matrix Barcode Reading System Market Forecast (USD Billion), by Sub-Segment 1, 2018-2029
      Figure 33: Latin America Data Matrix Barcode Reading System Market Forecast (USD Billion), by Sub-Segment 2, 2018-2029
      Figure 34: Latin America Data Matrix Barcode Reading System Market Value Share (%), By Segment 2, 2022 & 2029
      Figure 35: Latin America Data Matrix Barcode Reading System Market Forecast (USD Billion), by Sub-Segment 1, 2018-2029
      Figure 36: Latin America Data Matrix Barcode Reading System Market Forecast (USD Billion), by Sub-Segment 2, 2018-2029
      Figure 37: Latin America Data Matrix Barcode Reading System Market Forecast (USD Billion), by Sub-Segment 3, 2018-2029
      Figure 38: Latin America Data Matrix Barcode Reading System Market Forecast (USD Billion), by Others, 2018-2029
      Figure 39: Latin America Data Matrix Barcode Reading System Market Value Share (%), By Segment 3, 2022 & 2029
      Figure 40: Latin America Data Matrix Barcode Reading System Market Forecast (USD Billion), by Sub-Segment 1, 2018-2029
      Figure 41: Latin America Data Matrix Barcode Reading System Market Forecast (USD Billion), by Sub-Segment 2, 2018-2029
      Figure 42: Latin America Data Matrix Barcode Reading System Market Forecast (USD Billion), by Sub-Segment 3, 2018-2029
      Figure 43: Latin America Data Matrix Barcode Reading System Market Forecast (USD Billion), by Others, 2018-2029
      Figure 44: Latin America Data Matrix Barcode Reading System Market Forecast (USD Billion), by Brazil, 2018-2029
      Figure 45: Latin America Data Matrix Barcode Reading System Market Forecast (USD Billion), by Mexico, 2018-2029
      Figure 46: Latin America Data Matrix Barcode Reading System Market Forecast (USD Billion), by Rest of Latin America, 2018-2029
      Figure 47: Europe Data Matrix Barcode Reading System Market Value Share (%), By Segment 1, 2022 & 2029
      Figure 48: Europe Data Matrix Barcode Reading System Market Forecast (USD Billion), by Sub-Segment 1, 2018-2029
      Figure 49: Europe Data Matrix Barcode Reading System Market Forecast (USD Billion), by Sub-Segment 2, 2018-2029
      Figure 50: Europe Data Matrix Barcode Reading System Market Value Share (%), By Segment 2, 2022 & 2029
      Figure 51: Europe Data Matrix Barcode Reading System Market Forecast (USD Billion), by Sub-Segment 1, 2018-2029
      Figure 52: Europe Data Matrix Barcode Reading System Market Forecast (USD Billion), by Sub-Segment 2, 2018-2029
      Figure 53: Europe Data Matrix Barcode Reading System Market Forecast (USD Billion), by Sub-Segment 3, 2018-2029
      Figure 54: Europe Data Matrix Barcode Reading System Market Forecast (USD Billion), by Others, 2018-2029
      Figure 55: Europe Data Matrix Barcode Reading System Market Value Share (%), By Segment 3, 2022 & 2029
      Figure 56: Europe Data Matrix Barcode Reading System Market Forecast (USD Billion), by Sub-Segment 1, 2018-2029
      Figure 57: Europe Data Matrix Barcode Reading System Market Forecast (USD Billion), by Sub-Segment 2, 2018-2029
      Figure 58: Europe Data Matrix Barcode Reading System Market Forecast (USD Billion), by Sub-Segment 3, 2018-2029
      Figure 59: Europe Data Matrix Barcode Reading System Market Forecast (USD Billion), by Others, 2018-2029
      Figure 60: Europe Data Matrix Barcode Reading System Market Forecast (USD Billion), by U.K., 2018-2029
      Figure 61: Europe Data Matrix Barcode Reading System Market Forecast (USD Billion), by Germany, 2018-2029
      Figure 62: Europe Data Matrix Barcode Reading System Market Forecast (USD Billion), by France, 2018-2029
      Figure 63: Europe Data Matrix Barcode Reading System Market Forecast (USD Billion), by Italy, 2018-2029
      Figure 64: Europe Data Matrix Barcode Reading System Market Forecast (USD Billion), by Spain, 2018-2029
      Figure 65: Europe Data Matrix Barcode Reading System Market Forecast (USD Billion), by Russia, 2018-2029
      Figure 66: Europe Data Matrix Barcode Reading System Market Forecast (USD Billion), by Rest of Europe, 2018-2029
      Figure 67: Asia Pacific Data Matrix Barcode Reading System Market Value Share (%), By Segment 1, 2022 & 2029
      Figure 68: Asia Pacific Data Matrix Barcode Reading System Market Forecast (USD Billion), by Sub-Segment 1, 2018-2029
      Figure 69: Asia Pacific Data Matrix Barcode Reading System Market Forecast (USD Billion), by Sub-Segment 2, 2018-2029
      Figure 70: Asia Pacific Data Matrix Barcode Reading System Market Value Share (%), By Segment 2, 2022 & 2029
      Figure 71: Asia Pacific Data Matrix Barcode Reading System Market Forecast (USD Billion), by Sub-Segment 1, 2018-2029
      Figure 72: Asia Pacific Data Matrix Barcode Reading System Market Forecast (USD Billion), by Sub-Segment 2, 2018-2029
      Figure 73: Asia Pacific Data Matrix Barcode Reading System Market Forecast (USD Billion), by Sub-Segment 3, 2018-2029
      Figure 74: Asia Pacific Data Matrix Barcode Reading System Market Forecast (USD Billion), by Others, 2018-2029
      Figure 75: Asia Pacific Data Matrix Barcode Reading System Market Value Share (%), By Segment 3, 2022 & 2029
      Figure 76: Asia Pacific Data Matrix Barcode Reading System Market Forecast (USD Billion), by Sub-Segment 1, 2018-2029
      Figure 77: Asia Pacific Data Matrix Barcode Reading System Market Forecast (USD Billion), by Sub-Segment 2, 2018-2029
      Figure 78: Asia Pacific Data Matrix Barcode Reading System Market Forecast (USD Billion), by Sub-Segment 3, 2018-2029
      Figure 79: Asia Pacific Data Matrix Barcode Reading System Market Forecast (USD Billion), by Others, 2018-2029
      Figure 80: Asia Pacific Data Matrix Barcode Reading System Market Forecast (USD Billion), by China, 2018-2029
      Figure 81: Asia Pacific Data Matrix Barcode Reading System Market Forecast (USD Billion), by India, 2018-2029
      Figure 82: Asia Pacific Data Matrix Barcode Reading System Market Forecast (USD Billion), by Japan, 2018-2029
      Figure 83: Asia Pacific Data Matrix Barcode Reading System Market Forecast (USD Billion), by Australia, 2018-2029
      Figure 84: Asia Pacific Data Matrix Barcode Reading System Market Forecast (USD Billion), by Southeast Asia, 2018-2029
      Figure 85: Asia Pacific Data Matrix Barcode Reading System Market Forecast (USD Billion), by Rest of Asia Pacific, 2018-2029
      Figure 86: Middle East & Africa Data Matrix Barcode Reading System Market Value Share (%), By Segment 1, 2022 & 2029
      Figure 87: Middle East & Africa Data Matrix Barcode Reading System Market Forecast (USD Billion), by Sub-Segment 1, 2018-2029
      Figure 88: Middle East & Africa Data Matrix Barcode Reading System Market Forecast (USD Billion), by Sub-Segment 2, 2018-2029
      Figure 89: Middle East & Africa Data Matrix Barcode Reading System Market Value Share (%), By Segment 2, 2022 & 2029
      Figure 90: Middle East & Africa Data Matrix Barcode Reading System Market Forecast (USD Billion), by Sub-Segment 1, 2018-2029
      Figure 91: Middle East & Africa Data Matrix Barcode Reading System Market Forecast (USD Billion), by Sub-Segment 2, 2018-2029
      Figure 92: Middle East & Africa Data Matrix Barcode Reading System Market Forecast (USD Billion), by Sub-Segment 3, 2018-2029
      Figure 93: Middle East & Africa Data Matrix Barcode Reading System Market Forecast (USD Billion), by Others, 2018-2029
      Figure 94: Middle East & Africa Data Matrix Barcode Reading System Market Value Share (%), By Segment 3, 2022 & 2029
      Figure 95: Middle East & Africa Data Matrix Barcode Reading System Market Forecast (USD Billion), by Sub-Segment 1, 2018-2029
      Figure 96: Middle East & Africa Data Matrix Barcode Reading System Market Forecast (USD Billion), by Sub-Segment 2, 2018-2029
      Figure 97: Middle East & Africa Data Matrix Barcode Reading System Market Forecast (USD Billion), by Sub-Segment 3, 2018-2029
      Figure 98: Middle East & Africa Data Matrix Barcode Reading System Market Forecast (USD Billion), by Others, 2018-2029
      Figure 99: Middle East & Africa Data Matrix Barcode Reading System Market Forecast (USD Billion), by GCC, 2018-2029
      Figure 100: Middle East & Africa Data Matrix Barcode Reading System Market Forecast (USD Billion), by South Africa, 2018-2029
      Figure 101: Middle East & Africa Data Matrix Barcode Reading System Market Forecast (USD Billion), by Rest of Middle East & Africa, 2018-2029 
      List of Tables
      Table 1: Global Data Matrix Barcode Reading System Market Revenue (USD Billion) Forecast, by Segment 1, 2018-2029
      Table 2: Global Data Matrix Barcode Reading System Market Revenue (USD Billion) Forecast, by Segment 2, 2018-2029
      Table 3: Global Data Matrix Barcode Reading System Market Revenue (USD Billion) Forecast, by Segment 3, 2018-2029
      Table 4: Global Data Matrix Barcode Reading System Market Revenue (USD Billion) Forecast, by Region, 2018-2029
      Table 5: North America Data Matrix Barcode Reading System Market Revenue (USD Billion) Forecast, by Segment 1, 2018-2029
      Table 6: North America Data Matrix Barcode Reading System Market Revenue (USD Billion) Forecast, by Segment 2, 2018-2029
      Table 7: North America Data Matrix Barcode Reading System Market Revenue (USD Billion) Forecast, by Segment 3, 2018-2029
      Table 8: North America Data Matrix Barcode Reading System Market Revenue (USD Billion) Forecast, by Country, 2018-2029
      Table 9: Europe Data Matrix Barcode Reading System Market Revenue (USD Billion) Forecast, by Segment 1, 2018-2029
      Table 10: Europe Data Matrix Barcode Reading System Market Revenue (USD Billion) Forecast, by Segment 2, 2018-2029
      Table 11: Europe Data Matrix Barcode Reading System Market Revenue (USD Billion) Forecast, by Segment 3, 2018-2029
      Table 12: Europe Data Matrix Barcode Reading System Market Revenue (USD Billion) Forecast, by Country, 2018-2029
      Table 13: Latin America Data Matrix Barcode Reading System Market Revenue (USD Billion) Forecast, by Segment 1, 2018-2029
      Table 14: Latin America Data Matrix Barcode Reading System Market Revenue (USD Billion) Forecast, by Segment 2, 2018-2029
      Table 15: Latin America Data Matrix Barcode Reading System Market Revenue (USD Billion) Forecast, by Segment 3, 2018-2029
      Table 16: Latin America Data Matrix Barcode Reading System Market Revenue (USD Billion) Forecast, by Country, 2018-2029
      Table 17: Asia Pacific Data Matrix Barcode Reading System Market Revenue (USD Billion) Forecast, by Segment 1, 2018-2029
      Table 18: Asia Pacific Data Matrix Barcode Reading System Market Revenue (USD Billion) Forecast, by Segment 2, 2018-2029
      Table 19: Asia Pacific Data Matrix Barcode Reading System Market Revenue (USD Billion) Forecast, by Segment 3, 2018-2029
      Table 20: Asia Pacific Data Matrix Barcode Reading System Market Revenue (USD Billion) Forecast, by Country, 2018-2029
      Table 21: Middle East & Africa Data Matrix Barcode Reading System Market Revenue (USD Billion) Forecast, by Segment 1, 2018-2029
      Table 22: Middle East & Africa Data Matrix Barcode Reading System Market Revenue (USD Billion) Forecast, by Segment 2, 2018-2029
      Table 23: Middle East & Africa Data Matrix Barcode Reading System Market Revenue (USD Billion) Forecast, by Segment 3, 2018-2029
      Table 24: Middle East & Africa Data Matrix Barcode Reading System Market Revenue (USD Billion) Forecast, by Country, 2018-2029
      Research Process

      Data Library Research are conducted by industry experts who offer insight on industry structure, market segmentations technology assessment and competitive landscape (CL), and penetration, as well as on emerging trends. Their analysis is based on primary interviews (~ 80%) and secondary research (~ 20%) as well as years of professional expertise in their respective industries. Adding to this, by analysing historical trends and current market positions, our analysts predict where the market will be headed for the next five years. Furthermore, the varying trends of segment & categories geographically presented are also studied and the estimated based on the primary & secondary research.

      In this particular report from the supply side Data Library Research has conducted primary surveys (interviews) with the key level executives (VP, CEO’s, Marketing Director, Business Development Manager and SOFT) of the companies that active & prominent as well as the midsized organization

      FIGURE 1: DLR RESEARH PROCESS

      research-methodology1

      Primary Research

      Extensive primary research was conducted to gain a deeper insight of the market and industry performance. The analysis is based on both primary and secondary research as well as years of professional expertise in the respective industries.

      In addition to analysing current and historical trends, our analysts predict where the market is headed over the next five years.

      It varies by segment for these categories geographically presented in the list of market tables. Speaking about this particular report we have conducted primary surveys (interviews) with the key level executives (VP, CEO’s, Marketing Director, Business Development Manager and many more) of the major players active in the market.

      Secondary Research

      Secondary research was mainly used to collect and identify information useful for the extensive, technical, market-oriented, and Friend’s study of the Global Extra Neutral Alcohol. It was also used to obtain key information about major players, market classification and segmentation according to the industry trends, geographical markets, and developments related to the market and technology perspectives. For this study, analysts have gathered information from various credible sources, such as annual reports, sec filings, journals, white papers, SOFT presentations, and company web sites.

      Market Size Estimation

      Both, top-down and bottom-up approaches were used to estimate and validate the size of the Global market and to estimate the size of various other dependent submarkets in the overall Extra Neutral Alcohol. The key players in the market were identified through secondary research and their market contributions in the respective geographies were determined through primary and secondary research.

      Forecast Model

      research-methodology2