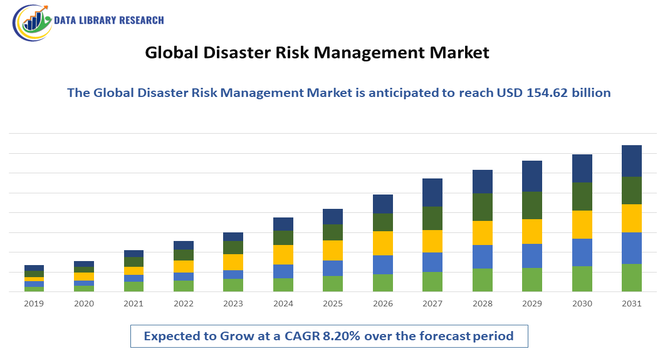
The Global Disaster Risk Management Market size was estimated for USD 96.69 billion in 2025 and is anticipated to reach around USD 154.62 billion by 2032, growing at a CAGR of 8.20% from 2025 to 2032.
Get Complete Analysis Of The Report - Download Updated Free Sample PDF
The Global Disaster Risk Management Market involves solutions, services, and technologies designed to prevent, mitigate, respond to, and recover from natural and human-made disasters. It includes risk assessment, early warning systems, emergency response tools, and recovery planning across sectors like government, healthcare, and infrastructure. Growing climate change impacts, increasing urbanization, and the need for resilient infrastructure are driving market growth, as organizations seek proactive strategies to minimize economic, social, and environmental losses worldwide.
The Global Disaster Risk Management Market is evolving with rising frequency and severity of natural and man-made disasters driving demand for comprehensive preparedness, response, and recovery solutions. Adoption of advanced technologies like AI, IoT, geospatial analytics, early warning systems, and real-time surveillance is transforming how risks are identified and managed, improving situational awareness and decision-making during emergencies. Governments and enterprises are increasingly investing in resilient infrastructure, cloud-based platforms, and predictive modeling to enhance readiness and minimize losses.
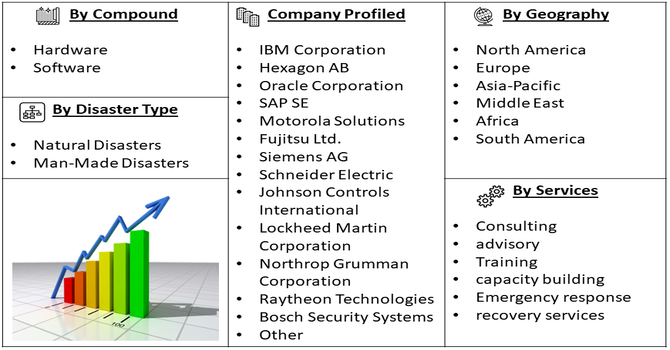
Segmentation: The Global Disaster Risk Management Market is segmented by Component (Hardware (Communication devices, Surveillance and monitoring equipment and Sensors and IoT devices), Software (Disaster risk assessment and modeling software, Early warning systems and Crisis management platforms), Services (Consulting and advisory, Training and capacity building and Emergency response and recovery services), Disaster Type (Natural Disasters (Earthquakes, Floods, Hurricanes/Typhoons and Others) and Man-Made Disasters), and Geography (North America, Europe, Asia-Pacific, Middle East and Africa, and South America). The report provides the value (in USD million) for the above segments.
For Detailed Market Segmentation - Get a Free Sample PDF
Market Drivers:
The Global Disaster Risk Management Market is driven by the rising frequency and intensity of natural disasters, including hurricanes, floods, wildfires, and earthquakes. Climate change, urbanization, and environmental degradation have amplified disaster risks, prompting governments, corporations, and communities to adopt proactive mitigation strategies. Organizations increasingly invest in early warning systems, risk assessment tools, and emergency response solutions to reduce human, economic, and infrastructure losses. Growing awareness of the long-term impact of disasters on public safety and economic stability continues to fuel global demand for comprehensive disaster risk management solutions.
Technological advancements and the adoption of integrated solutions are key drivers of market growth. Artificial intelligence, IoT, GIS mapping, big data analytics, and real-time monitoring systems improve disaster prediction, situational awareness, and response coordination. Cloud-based platforms enable seamless communication between stakeholders, while mobile and autonomous technologies enhance emergency operations. For instance, in July 2024, CENTEGIX partnered with Axon to integrate its wearable safety technology into the Fusus platform, advancing adoption of advanced, integrated solutions and strengthening the Global Disaster Risk Management Market through enhanced real-time emergency and incident management capabilities.
Governments and enterprises leverage predictive modeling and automated decision-making to reduce response times and optimize resource allocation. These innovations drive efficiency, scalability, and cost-effectiveness in disaster management, boosting adoption across sectors such as public safety, healthcare, infrastructure, and transportation worldwide.
Market Restraints:
High implementation costs and complex regulatory requirements restrain the Global Disaster Risk Management Market. Advanced hardware, software platforms, and integrated solutions require substantial investment, limiting adoption, especially in developing countries. Regulatory frameworks for data sharing, emergency response protocols, and technology compliance vary across regions, causing delays in deployment. Small and medium-sized enterprises and public organizations may struggle with funding, operational integration, and staff training. Additionally, maintaining, upgrading, and integrating multiple systems can be resource-intensive. These financial and administrative barriers hinder widespread adoption, despite growing awareness of disaster risks and the proven benefits of proactive risk management strategies.
Disaster risk management significantly influences socioeconomic stability by reducing the human, economic, and infrastructure losses caused by catastrophes. As disaster frequency rises, the cost of uninsured losses and community disruption increases, prompting governments to strengthen preparedness and response frameworks to protect vulnerable populations. Effective risk management enhances public safety, supports economic continuity, and limits the long term financial burden on healthcare and recovery systems. Investments in resilience create jobs, boost technological innovation, and promote economic stability by safeguarding infrastructure and supply chains. However, unequal access to resources and preparedness measures can exacerbate disparities, particularly in underserved regions facing high disaster exposure.
Segmental Analysis:
The Disaster Risk Assessment and Modeling Software segment is expected to witness the highest growth over the forecast period due to increasing demand for predictive analytics and proactive disaster management solutions. Organizations and governments are adopting advanced modeling tools to assess vulnerabilities, simulate potential disaster scenarios, and plan mitigation strategies effectively. Integration with AI, big data, and GIS technologies enables real-time risk visualization, enhanced decision-making, and resource optimization. Growing investments in resilient infrastructure, emergency preparedness, and climate adaptation strategies further drive adoption. The software’s ability to provide accurate forecasts, reduce response times, and minimize economic and human losses positions this segment as a critical driver of global disaster risk management market expansion.
The Earthquakes segment is projected to witness the highest growth due to the increasing frequency and destructive impact of seismic events worldwide. Earthquakes pose significant risks to urban infrastructure, human lives, and economic stability, driving demand for advanced monitoring, early warning, and risk assessment solutions. Governments, emergency services, and construction companies are investing in seismic-resistant infrastructure, predictive modeling software, and rapid response systems to minimize losses. Integration of IoT sensors, seismic networks, and GIS platforms allows real-time monitoring and accurate forecasting. Rising public awareness, regulatory requirements, and the need to safeguard densely populated regions further fuel market growth, making earthquake-focused disaster risk management solutions a key segment in the global market.
North America is expected to witness the highest growth in the disaster risk management market due to the region’s advanced infrastructure, high adoption of technology, and frequent exposure to natural and man-made disasters.
The presence of key market players, government investments in resilient infrastructure, and public–private collaborations drive demand for comprehensive disaster preparedness and response solutions. For instance, in 2025, The U.S. Department of Homeland Security announced over $1 billion in federal funding for Georgia through FEMA’s Public Assistance and Hazard Mitigation programs. This investment in repairing and strengthening critical infrastructure enhances disaster preparedness, resilience, and recovery capabilities, driving growth in North America’s Disaster Risk Management Market by supporting advanced mitigation and emergency response initiatives.
Advanced technologies such as AI, IoT, GIS mapping, and cloud-based platforms are widely integrated to enhance early warning systems, real-time monitoring, and emergency coordination. Additionally, stringent regulatory requirements, growing urbanization, and increased public awareness about disaster risks contribute to North America’s leadership in adopting innovative, scalable, and effective disaster risk management solutions.
| Report Matrics | Details |
| Market Size Value | USD 154.62 billion |
| Growth Rate | CAGR of 8.20 % |
| Forecast | 2026-2033 |
| Historical data | 2021-2024 |
| Base Year | 2025 |
| Report Coverage | Forecasted revenue, company rating, competitive environment, growth drivers, and trends |
| Segment Coverage | Type, Application, End-User, Geography |
| Regional Scope | North America, Europe, Asia Pacific, Middle East |
| Customized scope | Free customization of reports (With 3 months' analysis support) |
| To Learn More About This Report | Request a Free Sample Copy |
The Global Disaster Risk Management Market features a competitive mix of established technology providers, system integrators, and service specialists delivering hardware, software, and consulting solutions. Major players focus on innovation, partnerships, and expanding service portfolios to address diverse disaster scenarios and client needs. Companies offering real time monitoring systems, early warning tools, and command and control platforms lead market adoption, while professional services providers support governments and private entities in strategy development and implementation. Strategic collaborations, acquisitions, and investment in R&D enhance capabilities and market positioning. Demand for integrated, end to end risk management solutions encourages vendors to differentiate through scalable, cloud enabled, and AI powered offerings worldwide.
The 20 major players for above market are:
Recent Development
Q1. What are the main growth-driving factors for this market?
The primary driver is the increasing frequency and intensity of natural disasters linked to climate change, such as wildfires, floods, and hurricanes. Governments are investing heavily in early warning systems and resilient infrastructure to minimize economic losses. Additionally, the rapid urbanization of coastal areas necessitates advanced mapping and risk-modeling tools to protect dense populations.
Q2. What are the main restraining factors for this market?
Growth is hindered by high implementation costs and a lack of technical expertise in developing nations, where the need for disaster management is often greatest. Furthermore, fragmented data sharing between private companies and government agencies can lead to inefficient response strategies. Limited budget allocations in economically struggling regions often delay the adoption of modern, high-tech monitoring systems.
Q3. Which segment is expected to witness high growth?
The Surveillance and Analysis segment is expected to witness the highest growth. This includes the use of satellite imagery, AI-driven predictive modeling, and real-time sensor networks. As decision-makers seek to move from "reactive" to "proactive" strategies, the demand for sophisticated software that can simulate disaster scenarios and predict impact zones is skyrocketing.
Q4. Who are the top major players for this market?
The market is led by diversified technology and engineering firms that provide both software and physical infrastructure. Key players include Honeywell International, Lockheed Martin, IBM, NEC Corporation, and Motorola Solutions. These companies dominate by offering integrated platforms for emergency communication, public safety analytics, and critical infrastructure protection.
Q5. Which country is the largest player?
The United States is the largest player in the disaster risk management market. Its dominance is driven by high spending on homeland security, a robust network of private tech innovators, and the presence of specialized agencies like FEMA. Frequent exposure to diverse natural threats across the country keeps the U.S. at the forefront of DRM innovation.
Data Library Research are conducted by industry experts who offer insight on industry structure, market segmentations technology assessment and competitive landscape (CL), and penetration, as well as on emerging trends. Their analysis is based on primary interviews (~ 80%) and secondary research (~ 20%) as well as years of professional expertise in their respective industries. Adding to this, by analysing historical trends and current market positions, our analysts predict where the market will be headed for the next five years. Furthermore, the varying trends of segment & categories geographically presented are also studied and the estimated based on the primary & secondary research.
In this particular report from the supply side Data Library Research has conducted primary surveys (interviews) with the key level executives (VP, CEO’s, Marketing Director, Business Development Manager and SOFT) of the companies that active & prominent as well as the midsized organization
FIGURE 1: DLR RESEARH PROCESS
Extensive primary research was conducted to gain a deeper insight of the market and industry performance. The analysis is based on both primary and secondary research as well as years of professional expertise in the respective industries.
In addition to analysing current and historical trends, our analysts predict where the market is headed over the next five years.
It varies by segment for these categories geographically presented in the list of market tables. Speaking about this particular report we have conducted primary surveys (interviews) with the key level executives (VP, CEO’s, Marketing Director, Business Development Manager and many more) of the major players active in the market.
Secondary ResearchSecondary research was mainly used to collect and identify information useful for the extensive, technical, market-oriented, and Friend’s study of the Global Extra Neutral Alcohol. It was also used to obtain key information about major players, market classification and segmentation according to the industry trends, geographical markets, and developments related to the market and technology perspectives. For this study, analysts have gathered information from various credible sources, such as annual reports, sec filings, journals, white papers, SOFT presentations, and company web sites.
Market Size EstimationBoth, top-down and bottom-up approaches were used to estimate and validate the size of the Global market and to estimate the size of various other dependent submarkets in the overall Extra Neutral Alcohol. The key players in the market were identified through secondary research and their market contributions in the respective geographies were determined through primary and secondary research.
Forecast Model