Driver Real-time Drowsiness Detection System Market Overview and Analysis
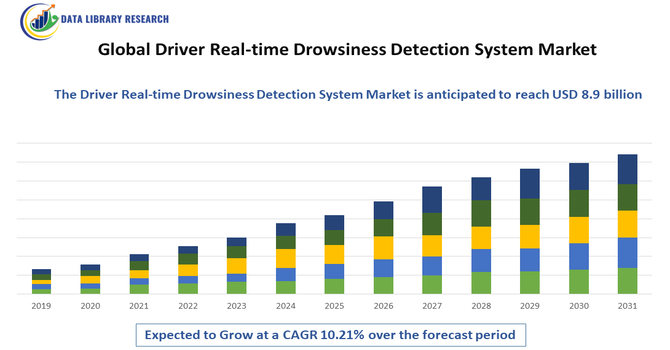
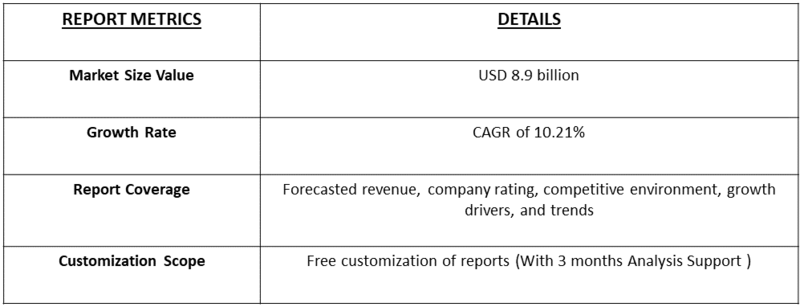
- The global real-time driver drowsiness detection system market size surpassed USD 3.26 billion in 2025 and is projected to showcase around 10.21% CAGR from 2025 to 2032, reaching USD 8.9 billion in the year 2032.
Get Complete Analysis Of The Report - Download Updated Free Sample PDF
The global real-time driver drowsiness detection system market encompasses technologies and solutions designed to monitor driver alertness, detect fatigue or sleepiness, and provide timely warnings. It serves automotive OEMs, commercial fleets, and aftermarket segments, driving road safety, reducing accidents, and integrating with advanced driver-assistance systems (ADAS).
The global real-time driver drowsiness detection system market is primarily driven by the increasing demand for road safety solutions due to rising accidents caused by driver fatigue, stricter government regulations mandating advanced driver-assistance systems (ADAS), and growing adoption of connected and autonomous vehicles. Additionally, the expansion of commercial transportation, rising awareness about vehicle safety features, advancements in AI and camera-based monitoring technologies, and declining sensor costs are accelerating market growth.
Driver Real-time Drowsiness Detection System Market Trends
A dominant trend in the global real-time driver drowsiness detection system market is the rapid integration of AI-powered, camera- and sensor-based driver monitoring modules into vehicles, with increasing adoption of facial recognition, eye-tracking, infrared, and biometric fusion technologies. These systems are also being embedded within broader ADAS and smart-cockpit architectures, while fleet and commercial-vehicle operators deploy them for analytics, telematics, and predictive safety, accelerating adoption across passenger, commercial, and aftermarket segments.
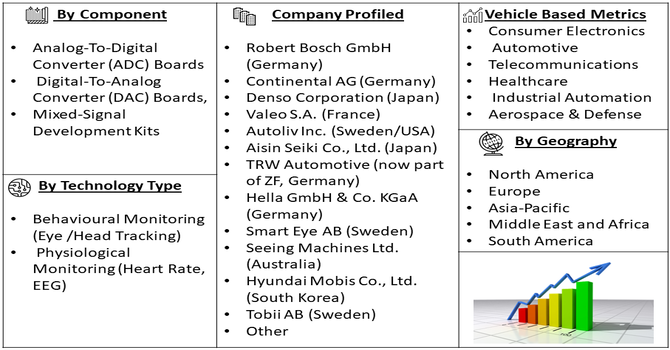
Segmentation: The Global Real Time Driver Drowsiness Detection System Market is segmented by Component (Hardware (Cameras, Sensors, and Ecus), Software (Algorithms, and Analytics) and Services), Vehicle Type (Passenger Cars and Commercial Vehicles (Heavy Trucks, Buses, and Fleets)), Technology Type (Behavioural Monitoring (Eye /Head Tracking), Physiological Monitoring (Heart Rate, EEG) and Vehicle Based Metrics (Steering, Lane Departure)), Sales Channel (OEM (Factory Fitted) and Aftermarket (Retrofit)) and Geography (North America, Europe, Asia-Pacific, Middle East and Africa, and South America). The report provides the value (in USD million) for the above segments.
For Detailed Market Segmentation - Get a Free Sample PDF
Market Drivers:
- Rising Road Safety Concerns
The primary drivers of the global real-time driver drowsiness detection system market is the rising incidence of fatigue-related road accidents, which has propelled both regulatory mandates and consumer demand for advanced safety features. The growing recognition that drowsy driving contributes significantly to vehicular fatalities and severe injuries has heightened pressure on automotive manufacturers to incorporate driver monitoring and alert-systems in new vehicles. In parallel, fleet operators and logistics companies are increasingly adopting such systems to improve driver alertness, reduce downtime, and manage insurance risk. Together, these factors are accelerating the integration of drowsiness detection technologies into both passenger cars and commercial-vehicle platforms.
- Technological Advancements
Another key driver is the rapid advancement in sensor, camera, artificial-intelligence (AI), and software-analytics technologies enabling more precise and cost-effective driver state monitoring. Innovations such as eye- and head-tracking cameras, infrared sensors, machine-learning algorithms for blink-rate and gaze detection, and multi-sensor fusion have improved the accuracy of drowsiness detection and reduced false alerts. As hardware costs decline and automotive-grade components scale, integration into mainstream vehicle models becomes feasible, expanding adoption beyond premium segments.
In September 2025, Netradyne introduced its Driver D-450 video safety platform along with the next-generation Driver Drowsiness Detection Sensor (DMS) in India, offering advanced driver monitoring with full trip analysis, early fatigue detection, and actionable coaching insights. The launch coincided with the Ministry of Road Transport & Highways preparing mandates for lane departure and driver drowsiness warning systems in commercial vehicles by 2026. Netradyne’s technology was regulation-ready, enhancing fleet safety across industries.
Market Restraint:
- High Cost and Technical Complexity
A significant restraint on growth in the driver drowsiness detection system market is the high cost and technical complexity of implementing reliable systems across diverse vehicle segments and geographies. Advanced solutions require expensive hardware (such as high-resolution cameras and infrared sensors), sophisticated software, and rigorous calibration and validation across vehicle types, lighting conditions, and driver behaviours. This cost burden especially limits adoption in lower-cost vehicles and price-sensitive markets.
Additionally, integration challenges (e.g., compatibility with vehicle CAN-bus systems), concerns about driver privacy, and varying regional regulatory frameworks further hamper widespread implementation and delay market penetration.
Socio Economic Impact on Driver Real-time Drowsiness Detection System Market
The global market for real time driver drowsiness detection systems, encompassing the broader category of driver monitoring technologies, is poised to generate meaningful socio economic benefits. By reducing fatigue related accidents—responsible for a substantial share of road fatalities—such systems enhance public safety outcomes and lessen burdens on healthcare systems and insurance networks. For commercial fleets, deployment can improve driver productivity and reduce downtime or damage costs, thereby boosting operational efficiency. Moreover, as adoption grows, the resultant demand stimulates jobs across sensor manufacturing, software development and vehicle integration sectors. At the same time, in emerging economies where vehicle ownership and long haul transport are rising, these systems support safer mobility and sustainable logistics growth. However, cost barriers and privacy concerns remain socio economic headwinds, particularly in price sensitive markets.
Segmental Analysis:
- Algorithms Segment is Expected to Witness Significant Growth Over the Forecast Period
The algorithms segment in the global driver drowsiness detection market is expected to grow rapidly because software plays a crucial role in analyzing driver behavior. Advanced algorithms can process data from cameras, sensors, and biometric devices to detect signs of fatigue, such as eye closure, head movement, and heart rate changes. With improvements in artificial intelligence and machine learning, these algorithms are becoming more accurate, reducing false alarms and improving safety. Automakers and fleet operators are increasingly adopting algorithm-based solutions to enhance driver monitoring systems. As vehicles become smarter and more connected, demand for sophisticated, reliable algorithms will continue to rise, driving this segment’s growth in the coming years.
- Passenger Cars Segment is Expected to Witness Significant Growth Over the Forecast Period
Passenger cars are projected to see strong growth in adopting driver drowsiness detection systems because safety awareness among everyday drivers is increasing. Many car buyers now look for vehicles equipped with advanced safety features, including real-time fatigue monitoring, as part of standard or optional packages. Automakers are integrating these systems to meet stricter safety regulations and consumer demand. Additionally, technological improvements and falling costs make it feasible to include such systems even in mid-range vehicles. As more drivers prioritize safety and convenience, the adoption of drowsiness detection technology in passenger cars will continue to expand steadily, making this segment one of the fastest-growing in the market.
- Physiological Monitoring Segment is Expected to Witness Significant Growth Over the Forecast Period
The physiological monitoring segment, which includes tracking heart rate, skin conductivity, and other body signals to detect driver fatigue, is expected to grow rapidly. This approach provides highly accurate insights into the driver’s alertness and can complement camera-based systems. As advanced sensors become smaller, more reliable, and cost-effective, automotive manufacturers are integrating physiological monitoring into both new vehicles and high-end fleets. Growing awareness of driver health and safety, especially in long-haul transport and commercial fleets, is fueling demand. Moreover, combining physiological data with AI-based analytics helps reduce accidents caused by drowsiness, increasing adoption. Overall, the segment is poised for substantial growth due to its effectiveness and reliability.
- Aftermarket Segment is Expected to Witness Significant Growth Over the Forecast Period
The aftermarket segment of driver drowsiness detection systems is expected to grow significantly as consumers and fleet operators look for cost-effective ways to upgrade older vehicles with safety features. Many vehicles on the road today do not come pre-installed with advanced monitoring systems, creating a large potential market for retrofit solutions. Aftermarket products, such as camera-based kits, sensor packages, and connected apps, allow drivers to enhance safety without purchasing a new car. Growing awareness of road safety, regulatory encouragement, and increasing affordability of aftermarket systems are driving this segment. As a result, aftermarket adoption is expected to expand rapidly, especially in regions with aging vehicle fleets.
- North America Region is Expected to Witness Significant Growth Over the Forecast Period
North America is anticipated to witness substantial growth in the driver drowsiness detection market due to a strong focus on road safety, stringent government regulations, and high adoption of advanced automotive technologies. The region has a large fleet of passenger and commercial vehicles, with fleet operators actively implementing safety systems to reduce accidents and insurance costs. Increasing awareness among consumers about the benefits of drowsiness detection systems is also driving demand.
Additionally, technological advancements and the presence of leading automotive manufacturers and technology companies in the U.S. and Canada accelerate adoption. As smart, connected, and semi-autonomous vehicles continue to grow, North America is expected to remain a key market for these systems.
To Learn More About This Report - Request a Free Sample Copy
Driver Real-time Drowsiness Detection System Market Competitive Analysis
In the global real time driver drowsiness detection system market, the competitive terrain features a blend of major automotive suppliers and specialized technology firms. Established players such as Robert Bosch GmbH, Continental AG and Denso Corporation dominate through long standing OEM relationships, robust sensor portfolios and large scale production capabilities. Meanwhile, a growing number of niche entrants focus on AI based camera analytics, biometric monitoring and aftermarket retrofit solutions, increasing competitive pressure. Barriers to entry remain significant due to integration complexity, calibration needs and regulatory compliance, but are gradually lowering as demand expands and system costs decline. As a result, competition is intensifying around innovation, system accuracy, false alarm reduction and cost optimization.
The major players for above market:
- Robert Bosch GmbH (Germany)
- Continental AG (Germany)
- Denso Corporation (Japan)
- Valeo S.A. (France)
- Autoliv Inc. (Sweden/USA)
- Magna International Inc. (Canada)
- Aisin Seiki Co., Ltd. (Japan)
- TRW Automotive (now part of ZF, Germany)
- Hella GmbH & Co. KGaA (Germany)
- Smart Eye AB (Sweden)
- Seeing Machines Ltd. (Australia)
- Panasonic Corporation (Japan)
- Hyundai Mobis Co., Ltd. (South Korea)
- Tobii AB (Sweden)
- Faurecia S.A. (France)
- Visteon Corporation (USA)
- Harman International Industries, Inc. (USA, part of Samsung)
- Aptiv PLC (Ireland/USA)
- Gentex Corporation (USA)
- ZF Friedrichshafen AG (Germany)
Recent Development
- In September 2025, Seeing Machines announced that its Driver Monitoring System (DMS) technology had gained the capability to detect non-drowsy driver impairments, including alcohol-related impairment. Already deployed in over 3.7 million cars and 60,000 trucks, the system had previously addressed distracted and drowsy driving. Following extensive research, development, and testing, it was now able to identify alcohol impairment at levels meeting European NCAP standards, enhancing road safety and expanding its real-time driver monitoring applications globally.
- In June 2025, Roadzen Inc. announced that its DrivebuddyAI platform had received a patent in India for its real-time driver drowsiness detection algorithm, which used AI and computer vision to identify driver fatigue through over 92 eye and facial cues. The technology aimed to improve road safety by providing instant alerts, reducing distraction-related accidents. The patent strengthened Roadzen’s global IP portfolio, supported compliance with India’s upcoming commercial vehicle safety regulations, and demonstrated notable accident reduction. @@@@
Frequently Asked Questions (FAQ) :
Q1. What are the main growth driving factors for this market?
The primary driver is the escalating global focus on road safety, particularly the alarming statistics related to accidents caused by driver fatigue. Governments and regulatory bodies, especially in North America and Europe, are enforcing stringent mandates for the integration of Advanced Driver Assistance Systems (ADAS), including drowsiness detection, in new vehicles. Furthermore, the advancement and affordability of AI-powered sensor technologies and their mandatory use in commercial vehicle fleets to reduce operational costs and liability are strongly propelling market expansion.
Q2. What are the main restraining factors for this market?
One significant restraining factor is the high initial cost associated with implementing sophisticated, multi-sensor drowsiness detection systems, which can limit adoption, especially in price-sensitive emerging markets. Another major challenge involves data privacy and ethical concerns, as the systems rely on constant, real-time biometric and facial monitoring. Consumers and regulators are concerned about the storage and security of this sensitive personal data, leading to public hesitation and complex compliance requirements like the GDPR in Europe.
Q3. Which segment is expected to witness high growth?
The Commercial Vehicle segment (including trucks, buses, and large fleets) is expected to witness the highest Compound Annual Growth Rate (CAGR). This is driven by strict government regulations for professional drivers and a strong push from fleet operators to enhance operational safety and efficiency. Drowsiness detection systems are essential for compliance, reducing costly accidents, minimizing insurance liability, and effectively managing driver hours-of-service, making it a non-negotiable investment for fleet managers.
Q4. Who are the top major players for this market?
The market is led by major automotive suppliers and technology firms specializing in in-cabin sensing and computer vision. Top major players include Robert Bosch GmbH, known for its comprehensive safety systems, Continental AG, which integrates these features into its broader automotive electronics portfolio, and Valeo. Other key innovators are semiconductor and software companies like Infineon Technologies (sensors) and Smart Eye, which specializes in AI-powered driver monitoring software.
Q5. Which country is the largest player?
North America, primarily driven by the United States, is often cited as the largest market in terms of revenue and early adoption of advanced safety features. This is due to stringent federal and state safety regulations, high consumer purchasing power that supports the uptake of advanced technology, and a massive commercial trucking industry heavily focused on fleet safety. However, the Asia-Pacific (APAC) region, led by countries like China and Japan, is the fastest-growing market due to rapid vehicle production and increasing domestic regulatory mandates.
List of Figures
Figure 1: Global Driver Real-time Drowsiness Detection System Market Revenue Breakdown (USD Billion, %) by Region, 2022 & 2029
Figure 2: Global Driver Real-time Drowsiness Detection System Market Value Share (%), By Segment 1, 2022 & 2029
Figure 3: Global Driver Real-time Drowsiness Detection System Market Forecast (USD Billion), by Sub-Segment 1, 2018-2029
Figure 4: Global Driver Real-time Drowsiness Detection System Market Forecast (USD Billion), by Sub-Segment 2, 2018-2029
Figure 5: Global Driver Real-time Drowsiness Detection System Market Value Share (%), By Segment 2, 2022 & 2029
Figure 6: Global Driver Real-time Drowsiness Detection System Market Forecast (USD Billion), by Sub-Segment 1, 2018-2029
Figure 7: Global Driver Real-time Drowsiness Detection System Market Forecast (USD Billion), by Sub-Segment 2, 2018-2029
Figure 8: Global Driver Real-time Drowsiness Detection System Market Forecast (USD Billion), by Sub-Segment 3, 2018-2029
Figure 9: Global Driver Real-time Drowsiness Detection System Market Forecast (USD Billion), by Others, 2018-2029
Figure 10: Global Driver Real-time Drowsiness Detection System Market Value Share (%), By Segment 3, 2022 & 2029
Figure 11: Global Driver Real-time Drowsiness Detection System Market Forecast (USD Billion), by Sub-Segment 1, 2018-2029
Figure 12: Global Driver Real-time Drowsiness Detection System Market Forecast (USD Billion), by Sub-Segment 2, 2018-2029
Figure 13: Global Driver Real-time Drowsiness Detection System Market Forecast (USD Billion), by Sub-Segment 3, 2018-2029
Figure 14: Global Driver Real-time Drowsiness Detection System Market Forecast (USD Billion), by Others, 2018-2029
Figure 15: Global Driver Real-time Drowsiness Detection System Market Value (USD Billion), by Region, 2022 & 2029
Figure 16: North America Driver Real-time Drowsiness Detection System Market Value Share (%), By Segment 1, 2022 & 2029
Figure 17: North America Driver Real-time Drowsiness Detection System Market Forecast (USD Billion), by Sub-Segment 1, 2018-2029
Figure 18: North America Driver Real-time Drowsiness Detection System Market Forecast (USD Billion), by Sub-Segment 2, 2018-2029
Figure 19: North America Driver Real-time Drowsiness Detection System Market Value Share (%), By Segment 2, 2022 & 2029
Figure 20: North America Driver Real-time Drowsiness Detection System Market Forecast (USD Billion), by Sub-Segment 1, 2018-2029
Figure 21: North America Driver Real-time Drowsiness Detection System Market Forecast (USD Billion), by Sub-Segment 2, 2018-2029
Figure 22: North America Driver Real-time Drowsiness Detection System Market Forecast (USD Billion), by Sub-Segment 3, 2018-2029
Figure 23: North America Driver Real-time Drowsiness Detection System Market Forecast (USD Billion), by Others, 2018-2029
Figure 24: North America Driver Real-time Drowsiness Detection System Market Value Share (%), By Segment 3, 2022 & 2029
Figure 25: North America Driver Real-time Drowsiness Detection System Market Forecast (USD Billion), by Sub-Segment 1, 2018-2029
Figure 26: North America Driver Real-time Drowsiness Detection System Market Forecast (USD Billion), by Sub-Segment 2, 2018-2029
Figure 27: North America Driver Real-time Drowsiness Detection System Market Forecast (USD Billion), by Sub-Segment 3, 2018-2029
Figure 28: North America Driver Real-time Drowsiness Detection System Market Forecast (USD Billion), by Others, 2018-2029
Figure 29: North America Driver Real-time Drowsiness Detection System Market Forecast (USD Billion), by U.S., 2018-2029
Figure 30: North America Driver Real-time Drowsiness Detection System Market Forecast (USD Billion), by Canada, 2018-2029
Figure 31: Latin America Driver Real-time Drowsiness Detection System Market Value Share (%), By Segment 1, 2022 & 2029
Figure 32: Latin America Driver Real-time Drowsiness Detection System Market Forecast (USD Billion), by Sub-Segment 1, 2018-2029
Figure 33: Latin America Driver Real-time Drowsiness Detection System Market Forecast (USD Billion), by Sub-Segment 2, 2018-2029
Figure 34: Latin America Driver Real-time Drowsiness Detection System Market Value Share (%), By Segment 2, 2022 & 2029
Figure 35: Latin America Driver Real-time Drowsiness Detection System Market Forecast (USD Billion), by Sub-Segment 1, 2018-2029
Figure 36: Latin America Driver Real-time Drowsiness Detection System Market Forecast (USD Billion), by Sub-Segment 2, 2018-2029
Figure 37: Latin America Driver Real-time Drowsiness Detection System Market Forecast (USD Billion), by Sub-Segment 3, 2018-2029
Figure 38: Latin America Driver Real-time Drowsiness Detection System Market Forecast (USD Billion), by Others, 2018-2029
Figure 39: Latin America Driver Real-time Drowsiness Detection System Market Value Share (%), By Segment 3, 2022 & 2029
Figure 40: Latin America Driver Real-time Drowsiness Detection System Market Forecast (USD Billion), by Sub-Segment 1, 2018-2029
Figure 41: Latin America Driver Real-time Drowsiness Detection System Market Forecast (USD Billion), by Sub-Segment 2, 2018-2029
Figure 42: Latin America Driver Real-time Drowsiness Detection System Market Forecast (USD Billion), by Sub-Segment 3, 2018-2029
Figure 43: Latin America Driver Real-time Drowsiness Detection System Market Forecast (USD Billion), by Others, 2018-2029
Figure 44: Latin America Driver Real-time Drowsiness Detection System Market Forecast (USD Billion), by Brazil, 2018-2029
Figure 45: Latin America Driver Real-time Drowsiness Detection System Market Forecast (USD Billion), by Mexico, 2018-2029
Figure 46: Latin America Driver Real-time Drowsiness Detection System Market Forecast (USD Billion), by Rest of Latin America, 2018-2029
Figure 47: Europe Driver Real-time Drowsiness Detection System Market Value Share (%), By Segment 1, 2022 & 2029
Figure 48: Europe Driver Real-time Drowsiness Detection System Market Forecast (USD Billion), by Sub-Segment 1, 2018-2029
Figure 49: Europe Driver Real-time Drowsiness Detection System Market Forecast (USD Billion), by Sub-Segment 2, 2018-2029
Figure 50: Europe Driver Real-time Drowsiness Detection System Market Value Share (%), By Segment 2, 2022 & 2029
Figure 51: Europe Driver Real-time Drowsiness Detection System Market Forecast (USD Billion), by Sub-Segment 1, 2018-2029
Figure 52: Europe Driver Real-time Drowsiness Detection System Market Forecast (USD Billion), by Sub-Segment 2, 2018-2029
Figure 53: Europe Driver Real-time Drowsiness Detection System Market Forecast (USD Billion), by Sub-Segment 3, 2018-2029
Figure 54: Europe Driver Real-time Drowsiness Detection System Market Forecast (USD Billion), by Others, 2018-2029
Figure 55: Europe Driver Real-time Drowsiness Detection System Market Value Share (%), By Segment 3, 2022 & 2029
Figure 56: Europe Driver Real-time Drowsiness Detection System Market Forecast (USD Billion), by Sub-Segment 1, 2018-2029
Figure 57: Europe Driver Real-time Drowsiness Detection System Market Forecast (USD Billion), by Sub-Segment 2, 2018-2029
Figure 58: Europe Driver Real-time Drowsiness Detection System Market Forecast (USD Billion), by Sub-Segment 3, 2018-2029
Figure 59: Europe Driver Real-time Drowsiness Detection System Market Forecast (USD Billion), by Others, 2018-2029
Figure 60: Europe Driver Real-time Drowsiness Detection System Market Forecast (USD Billion), by U.K., 2018-2029
Figure 61: Europe Driver Real-time Drowsiness Detection System Market Forecast (USD Billion), by Germany, 2018-2029
Figure 62: Europe Driver Real-time Drowsiness Detection System Market Forecast (USD Billion), by France, 2018-2029
Figure 63: Europe Driver Real-time Drowsiness Detection System Market Forecast (USD Billion), by Italy, 2018-2029
Figure 64: Europe Driver Real-time Drowsiness Detection System Market Forecast (USD Billion), by Spain, 2018-2029
Figure 65: Europe Driver Real-time Drowsiness Detection System Market Forecast (USD Billion), by Russia, 2018-2029
Figure 66: Europe Driver Real-time Drowsiness Detection System Market Forecast (USD Billion), by Rest of Europe, 2018-2029
Figure 67: Asia Pacific Driver Real-time Drowsiness Detection System Market Value Share (%), By Segment 1, 2022 & 2029
Figure 68: Asia Pacific Driver Real-time Drowsiness Detection System Market Forecast (USD Billion), by Sub-Segment 1, 2018-2029
Figure 69: Asia Pacific Driver Real-time Drowsiness Detection System Market Forecast (USD Billion), by Sub-Segment 2, 2018-2029
Figure 70: Asia Pacific Driver Real-time Drowsiness Detection System Market Value Share (%), By Segment 2, 2022 & 2029
Figure 71: Asia Pacific Driver Real-time Drowsiness Detection System Market Forecast (USD Billion), by Sub-Segment 1, 2018-2029
Figure 72: Asia Pacific Driver Real-time Drowsiness Detection System Market Forecast (USD Billion), by Sub-Segment 2, 2018-2029
Figure 73: Asia Pacific Driver Real-time Drowsiness Detection System Market Forecast (USD Billion), by Sub-Segment 3, 2018-2029
Figure 74: Asia Pacific Driver Real-time Drowsiness Detection System Market Forecast (USD Billion), by Others, 2018-2029
Figure 75: Asia Pacific Driver Real-time Drowsiness Detection System Market Value Share (%), By Segment 3, 2022 & 2029
Figure 76: Asia Pacific Driver Real-time Drowsiness Detection System Market Forecast (USD Billion), by Sub-Segment 1, 2018-2029
Figure 77: Asia Pacific Driver Real-time Drowsiness Detection System Market Forecast (USD Billion), by Sub-Segment 2, 2018-2029
Figure 78: Asia Pacific Driver Real-time Drowsiness Detection System Market Forecast (USD Billion), by Sub-Segment 3, 2018-2029
Figure 79: Asia Pacific Driver Real-time Drowsiness Detection System Market Forecast (USD Billion), by Others, 2018-2029
Figure 80: Asia Pacific Driver Real-time Drowsiness Detection System Market Forecast (USD Billion), by China, 2018-2029
Figure 81: Asia Pacific Driver Real-time Drowsiness Detection System Market Forecast (USD Billion), by India, 2018-2029
Figure 82: Asia Pacific Driver Real-time Drowsiness Detection System Market Forecast (USD Billion), by Japan, 2018-2029
Figure 83: Asia Pacific Driver Real-time Drowsiness Detection System Market Forecast (USD Billion), by Australia, 2018-2029
Figure 84: Asia Pacific Driver Real-time Drowsiness Detection System Market Forecast (USD Billion), by Southeast Asia, 2018-2029
Figure 85: Asia Pacific Driver Real-time Drowsiness Detection System Market Forecast (USD Billion), by Rest of Asia Pacific, 2018-2029
Figure 86: Middle East & Africa Driver Real-time Drowsiness Detection System Market Value Share (%), By Segment 1, 2022 & 2029
Figure 87: Middle East & Africa Driver Real-time Drowsiness Detection System Market Forecast (USD Billion), by Sub-Segment 1, 2018-2029
Figure 88: Middle East & Africa Driver Real-time Drowsiness Detection System Market Forecast (USD Billion), by Sub-Segment 2, 2018-2029
Figure 89: Middle East & Africa Driver Real-time Drowsiness Detection System Market Value Share (%), By Segment 2, 2022 & 2029
Figure 90: Middle East & Africa Driver Real-time Drowsiness Detection System Market Forecast (USD Billion), by Sub-Segment 1, 2018-2029
Figure 91: Middle East & Africa Driver Real-time Drowsiness Detection System Market Forecast (USD Billion), by Sub-Segment 2, 2018-2029
Figure 92: Middle East & Africa Driver Real-time Drowsiness Detection System Market Forecast (USD Billion), by Sub-Segment 3, 2018-2029
Figure 93: Middle East & Africa Driver Real-time Drowsiness Detection System Market Forecast (USD Billion), by Others, 2018-2029
Figure 94: Middle East & Africa Driver Real-time Drowsiness Detection System Market Value Share (%), By Segment 3, 2022 & 2029
Figure 95: Middle East & Africa Driver Real-time Drowsiness Detection System Market Forecast (USD Billion), by Sub-Segment 1, 2018-2029
Figure 96: Middle East & Africa Driver Real-time Drowsiness Detection System Market Forecast (USD Billion), by Sub-Segment 2, 2018-2029
Figure 97: Middle East & Africa Driver Real-time Drowsiness Detection System Market Forecast (USD Billion), by Sub-Segment 3, 2018-2029
Figure 98: Middle East & Africa Driver Real-time Drowsiness Detection System Market Forecast (USD Billion), by Others, 2018-2029
Figure 99: Middle East & Africa Driver Real-time Drowsiness Detection System Market Forecast (USD Billion), by GCC, 2018-2029
Figure 100: Middle East & Africa Driver Real-time Drowsiness Detection System Market Forecast (USD Billion), by South Africa, 2018-2029
Figure 101: Middle East & Africa Driver Real-time Drowsiness Detection System Market Forecast (USD Billion), by Rest of Middle East & Africa, 2018-2029
List of Tables
Table 1: Global Driver Real-time Drowsiness Detection System Market Revenue (USD Billion) Forecast, by Segment 1, 2018-2029
Table 2: Global Driver Real-time Drowsiness Detection System Market Revenue (USD Billion) Forecast, by Segment 2, 2018-2029
Table 3: Global Driver Real-time Drowsiness Detection System Market Revenue (USD Billion) Forecast, by Segment 3, 2018-2029
Table 4: Global Driver Real-time Drowsiness Detection System Market Revenue (USD Billion) Forecast, by Region, 2018-2029
Table 5: North America Driver Real-time Drowsiness Detection System Market Revenue (USD Billion) Forecast, by Segment 1, 2018-2029
Table 6: North America Driver Real-time Drowsiness Detection System Market Revenue (USD Billion) Forecast, by Segment 2, 2018-2029
Table 7: North America Driver Real-time Drowsiness Detection System Market Revenue (USD Billion) Forecast, by Segment 3, 2018-2029
Table 8: North America Driver Real-time Drowsiness Detection System Market Revenue (USD Billion) Forecast, by Country, 2018-2029
Table 9: Europe Driver Real-time Drowsiness Detection System Market Revenue (USD Billion) Forecast, by Segment 1, 2018-2029
Table 10: Europe Driver Real-time Drowsiness Detection System Market Revenue (USD Billion) Forecast, by Segment 2, 2018-2029
Table 11: Europe Driver Real-time Drowsiness Detection System Market Revenue (USD Billion) Forecast, by Segment 3, 2018-2029
Table 12: Europe Driver Real-time Drowsiness Detection System Market Revenue (USD Billion) Forecast, by Country, 2018-2029
Table 13: Latin America Driver Real-time Drowsiness Detection System Market Revenue (USD Billion) Forecast, by Segment 1, 2018-2029
Table 14: Latin America Driver Real-time Drowsiness Detection System Market Revenue (USD Billion) Forecast, by Segment 2, 2018-2029
Table 15: Latin America Driver Real-time Drowsiness Detection System Market Revenue (USD Billion) Forecast, by Segment 3, 2018-2029
Table 16: Latin America Driver Real-time Drowsiness Detection System Market Revenue (USD Billion) Forecast, by Country, 2018-2029
Table 17: Asia Pacific Driver Real-time Drowsiness Detection System Market Revenue (USD Billion) Forecast, by Segment 1, 2018-2029
Table 18: Asia Pacific Driver Real-time Drowsiness Detection System Market Revenue (USD Billion) Forecast, by Segment 2, 2018-2029
Table 19: Asia Pacific Driver Real-time Drowsiness Detection System Market Revenue (USD Billion) Forecast, by Segment 3, 2018-2029
Table 20: Asia Pacific Driver Real-time Drowsiness Detection System Market Revenue (USD Billion) Forecast, by Country, 2018-2029
Table 21: Middle East & Africa Driver Real-time Drowsiness Detection System Market Revenue (USD Billion) Forecast, by Segment 1, 2018-2029
Table 22: Middle East & Africa Driver Real-time Drowsiness Detection System Market Revenue (USD Billion) Forecast, by Segment 2, 2018-2029
Table 23: Middle East & Africa Driver Real-time Drowsiness Detection System Market Revenue (USD Billion) Forecast, by Segment 3, 2018-2029
Table 24: Middle East & Africa Driver Real-time Drowsiness Detection System Market Revenue (USD Billion) Forecast, by Country, 2018-2029
Research Process
Data Library Research are conducted by industry experts who offer insight on
industry structure, market segmentations technology assessment and competitive landscape (CL), and penetration, as well as on emerging trends. Their analysis is based on primary interviews (~ 80%) and secondary research (~ 20%) as well as years of professional expertise in their respective industries. Adding to this, by analysing historical trends and current market positions, our analysts predict where the market will be headed for the next five years. Furthermore, the varying trends of segment & categories geographically presented are also studied and the estimated based on the primary & secondary research.
In this particular report from the supply side Data Library Research has conducted primary surveys (interviews) with the key level executives (VP, CEO’s, Marketing Director, Business Development Manager
and SOFT) of the companies that active & prominent as well as the midsized organization
FIGURE 1: DLR RESEARH PROCESS
![research-methodology1]()
Primary Research
Extensive primary research was conducted to gain a deeper insight of the market and industry performance. The analysis is based on both primary and secondary research as well as years of professional expertise in the respective industries.
In addition to analysing current and historical trends, our analysts predict where the market is headed over the next five years.
It varies by segment for these categories geographically presented in the list of market tables. Speaking about this particular report we have conducted primary surveys (interviews) with the key level executives (VP, CEO’s, Marketing Director, Business Development Manager and many more) of the major players active in the market.
Secondary Research
Secondary research was mainly used to collect and identify information useful for the extensive, technical, market-oriented, and Friend’s study of the Global Extra Neutral Alcohol. It was also used to obtain key information about major players, market classification and segmentation according to the industry trends, geographical markets, and developments related to the market and technology perspectives. For this study, analysts have gathered information from various credible sources, such as annual reports, sec filings, journals, white papers, SOFT presentations, and company web sites.
Market Size Estimation
Both, top-down and bottom-up approaches were used to estimate and validate the size of the Global market and to estimate the size of various other dependent submarkets in the overall Extra Neutral Alcohol. The key players in the market were identified through secondary research and their market contributions in the respective geographies were determined through primary and secondary research.
Forecast Model
![research-methodology2]()