Drug Based On Gene Therapy Market Overview and Analysis

The Global Drug Based on Gene Therapy Market was valued at approximately USD 11.76 billion in 2025 and is projected to grow at a compound annual growth rate (CAGR) of around 17.21% from 2025 to 2032, reaching USD 32.5 billion by 2032.

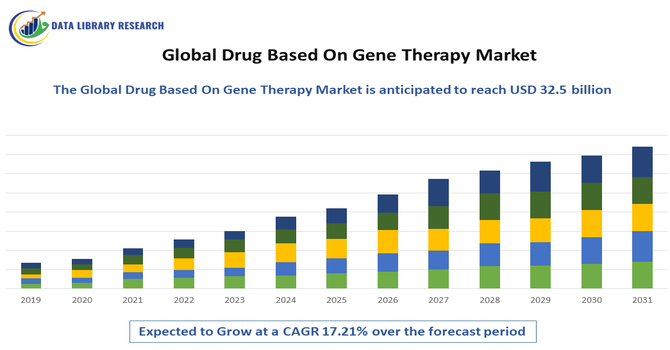
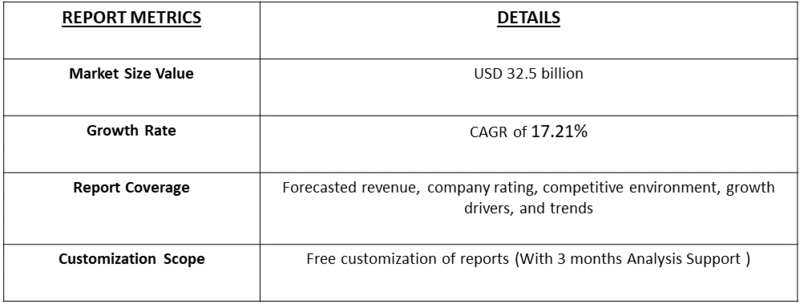
The global drug-based gene therapy market involves developing and commercializing gene-targeted treatments for genetic, rare, and chronic diseases, driven by innovation, rising disease prevalence, regulatory support, and growing demand for personalized therapies. The Global Drug Based on Gene Therapy Market is witnessing rapid growth, driven by significant advancements in genetic medicine, increased regulatory approvals, and growing investments in research and development. Gene therapies, which involve introducing, removing, or altering genetic material within a patient’s cells, offer potential cures for previously untreatable conditions such as certain cancers, inherited retinal diseases, and rare genetic disorders. The rising prevalence of these conditions, coupled with the limitations of conventional therapies, has accelerated the adoption of gene-based treatments.

Drug Based On Gene Therapy Market Latest Trends

The global gene therapy market is experiencing transformative advancements, marked by several key trends shaping its trajectory. Notably, the adoption of next-generation CRISPR technologies, such as CRISPR 2.0, is enhancing the precision and efficiency of gene editing, thereby expanding the range of treatable genetic disorders. Additionally, the development of innovative delivery platforms, exemplified by Soufflé Therapeutics' antibody-guided gene delivery system, is improving the targeted delivery of genetic medicines, particularly for complex diseases like facioscapulohumeral muscular dystrophy Regulatory progress is also evident, with recent approvals such as Zevaskyn for recessive dystrophic epidermolysis bullosa in the U.S. and mNexspike for COVID-19 in China, reflecting a growing acceptance of gene therapies across various indications. On the investment front, major pharmaceutical companies are increasingly acquiring gene-editing firms to bolster their pipelines; for instance, Eli Lilly's acquisition of Verve Therapeutics aims to advance CRISPR-based therapies targeting cardiovascular diseases.

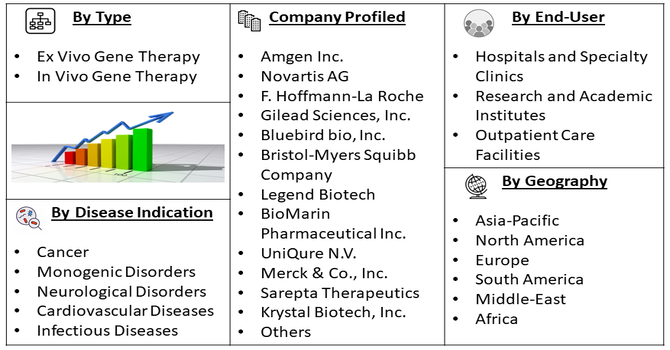
Segmentation: Global Drug Based On Gene Therapy Market is segmented By Therapy Type (Ex Vivo Gene Therapy, In Vivo Gene Therapy), Disease Indication (Cancer, Monogenic Disorders, Neurological Disorders, Cardiovascular Diseases, Infectious Diseases), End-User (Hospitals and Specialty Clinics, Research and Academic Institutes, Outpatient Care Facilities), and Geography (North America, Europe, Asia-Pacific, Middle East and Africa, and South America). The report provides the value (in USD million) for the above segments.

Market Drivers:

  • Rising Prevalence of Genetic Disorders and Cancer

The increasing global incidence of genetic diseases, rare inherited disorders, and various cancers is driving the demand for gene therapy. Traditional treatments often provide only symptomatic relief, whereas gene therapies offer potential curative solutions, creating strong adoption among healthcare providers and patients. For instance, in April, 2025, researchers at the Icahn School of Medicine at Mount Sinai and collaborators in Europe identified mutations in the non-coding gene RNU2-2 as a new cause of neurodevelopmental disorders, building on their previous discovery of RNU4-2/ReNU syndrome. This finding highlighted the role of small non-coding genes in disease and offered hope for affected families. The discovery underscored the rising prevalence of genetic disorders, driving demand for gene-based therapies and expanding the global drug-based gene therapy market.

Similarly, in 2025, the American Cancer Society projected 2,041,910 new cancer cases and 618,120 cancer-related deaths in the United States. This rising cancer burden is expected to significantly drive growth in the global drug-based gene therapy market, particularly in the oncology segment. Increasing incidence and mortality rates are likely to accelerate demand for innovative, targeted gene therapies, promote research and development of novel treatments, and expand market opportunities as healthcare systems seek more effective, personalized approaches to manage and treat cancer worldwide.

  • Advancements in Gene Editing and Delivery Technologies

Technological innovations, including CRISPR-Cas9, TALENs, and improved viral and non-viral delivery systems, have enhanced the precision, safety, and efficacy of gene therapies. These advancements allow for targeted treatment of complex conditions, boosting clinical adoption and expanding the therapeutic pipeline.For instance, in December 2024, Editas Medicine announced its strategic transition to focus on in vivo CRISPR-based gene editing, achieving preclinical proof of concept in humanized mice and non-human primates. The shift, including ending reni-cel development, highlighted advancements in targeted therapies, positively impacting the global gene therapy market by accelerating innovation and clinical adoption. Similarly, in April 2025, a new gene-editing tool, ‘STITCHR,’ showed promise for treating diseases with multiple mutations. The RNA-based system replaced entire genes, providing a practical and cost-effective innovation that overcame limitations of existing gene-editing technologies.

Market Restraints:

  • High Treatment Costs

High treatment costs remain a major barrier, limiting accessibility for patients, especially in low- and middle-income countries. Complex manufacturing processes, stringent regulatory requirements, and the need for specialized infrastructure for storage, handling, and administration also pose significant challenges. Additionally, potential safety concerns, such as immune reactions, off-target effects, and long-term unknown outcomes, can slow adoption by healthcare providers. Limited awareness among patients and physicians in emerging markets further restricts market penetration, while reimbursement and insurance coverage issues continue to hinder widespread use of gene therapies.

Socio Economic Impact on Drug Based On Gene Therapy Market

The Global Drug-Based Gene Therapy Market has significant socio-economic implications by providing innovative, targeted treatments for genetic disorders, rare diseases, and certain cancers, greatly improving patient outcomes and quality of life. By addressing conditions that were previously untreatable or poorly managed, these therapies reduce long-term healthcare costs, lower hospitalization rates, and minimize the need for chronic interventions. The market also drives substantial investment in biotechnology research and development, creating high-skilled employment opportunities across clinical, manufacturing, and regulatory sectors. Furthermore, increased access to gene therapies strengthens healthcare infrastructure, promotes equitable treatment across regions, and contributes to sustainable economic growth in both developed and emerging markets.

Segmental Analysis:

  • Cancer segment is expected to witness highest growth over the forecast period

The Cancer segment dominates the market due to the high prevalence of oncology-related genetic disorders and the growing need for targeted therapies. Gene therapies in oncology are increasingly being utilized to modulate immune responses, repair mutated genes, and enhance the effectiveness of existing treatments like chemotherapy. The rising number of cancer cases globally, combined with technological innovations in gene therapy, is fueling growth in this segment.

In 2025, the MDPI Journal reported a steady rise in new cancer cases, projected to reach 248,700 in 2026, up from 244,000 in 2022, with male incidence rates increasing to 602.3 per 100,000 and female rates slightly declining to 530.6. This growing cancer burden is expected to drive the highest growth in the oncology segment of the global drug-based gene therapy market, as demand for innovative, targeted therapies intensifies. Rising incidence rates are likely to accelerate research, development, and adoption of gene-based treatments, expanding market opportunities and reinforcing the need for effective, personalized therapeutic solutions worldwide.

  • Hospitals and Specialty Clinics segment is expected to witness highest growth over the forecast period

Hospitals and Specialty Clinics represent the largest and fastest-growing end-user segment. This is due to the specialized infrastructure, trained personnel, and controlled environments required for the administration and monitoring of gene therapies. Hospitals also play a critical role in patient follow-up, management of potential side effects, and integration with broader treatment protocols, making them the primary point of care for gene therapy administration.

  • North America region is expected to witness highest growth over the forecast period

North America is expected to dominate the market geographically, driven by a high prevalence of genetic disorders and cancer, advanced healthcare infrastructure, and favorable regulatory frameworks.

The region benefits from strong R&D investment, the presence of leading gene therapy developers, and well-established reimbursement policies, which collectively facilitate market growth. For instance, in September 2025, Sanofi’s investigational one-time intravitreal gene therapy, SAR402663, received Fast Track designation from the U.S. Food and Drug Administration for the treatment of neovascular (wet) age-related macular degeneration (AMD), a condition affecting over one million Americans and causing significant vision loss. The designation aimed to accelerate the development and review of this therapy, addressing a critical unmet medical need. This recognition reinforced Sanofi’s presence in the North American gene therapy market and highlighted growing investment in ophthalmic gene therapies. It also stimulated regional market growth by encouraging innovation, expediting regulatory pathways, and enhancing patient access to advanced gene-based treatments.

Increasing awareness among patients and government strategies, couples with healthcare providers regarding the benefits of gene therapy further strengthens the adoption of these advanced treatments in the region. For instance, in March, 2023, the Government of Canada launched the first phase of the National Strategy for Drugs for Rare Diseases to improve access and affordability of effective treatments for patients across the country. The strategy focused on supporting patient outcomes, investing in innovation, promoting national consistency, and leveraging evidence. Bilateral funding agreements with provinces and territories were developed, and funding was provided to Indigenous Services Canada’s Non-Insured Health Benefits Program for eligible First Nations and Inuit patients. The Implementation Advisory Group was established to ensure a patient-centered rollout. This initiative strengthened Canada’s response to its high prevalence of genetic disorders and stimulated growth in the global drug-based gene therapy market by fostering innovation and broader access.

Drug Based On Gene Therapy Market Competitive Landscape

The global gene therapy market is characterized by a dynamic and competitive landscape, featuring a mix of established pharmaceutical giants, innovative biotech firms, and emerging startups. These companies are at the forefront of developing and commercializing gene-based therapies across various therapeutic areas, including oncology, rare genetic disorders, cardiovascular diseases, and neurological conditions. Market growth is being driven by increasing prevalence of genetic and rare diseases, rising investment in research and development, and technological advancements in delivery vectors such as adeno-associated viruses (AAV) and lentiviruses. Strategic partnerships, mergers, and licensing agreements are further accelerating product pipelines and expanding global reach. However, challenges such as high therapy costs, complex regulatory requirements, and safety concerns continue to influence market dynamics, prompting companies to focus on innovation, risk management, and scalable manufacturing solutions to meet the growing demand for effective and accessible gene-based treatments.

The 20 major players for this market are:

  • Amgen Inc.
  • Novartis AG
  • F. Hoffmann-La Roche
  • Gilead Sciences, Inc.
  • Bluebird bio, Inc.
  • Bristol-Myers Squibb Company
  • Legend Biotech
  • BioMarin Pharmaceutical Inc.
  • UniQure N.V.
  • Merck & Co., Inc.
  • Sarepta Therapeutics, Inc.
  • Krystal Biotech, Inc.
  • CRISPR Therapeutics AG
  • Beam Therapeutics Inc.
  • Intellia Therapeutics, Inc.
  • Autolus Therapeutics plc
  • Kite Pharma (a Gilead Company)
  • Allogene Therapeutics, Inc.
  • Arcellx, Inc.
  • Sangamo Therapeutics, Inc.

Recent Development

  • In October 2025, Taysha Gene Therapies, Inc., a clinical-stage biotechnology company focused on AAV-based gene therapies for severe monogenic CNS disorders, announced that the FDA granted Breakthrough Therapy designation to TSHA-102, an intrathecally delivered AAV9 therapy for Rett syndrome. The company also finalized agreement with the FDA on the REVEAL pivotal trial protocol and statistical analysis plan, supporting the upcoming Biologics License Application submission. This designation highlights the therapy’s potential to address unmet medical needs, reinforces regulatory confidence, and accelerates clinical development. Such advancements are expected to drive growth, investment, and innovation in the global drug-based gene therapy market.


  • In July 2025, The U.S. Food and Drug Administration (FDA) announced a clinical hold on Sarepta Therapeutics’ investigational gene therapy trials for limb-girdle muscular dystrophy following the occurrence of three deaths potentially associated with the products. The FDA cited new safety concerns, indicating that study participants were exposed to significant and unreasonable risks. In addition, Sarepta’s platform technology designation was revoked. This development is expected to impact the global gene therapy market by intensifying regulatory scrutiny, potentially delaying clinical programs, and affecting investor sentiment, highlighting the importance of stringent safety protocols and risk management in the advancement of gene-based therapeutic innovations.


Frequently Asked Questions (FAQ) :

Q1. What the main growth driving factors for this market?

The market is primarily driven by the rising prevalence of chronic and genetic diseases like cancer, rare disorders, and neurological conditions, which often lack effective conventional treatments. Significant advancements in gene editing technologies (e.g., CRISPR) and gene delivery systems (viral vectors), coupled with substantial investment in R&D by biotech and pharma companies, are accelerating the discovery and approval of new, curative-potential therapies.

Q2. What are the main restraining factors for this market?

Key restraints include the exceedingly high, one-time treatment cost of gene therapies, which creates significant payment and access challenges for healthcare systems and patients globally. Additionally, complex and stringent regulatory approval processes, ethical concerns related to genetic modification, and uncertainty about the long-term safety and durability of the therapeutic effects pose considerable hurdles to market expansion and widespread adoption.

Q3. Which segment is expected to witness high growth?

The Oncology (Cancer) therapeutic area is expected to witness remarkably high growth. The success of gene-based therapies like CAR T-cell therapy for blood cancers has validated the approach, leading to intense R&D and an expanding pipeline focused on more common cancers and solid tumors. Furthermore, therapies targeting Neurological Disorders and Rare Genetic Diseases also present significant growth potential due to high unmet medical need.

Q4. Who are the top major players for this market?

The market features a mix of large pharmaceutical companies and specialized biotech firms. Top major players include Novartis AG, known for its early FDA-approved gene therapy Zolgensma and strong global presence. Other leading companies are Biogen Inc., Roche (via Spark Therapeutics), Sarepta Therapeutics, Bluebird Bio, and gene-editing pioneers like CRISPR Therapeutics and Intellia Therapeutics.

Q5. Which country is the largest player?

North America, specifically the United States, is the largest player in the global gene therapy market. This dominance is due to a robust ecosystem comprising leading biotechnology and pharmaceutical companies, high R&D investment, well-established advanced healthcare infrastructure, and supportive, although stringent, regulatory frameworks like the FDA's accelerated approval pathways.

Drug Based On Gene Therapy MARKET STUDY GLOBAL MARKET ANALYSIS, INSIGHTS AND FORECAST, 2022-2029

    1. Introduction

    • 1.1. Research Scope
    • 1.2. Market Segmentation
    • 1.3. Research Methodology
    • 1.4. Definitions and Assumptions

    2. Executive Summary

      3. Market Dynamics

      • 3.1. Market Drivers
      • 3.2. Market Restraints
      • 3.3. Market Opportunities

      4. Key Insights

      • 4.1. Key Emerging Trends – For Major Countries
      • 4.2. Latest Technological Advancement
      • 4.3. Regulatory Landscape
      • 4.4. Industry SWOT Analysis
      • 4.5. Porters Five Forces Analysis

      5. Global Drug Based On Gene Therapy Market Analysis (USD Billion), Insights and Forecast, 2018-2029

      • 5.1. Key Findings / Summary
      • 5.2. Market Analysis, Insights and Forecast – By Segment 1
        • 5.2.1. Sub-Segment 1
        • 5.2.2. Sub-Segment 2
      • 5.3. Market Analysis, Insights and Forecast – By Segment 2
        • 5.3.1. Sub-Segment 1
        • 5.3.2. Sub-Segment 2
        • 5.3.3. Sub-Segment 3
        • 5.3.4. Others
      • 5.4. Market Analysis, Insights and Forecast – By Segment 3
        • 5.4.1. Sub-Segment 1
        • 5.4.2. Sub-Segment 2
        • 5.4.3. Sub-Segment 3
        • 5.4.4. Others
      • 5.5. Market Analysis, Insights and Forecast – By Region
        • 5.5.1. North America
        • 5.5.2. Latin America
        • 5.5.3. Europe
        • 5.5.4. Asia Pacific
        • 5.5.5. Middle East and Africa

      6. North America Drug Based On Gene Therapy Market Analysis (USD Billion), Insights and Forecast, 2018-2029

      • 6.1. Key Findings / Summary
      • 6.2. Market Analysis, Insights and Forecast – By Segment 1
        • 6.2.1. Sub-Segment 1
        • 6.2.2. Sub-Segment 2
      • 6.3. Market Analysis, Insights and Forecast – By Segment 2
        • 6.3.1. Sub-Segment 1
        • 6.3.2. Sub-Segment 2
        • 6.3.3. Sub-Segment 3
        • 6.3.4. Others
      • 6.4. Market Analysis, Insights and Forecast – By Segment 3
        • 6.4.1. Sub-Segment 1
        • 6.4.2. Sub-Segment 2
        • 6.4.3. Sub-Segment 3
        • 6.4.4. Others
      • 6.5. Market Analysis, Insights and Forecast – By Country
        • 6.5.1. U.S.
        • 6.5.2. Canada

      7. Latin America Drug Based On Gene Therapy Market Analysis (USD Billion), Insights and Forecast, 2018-2029

      • 7.1. Key Findings / Summary
      • 7.2. Market Analysis, Insights and Forecast – By Segment 1
        • 7.2.1. Sub-Segment 1
        • 7.2.2. Sub-Segment 2
      • 7.3. Market Analysis, Insights and Forecast – By Segment 2
        • 7.3.1. Sub-Segment 1
        • 7.3.2. Sub-Segment 2
        • 7.3.3. Sub-Segment 3
        • 7.3.4. Others
      • 7.4. Market Analysis, Insights and Forecast – By Segment 3
        • 7.4.1. Sub-Segment 1
        • 7.4.2. Sub-Segment 2
        • 7.4.3. Sub-Segment 3
        • 7.4.4. Others
      • 7.5. Insights and Forecast – By Country
        • 7.5.1. Brazil
        • 7.5.2. Mexico
        • 7.5.3. Rest of Latin America

      8. Europe Drug Based On Gene Therapy Market Analysis (USD Billion), Insights and Forecast, 2018-2029

      • 8.1. Key Findings / Summary
      • 8.2. Market Analysis, Insights and Forecast – By Segment 1
        • 8.2.1. Sub-Segment 1
        • 8.2.2. Sub-Segment 2
      • 8.3. Market Analysis, Insights and Forecast – By Segment 2
        • 8.3.1. Sub-Segment 1
        • 8.3.2. Sub-Segment 2
        • 8.3.3. Sub-Segment 3
        • 8.3.4. Others
      • 8.4. Market Analysis, Insights and Forecast – By Segment 3
        • 8.4.1. Sub-Segment 1
        • 8.4.2. Sub-Segment 2
        • 8.4.3. Sub-Segment 3
        • 8.4.4. Others
      • 8.5. Market Analysis, Insights and Forecast – By Country
        • 8.5.1. UK
        • 8.5.2. Germany
        • 8.5.3. France
        • 8.5.4. Italy
        • 8.5.5. Spain
        • 8.5.6. Russia
        • 8.5.7. Rest of Europe

      9. Asia Pacific Drug Based On Gene Therapy Market Analysis (USD Billion), Insights and Forecast, 2018-2029

      • 9.1. Key Findings / Summary
      • 9.2. Market Analysis, Insights and Forecast – By Segment 1
        • 9.2.1. Sub-Segment 1
        • 9.2.2. Sub-Segment 2
      • 9.3. Market Analysis, Insights and Forecast – By Segment 2
        • 9.3.1. Sub-Segment 1
        • 9.3.2. Sub-Segment 2
        • 9.3.3. Sub-Segment 3
        • 9.3.4. Others
      • 9.4. Market Analysis, Insights and Forecast – By Segment 3
        • 9.4.1. Sub-Segment 1
        • 9.4.2. Sub-Segment 2
        • 9.4.3. Sub-Segment 3
        • 9.4.4. Others
      • 9.5. Market Analysis, Insights and Forecast – By Country
        • 9.5.1. China
        • 9.5.2. India
        • 9.5.3. Japan
        • 9.5.4. Australia
        • 9.5.5. South East Asia
        • 9.5.6. Rest of Asia Pacific

      10. Middle East & Africa Drug Based On Gene Therapy Market Analysis (USD Billion), Insights and Forecast, 2018-2029

      • 10.1. Key Findings / Summary
      • 10.2. Market Analysis, Insights and Forecast – By Segment 1
        • 10.2.1. Sub-Segment 1
        • 10.2.2. Sub-Segment 2
      • 10.3. Market Analysis, Insights and Forecast – By Segment 2
        • 10.3.1. Sub-Segment 1
        • 10.3.2. Sub-Segment 2
        • 10.3.3. Sub-Segment 3
        • 10.3.4. Others
      • 10.4. Market Analysis, Insights and Forecast – By Segment 3
        • 10.4.1. Sub-Segment 1
        • 10.4.2. Sub-Segment 2
        • 10.4.3. Sub-Segment 3
        • 10.4.4. Others
      • 10.5. Market Analysis, Insights and Forecast – By Country
        • 10.5.1. GCC
        • 10.5.2. South Africa
        • 10.5.3. Rest of Middle East & Africa

      11. Competitive Analysis

      • 11.1. Company Market Share Analysis, 2018
      • 11.2. Key Industry Developments
      • 11.3. Company Profile
        • 11.3.1. Company 1
          • 11.3.1.1. Business Overview
          • 11.3.1.2. Segment 1 & Service Offering
          • 11.3.1.3. Overall Revenue
          • 11.3.1.4. Geographic Presence
          • 11.3.1.5. Recent Development
        *Similar details will be provided for the following companies
        • 11.3.2. Company 2
        • 11.3.3. Company 3
        • 11.3.4. Company 4
        • 11.3.5. Company 5
        • 11.3.6. Company 6
        • 11.3.7. Company 7
        • 11.3.8. Company 8
        • 11.3.9. Company 9
        • 11.3.10. Company 10
        • 11.3.11. Company 11
        • 11.3.12. Company 12
      List of Figures

      Figure 1: Global Drug Based On Gene Therapy Market Revenue Breakdown (USD Billion, %) by Region, 2022 & 2029
      Figure 2: Global Drug Based On Gene Therapy Market Value Share (%), By Segment 1, 2022 & 2029
      Figure 3: Global Drug Based On Gene Therapy Market Forecast (USD Billion), by Sub-Segment 1, 2018-2029
      Figure 4: Global Drug Based On Gene Therapy Market Forecast (USD Billion), by Sub-Segment 2, 2018-2029
      Figure 5: Global Drug Based On Gene Therapy Market Value Share (%), By Segment 2, 2022 & 2029
      Figure 6: Global Drug Based On Gene Therapy Market Forecast (USD Billion), by Sub-Segment 1, 2018-2029
      Figure 7: Global Drug Based On Gene Therapy Market Forecast (USD Billion), by Sub-Segment 2, 2018-2029
      Figure 8: Global Drug Based On Gene Therapy Market Forecast (USD Billion), by Sub-Segment 3, 2018-2029
      Figure 9: Global Drug Based On Gene Therapy Market Forecast (USD Billion), by Others, 2018-2029
      Figure 10: Global Drug Based On Gene Therapy Market Value Share (%), By Segment 3, 2022 & 2029
      Figure 11: Global Drug Based On Gene Therapy Market Forecast (USD Billion), by Sub-Segment 1, 2018-2029
      Figure 12: Global Drug Based On Gene Therapy Market Forecast (USD Billion), by Sub-Segment 2, 2018-2029
      Figure 13: Global Drug Based On Gene Therapy Market Forecast (USD Billion), by Sub-Segment 3, 2018-2029
      Figure 14: Global Drug Based On Gene Therapy Market Forecast (USD Billion), by Others, 2018-2029
      Figure 15: Global Drug Based On Gene Therapy Market Value (USD Billion), by Region, 2022 & 2029
      Figure 16: North America Drug Based On Gene Therapy Market Value Share (%), By Segment 1, 2022 & 2029
      Figure 17: North America Drug Based On Gene Therapy Market Forecast (USD Billion), by Sub-Segment 1, 2018-2029
      Figure 18: North America Drug Based On Gene Therapy Market Forecast (USD Billion), by Sub-Segment 2, 2018-2029
      Figure 19: North America Drug Based On Gene Therapy Market Value Share (%), By Segment 2, 2022 & 2029
      Figure 20: North America Drug Based On Gene Therapy Market Forecast (USD Billion), by Sub-Segment 1, 2018-2029
      Figure 21: North America Drug Based On Gene Therapy Market Forecast (USD Billion), by Sub-Segment 2, 2018-2029
      Figure 22: North America Drug Based On Gene Therapy Market Forecast (USD Billion), by Sub-Segment 3, 2018-2029
      Figure 23: North America Drug Based On Gene Therapy Market Forecast (USD Billion), by Others, 2018-2029
      Figure 24: North America Drug Based On Gene Therapy Market Value Share (%), By Segment 3, 2022 & 2029
      Figure 25: North America Drug Based On Gene Therapy Market Forecast (USD Billion), by Sub-Segment 1, 2018-2029
      Figure 26: North America Drug Based On Gene Therapy Market Forecast (USD Billion), by Sub-Segment 2, 2018-2029
      Figure 27: North America Drug Based On Gene Therapy Market Forecast (USD Billion), by Sub-Segment 3, 2018-2029
      Figure 28: North America Drug Based On Gene Therapy Market Forecast (USD Billion), by Others, 2018-2029
      Figure 29: North America Drug Based On Gene Therapy Market Forecast (USD Billion), by U.S., 2018-2029
      Figure 30: North America Drug Based On Gene Therapy Market Forecast (USD Billion), by Canada, 2018-2029
      Figure 31: Latin America Drug Based On Gene Therapy Market Value Share (%), By Segment 1, 2022 & 2029
      Figure 32: Latin America Drug Based On Gene Therapy Market Forecast (USD Billion), by Sub-Segment 1, 2018-2029
      Figure 33: Latin America Drug Based On Gene Therapy Market Forecast (USD Billion), by Sub-Segment 2, 2018-2029
      Figure 34: Latin America Drug Based On Gene Therapy Market Value Share (%), By Segment 2, 2022 & 2029
      Figure 35: Latin America Drug Based On Gene Therapy Market Forecast (USD Billion), by Sub-Segment 1, 2018-2029
      Figure 36: Latin America Drug Based On Gene Therapy Market Forecast (USD Billion), by Sub-Segment 2, 2018-2029
      Figure 37: Latin America Drug Based On Gene Therapy Market Forecast (USD Billion), by Sub-Segment 3, 2018-2029
      Figure 38: Latin America Drug Based On Gene Therapy Market Forecast (USD Billion), by Others, 2018-2029
      Figure 39: Latin America Drug Based On Gene Therapy Market Value Share (%), By Segment 3, 2022 & 2029
      Figure 40: Latin America Drug Based On Gene Therapy Market Forecast (USD Billion), by Sub-Segment 1, 2018-2029
      Figure 41: Latin America Drug Based On Gene Therapy Market Forecast (USD Billion), by Sub-Segment 2, 2018-2029
      Figure 42: Latin America Drug Based On Gene Therapy Market Forecast (USD Billion), by Sub-Segment 3, 2018-2029
      Figure 43: Latin America Drug Based On Gene Therapy Market Forecast (USD Billion), by Others, 2018-2029
      Figure 44: Latin America Drug Based On Gene Therapy Market Forecast (USD Billion), by Brazil, 2018-2029
      Figure 45: Latin America Drug Based On Gene Therapy Market Forecast (USD Billion), by Mexico, 2018-2029
      Figure 46: Latin America Drug Based On Gene Therapy Market Forecast (USD Billion), by Rest of Latin America, 2018-2029
      Figure 47: Europe Drug Based On Gene Therapy Market Value Share (%), By Segment 1, 2022 & 2029
      Figure 48: Europe Drug Based On Gene Therapy Market Forecast (USD Billion), by Sub-Segment 1, 2018-2029
      Figure 49: Europe Drug Based On Gene Therapy Market Forecast (USD Billion), by Sub-Segment 2, 2018-2029
      Figure 50: Europe Drug Based On Gene Therapy Market Value Share (%), By Segment 2, 2022 & 2029
      Figure 51: Europe Drug Based On Gene Therapy Market Forecast (USD Billion), by Sub-Segment 1, 2018-2029
      Figure 52: Europe Drug Based On Gene Therapy Market Forecast (USD Billion), by Sub-Segment 2, 2018-2029
      Figure 53: Europe Drug Based On Gene Therapy Market Forecast (USD Billion), by Sub-Segment 3, 2018-2029
      Figure 54: Europe Drug Based On Gene Therapy Market Forecast (USD Billion), by Others, 2018-2029
      Figure 55: Europe Drug Based On Gene Therapy Market Value Share (%), By Segment 3, 2022 & 2029
      Figure 56: Europe Drug Based On Gene Therapy Market Forecast (USD Billion), by Sub-Segment 1, 2018-2029
      Figure 57: Europe Drug Based On Gene Therapy Market Forecast (USD Billion), by Sub-Segment 2, 2018-2029
      Figure 58: Europe Drug Based On Gene Therapy Market Forecast (USD Billion), by Sub-Segment 3, 2018-2029
      Figure 59: Europe Drug Based On Gene Therapy Market Forecast (USD Billion), by Others, 2018-2029
      Figure 60: Europe Drug Based On Gene Therapy Market Forecast (USD Billion), by U.K., 2018-2029
      Figure 61: Europe Drug Based On Gene Therapy Market Forecast (USD Billion), by Germany, 2018-2029
      Figure 62: Europe Drug Based On Gene Therapy Market Forecast (USD Billion), by France, 2018-2029
      Figure 63: Europe Drug Based On Gene Therapy Market Forecast (USD Billion), by Italy, 2018-2029
      Figure 64: Europe Drug Based On Gene Therapy Market Forecast (USD Billion), by Spain, 2018-2029
      Figure 65: Europe Drug Based On Gene Therapy Market Forecast (USD Billion), by Russia, 2018-2029
      Figure 66: Europe Drug Based On Gene Therapy Market Forecast (USD Billion), by Rest of Europe, 2018-2029
      Figure 67: Asia Pacific Drug Based On Gene Therapy Market Value Share (%), By Segment 1, 2022 & 2029
      Figure 68: Asia Pacific Drug Based On Gene Therapy Market Forecast (USD Billion), by Sub-Segment 1, 2018-2029
      Figure 69: Asia Pacific Drug Based On Gene Therapy Market Forecast (USD Billion), by Sub-Segment 2, 2018-2029
      Figure 70: Asia Pacific Drug Based On Gene Therapy Market Value Share (%), By Segment 2, 2022 & 2029
      Figure 71: Asia Pacific Drug Based On Gene Therapy Market Forecast (USD Billion), by Sub-Segment 1, 2018-2029
      Figure 72: Asia Pacific Drug Based On Gene Therapy Market Forecast (USD Billion), by Sub-Segment 2, 2018-2029
      Figure 73: Asia Pacific Drug Based On Gene Therapy Market Forecast (USD Billion), by Sub-Segment 3, 2018-2029
      Figure 74: Asia Pacific Drug Based On Gene Therapy Market Forecast (USD Billion), by Others, 2018-2029
      Figure 75: Asia Pacific Drug Based On Gene Therapy Market Value Share (%), By Segment 3, 2022 & 2029
      Figure 76: Asia Pacific Drug Based On Gene Therapy Market Forecast (USD Billion), by Sub-Segment 1, 2018-2029
      Figure 77: Asia Pacific Drug Based On Gene Therapy Market Forecast (USD Billion), by Sub-Segment 2, 2018-2029
      Figure 78: Asia Pacific Drug Based On Gene Therapy Market Forecast (USD Billion), by Sub-Segment 3, 2018-2029
      Figure 79: Asia Pacific Drug Based On Gene Therapy Market Forecast (USD Billion), by Others, 2018-2029
      Figure 80: Asia Pacific Drug Based On Gene Therapy Market Forecast (USD Billion), by China, 2018-2029
      Figure 81: Asia Pacific Drug Based On Gene Therapy Market Forecast (USD Billion), by India, 2018-2029
      Figure 82: Asia Pacific Drug Based On Gene Therapy Market Forecast (USD Billion), by Japan, 2018-2029
      Figure 83: Asia Pacific Drug Based On Gene Therapy Market Forecast (USD Billion), by Australia, 2018-2029
      Figure 84: Asia Pacific Drug Based On Gene Therapy Market Forecast (USD Billion), by Southeast Asia, 2018-2029
      Figure 85: Asia Pacific Drug Based On Gene Therapy Market Forecast (USD Billion), by Rest of Asia Pacific, 2018-2029
      Figure 86: Middle East & Africa Drug Based On Gene Therapy Market Value Share (%), By Segment 1, 2022 & 2029
      Figure 87: Middle East & Africa Drug Based On Gene Therapy Market Forecast (USD Billion), by Sub-Segment 1, 2018-2029
      Figure 88: Middle East & Africa Drug Based On Gene Therapy Market Forecast (USD Billion), by Sub-Segment 2, 2018-2029
      Figure 89: Middle East & Africa Drug Based On Gene Therapy Market Value Share (%), By Segment 2, 2022 & 2029
      Figure 90: Middle East & Africa Drug Based On Gene Therapy Market Forecast (USD Billion), by Sub-Segment 1, 2018-2029
      Figure 91: Middle East & Africa Drug Based On Gene Therapy Market Forecast (USD Billion), by Sub-Segment 2, 2018-2029
      Figure 92: Middle East & Africa Drug Based On Gene Therapy Market Forecast (USD Billion), by Sub-Segment 3, 2018-2029
      Figure 93: Middle East & Africa Drug Based On Gene Therapy Market Forecast (USD Billion), by Others, 2018-2029
      Figure 94: Middle East & Africa Drug Based On Gene Therapy Market Value Share (%), By Segment 3, 2022 & 2029
      Figure 95: Middle East & Africa Drug Based On Gene Therapy Market Forecast (USD Billion), by Sub-Segment 1, 2018-2029
      Figure 96: Middle East & Africa Drug Based On Gene Therapy Market Forecast (USD Billion), by Sub-Segment 2, 2018-2029
      Figure 97: Middle East & Africa Drug Based On Gene Therapy Market Forecast (USD Billion), by Sub-Segment 3, 2018-2029
      Figure 98: Middle East & Africa Drug Based On Gene Therapy Market Forecast (USD Billion), by Others, 2018-2029
      Figure 99: Middle East & Africa Drug Based On Gene Therapy Market Forecast (USD Billion), by GCC, 2018-2029
      Figure 100: Middle East & Africa Drug Based On Gene Therapy Market Forecast (USD Billion), by South Africa, 2018-2029
      Figure 101: Middle East & Africa Drug Based On Gene Therapy Market Forecast (USD Billion), by Rest of Middle East & Africa, 2018-2029 
      List of Tables
      Table 1: Global Drug Based On Gene Therapy Market Revenue (USD Billion) Forecast, by Segment 1, 2018-2029
      Table 2: Global Drug Based On Gene Therapy Market Revenue (USD Billion) Forecast, by Segment 2, 2018-2029
      Table 3: Global Drug Based On Gene Therapy Market Revenue (USD Billion) Forecast, by Segment 3, 2018-2029
      Table 4: Global Drug Based On Gene Therapy Market Revenue (USD Billion) Forecast, by Region, 2018-2029
      Table 5: North America Drug Based On Gene Therapy Market Revenue (USD Billion) Forecast, by Segment 1, 2018-2029
      Table 6: North America Drug Based On Gene Therapy Market Revenue (USD Billion) Forecast, by Segment 2, 2018-2029
      Table 7: North America Drug Based On Gene Therapy Market Revenue (USD Billion) Forecast, by Segment 3, 2018-2029
      Table 8: North America Drug Based On Gene Therapy Market Revenue (USD Billion) Forecast, by Country, 2018-2029
      Table 9: Europe Drug Based On Gene Therapy Market Revenue (USD Billion) Forecast, by Segment 1, 2018-2029
      Table 10: Europe Drug Based On Gene Therapy Market Revenue (USD Billion) Forecast, by Segment 2, 2018-2029
      Table 11: Europe Drug Based On Gene Therapy Market Revenue (USD Billion) Forecast, by Segment 3, 2018-2029
      Table 12: Europe Drug Based On Gene Therapy Market Revenue (USD Billion) Forecast, by Country, 2018-2029
      Table 13: Latin America Drug Based On Gene Therapy Market Revenue (USD Billion) Forecast, by Segment 1, 2018-2029
      Table 14: Latin America Drug Based On Gene Therapy Market Revenue (USD Billion) Forecast, by Segment 2, 2018-2029
      Table 15: Latin America Drug Based On Gene Therapy Market Revenue (USD Billion) Forecast, by Segment 3, 2018-2029
      Table 16: Latin America Drug Based On Gene Therapy Market Revenue (USD Billion) Forecast, by Country, 2018-2029
      Table 17: Asia Pacific Drug Based On Gene Therapy Market Revenue (USD Billion) Forecast, by Segment 1, 2018-2029
      Table 18: Asia Pacific Drug Based On Gene Therapy Market Revenue (USD Billion) Forecast, by Segment 2, 2018-2029
      Table 19: Asia Pacific Drug Based On Gene Therapy Market Revenue (USD Billion) Forecast, by Segment 3, 2018-2029
      Table 20: Asia Pacific Drug Based On Gene Therapy Market Revenue (USD Billion) Forecast, by Country, 2018-2029
      Table 21: Middle East & Africa Drug Based On Gene Therapy Market Revenue (USD Billion) Forecast, by Segment 1, 2018-2029
      Table 22: Middle East & Africa Drug Based On Gene Therapy Market Revenue (USD Billion) Forecast, by Segment 2, 2018-2029
      Table 23: Middle East & Africa Drug Based On Gene Therapy Market Revenue (USD Billion) Forecast, by Segment 3, 2018-2029
      Table 24: Middle East & Africa Drug Based On Gene Therapy Market Revenue (USD Billion) Forecast, by Country, 2018-2029
      Research Process

      Data Library Research are conducted by industry experts who offer insight on industry structure, market segmentations technology assessment and competitive landscape (CL), and penetration, as well as on emerging trends. Their analysis is based on primary interviews (~ 80%) and secondary research (~ 20%) as well as years of professional expertise in their respective industries. Adding to this, by analysing historical trends and current market positions, our analysts predict where the market will be headed for the next five years. Furthermore, the varying trends of segment & categories geographically presented are also studied and the estimated based on the primary & secondary research.

      In this particular report from the supply side Data Library Research has conducted primary surveys (interviews) with the key level executives (VP, CEO’s, Marketing Director, Business Development Manager and SOFT) of the companies that active & prominent as well as the midsized organization

      FIGURE 1: DLR RESEARH PROCESS

      research-methodology1

      Primary Research

      Extensive primary research was conducted to gain a deeper insight of the market and industry performance. The analysis is based on both primary and secondary research as well as years of professional expertise in the respective industries.

      In addition to analysing current and historical trends, our analysts predict where the market is headed over the next five years.

      It varies by segment for these categories geographically presented in the list of market tables. Speaking about this particular report we have conducted primary surveys (interviews) with the key level executives (VP, CEO’s, Marketing Director, Business Development Manager and many more) of the major players active in the market.

      Secondary Research

      Secondary research was mainly used to collect and identify information useful for the extensive, technical, market-oriented, and Friend’s study of the Global Extra Neutral Alcohol. It was also used to obtain key information about major players, market classification and segmentation according to the industry trends, geographical markets, and developments related to the market and technology perspectives. For this study, analysts have gathered information from various credible sources, such as annual reports, sec filings, journals, white papers, SOFT presentations, and company web sites.

      Market Size Estimation

      Both, top-down and bottom-up approaches were used to estimate and validate the size of the Global market and to estimate the size of various other dependent submarkets in the overall Extra Neutral Alcohol. The key players in the market were identified through secondary research and their market contributions in the respective geographies were determined through primary and secondary research.

      Forecast Model

      research-methodology2

      Happy to Assist You

      If you have a question?

      info@datalibraryresearch.com

      IND : +91 955 279 0357

      Browse Related Reports