E-contract Signing Platform Market Overview and Analysis
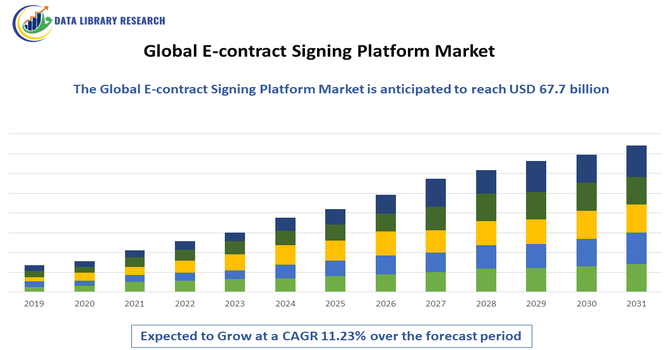
- The global Digital Signature Market, which includes E-contract Signing Platforms, is experiencing rapid growth, generally valued around USD 8.9 billion in 2025 and is projected to reach approximately USD 67.7 billion by 2032, growing with a Compound Annual Growth Rate (CAGR) of 11.23% from 2025 to 2032.
Get Complete Analysis Of The Report - Download Updated Free Sample PDF
Growth in the Global E-Contract Signing Platform Market is primarily driven by the accelerating digital transformation across enterprises, coupled with the increasing need for faster, secure, and legally compliant contract management processes. The shift toward remote work and cloud-based operations has further fueled demand for electronic signature platforms that enable seamless collaboration and instant contract execution. Additionally, stringent regulatory compliance requirements, including e-signature laws such as eIDAS, ESIGN, and UETA, are encouraging adoption of trusted digital signing solutions worldwide, driving market growth.
E-contract Signing Platform Market Latest Trends
Key recent trends in the Global E Contract Signing Platform Market reflect rapid evolution driven by technological innovation, regulatory support, and broadening adoption beyond traditional office environments. Platforms are increasingly integrating artificial intelligence (AI) and blockchain to enhance security, automate contract analysis, and provide immutable audit trails—a shift helping businesses manage risk and compliance more efficiently. Enhanced cloud-based, mobile-first solutions are enabling remote and hybrid workforces to execute contracts securely from anywhere, reducing turnaround time. Additionally, SMEs and enterprises alike are embedding e-signature capabilities into broader digital workflows and enterprise systems (CRM/ERP), expanding use cases across finance, healthcare, and legal sectors.
Segmentation: Global E-contract Signing Platform Market is segmented By Deployment Type (Cloud-Based Platforms, On-Premises Platforms), Organization Size (Small & Medium Enterprises, Large Enterprises), End-User (Healthcare & Life Sciences, Real Estate & Construction, Legal Services), Application (Sales & Purchase Agreements, HR & Employee Contracts, Vendor & Supplier Agreements), and Geography (North America, Europe, Asia-Pacific, Middle East and Africa, and South America). The report provides the value (in USD million) for the above segments.

For Detailed Market Segmentation - Get a Free Sample PDF
Market Drivers:
- Growing Adoption of Digital Transformation and Remote Work
The increasing shift toward digital workflows and remote operations is a key driver for the e-contract signing platform market. Organizations across industries are seeking tools that streamline contract execution, reduce paperwork, and accelerate business processes. Remote work, accelerated by global events such as the COVID-19 pandemic, has made traditional in-person contract signing impractical, prompting widespread adoption of cloud-based e-signature solutions. These platforms allow employees, partners, and clients to securely sign and manage contracts from any location, improving operational efficiency and reducing turnaround times, which is crucial for maintaining competitive advantage in today’s fast-paced business environment.
- Regulatory Compliance and Legal Acceptance of E-Signatures
Stringent regulatory frameworks and legal recognition of electronic signatures are significantly boosting market growth. Laws such as ESIGN (Electronic Signatures in Global and National Commerce Act), UETA (Uniform Electronic Transactions Act), and eIDAS (Electronic Identification, Authentication, and Trust Services) provide legal validity to e-signatures, ensuring enforceability of digitally signed contracts. This regulatory support encourages organizations to adopt electronic contract signing solutions, particularly in highly regulated sectors like finance, healthcare, legal services, and government. Compliance with these standards not only mitigates legal risks but also enhances trust, making e-contract signing platforms a preferred choice for secure and efficient contract management.
Market Restraints:
- Data Security and Privacy Concerns
Despite strong demand for digital contract solutions, data security and privacy concerns remain a significant restraint. E contract signing platforms handle sensitive legal, financial, and personal information, making them attractive targets for cyberattacks such as data breaches, ransomware, and man in the middle intrusions. Organizations, especially in finance, healthcare, and government sectors, may hesitate to adopt fully digital contract workflows due to fears over inadequate encryption, insecure storage, or unauthorized access. Additionally, varying data protection and privacy regulations across regions (such as GDPR in Europe, HIPAA in the U.S., and evolving frameworks in APAC) complicate compliance, as global enterprises must ensure that e signature solutions meet multiple regulatory standards simultaneously. This can increase implementation costs and slow down adoption, particularly among risk-averse industries.
Socioeconomic Impact on E-contract Signing Platform Market
The Global E-Contract Signing Platform Market is experiencing significant growth due to increasing digital transformation across industries and rising adoption of cloud-based solutions. Organizations are shifting from manual paper-based contracts to secure, legally compliant electronic signing platforms to enhance efficiency, reduce operational costs, and ensure faster turnaround times. Growing demand in sectors such as finance, healthcare, legal, and IT, coupled with stringent regulatory requirements like ESIGN and eIDAS, drives adoption. Technological advancements, including API integration, mobile accessibility, and AI-powered contract management, further support market expansion. Increasing awareness of environmental sustainability and workflow automation positions the market for continued global growth.
Segmental Analysis:
- Cloud-Based Platforms segment is expected to witness the highest growth over the forecast period
Cloud-based e-contract signing platforms dominate the market due to their scalability, cost-effectiveness, and accessibility from anywhere with an internet connection. These platforms eliminate the need for on-premises infrastructure, allowing organizations to deploy solutions quickly and manage contracts remotely. Cloud deployment also enables real-time collaboration, automated workflow integration, and secure storage, making it ideal for businesses with distributed teams and frequent contract volumes. The rising adoption of cloud technologies across industries, combined with growing remote work trends, continues to fuel demand for cloud-based e-signature solutions.
- Large Enterprises segment is expected to witness the highest growth over the forecast period
Large enterprises are major adopters of e-contract signing platforms because they handle high volumes of complex contracts across multiple departments and geographies. These organizations require robust solutions capable of integrating with ERP, CRM, and document management systems, ensuring compliance with internal policies and regulatory standards. The efficiency, security, and auditability offered by e-contract platforms help large enterprises reduce turnaround time, minimize errors, and streamline approvals, which is critical for maintaining operational efficiency in global-scale business operations.
- Healthcare & Life Sciences segment is expected to witness the highest growth over the forecast period
Healthcare and life sciences organizations increasingly rely on e-contract signing platforms to manage sensitive agreements related to clinical trials, vendor contracts, and regulatory compliance. The need for secure, legally enforceable, and HIPAA-compliant electronic signatures is driving adoption in this sector. Additionally, the growth of telemedicine, remote patient services, and pharmaceutical partnerships has increased the need for fast and reliable contract execution, further supporting market expansion within healthcare and life sciences.
- HR & Employee Contracts segment is expected to witness the highest growth over the forecast period
HR and employee contract management represents a key application area, as organizations aim to digitize recruitment, onboarding, employment agreements, and policy acknowledgments. E-contract platforms enable HR teams to send, track, and store signed agreements efficiently while maintaining compliance with labor laws and data privacy regulations. Automation reduces administrative burdens, shortens onboarding cycles, and ensures accurate record-keeping, driving strong adoption across companies of all sizes.
- North America segment is expected to witness highest growth over the forecast period
North America leads the market due to its advanced digital infrastructure, high cloud adoption, and early regulatory recognition of electronic signatures (ESIGN and UETA). The presence of numerous large enterprises, technology-savvy SMEs, and stringent compliance requirements in sectors like finance, healthcare, and legal services drives the widespread deployment of e-contract signing solutions.
Also, the region benefits from continuous innovation by key platform providers, supporting growth and early adoption of advanced features such as AI-based contract analysis and secure cloud workflows. For instance, in June 2025, Syncfusion, Inc. announced that its BoldSign eSignature solution received the Postman Developer’s Choice Award, recognized for delivering outstanding user experience, business value, and strong community engagement. This accolade highlighted growing adoption of reliable digital signing tools, reinforcing North America’s E-Contract Signing Platform Market by boosting trust, credibility, and demand for advanced, developer-friendly e-signature solutions.
Additionally, increasing awareness of efficiency, cost savings, and environmental benefits associated with digital contracts further reinforces North America’s market dominance. Continuous innovation by key players, integration with enterprise platforms, and the growing emphasis on secure, legally compliant workflows ensure sustained adoption, solidifying the region’s leadership in the E-Contract Signing Platform Market.
| Report Matrics |
Details |
| Market Size Value |
USD 67.7 billion |
| Growth Rate |
CAGR of 11.23% |
| Forecast |
2026-2033 |
| Historical data |
2021-2024 |
| Base Year |
2025 |
| Report Coverage |
Forecasted revenue, company rating, competitive environment, growth drivers, and trends |
| Segment Coverage |
Type, Application, End-User, Geography |
| Regional Scope |
North America, Europe, Asia Pacific, Middle East |
| Customized scope |
Free customization of reports (With 3 months Analysis Support ) |
| To Learn More About This Report |
Request a Free Sample Copy |
E-contract Signing Platform Market Competitive Landscape
The competitive landscape of the Global E Contract Signing Platform Market is shaped by a dynamic mix of established technology leaders, innovative SaaS providers, and emerging regional players. Providers compete by enhancing platform security, compliance with global e signature laws (such as ESIGN, UETA, eIDAS), and seamless integration with enterprise applications like CRM, ERP, and document management systems. There is an increasing focus on AI driven contract workflows, advanced identity verification, audit trails, and cloud native deployment to support remote and hybrid business models. Both global players and agile niche vendors are expanding their offerings through strategic partnerships, product upgrades, and geographic expansion to capture rising demand across industries and regions.
Key Players:
- DocuSign
- Adobe Sign
- HelloSign
- PandaDoc
- SignNow
- OneSpan
- Zoho Sign
- Juro
- Conga
- eSignLive
- Formstack Sign
- Contractbook
- RightSignature
- SignRequest
- SignEasy
- Agiloft
- Ironclad
- Certinal
- Notarize
- CocoSign
Recent Development
- In September 2025, TRUESigner ONE, launched Contract Assist to streamline contract generation, e-stamping, and signing within the Indian context. The platform enabled real-time contract management via API integration with ERP, CRM, and legal systems, supported bulk contract creation, and offered advanced e-stamp management, simplifying agreement workflows and enhancing efficiency for businesses.
- In April 2025, DocuSign launched the industry’s first purpose-built AI contract agent, designed to accelerate workflows and reduce risk across the agreement lifecycle. The AI analyzed contracts in seconds, identified risks, and highlighted issues needing human review, transforming manual bottlenecks into efficient processes. This innovation streamlined operations and enhanced outcomes for organizations.
Frequently Asked Questions (FAQ) :
Q1. What are the main growth-driving factors for this market?
The key drivers are the global surge in remote work and digital transformation across industries, demanding paperless processes. Strong regulatory backing, like the eIDAS in Europe and ESIGN/UETA in the U.S., provides legal validity, while increasing concerns over data security also fuel adoption for verified, secure transactions.
Q2. What are the main restraining factors for this market?
Restraints include the high initial implementation costs for large enterprises and existing legal complexity, as e-signature regulations often differ significantly between countries. Furthermore, concerns regarding data security vulnerabilities and the high cost of integrating the platform with legacy systems can limit broader market penetration.
Q3. Which segment is expected to witness high growth?
The Cloud Deployment segment is anticipated to witness the highest growth due to its accessibility, scalability, and lower initial expense compared to on-premise solutions. Among end-users, the Healthcare and Life Sciences sector is projected to be the fastest-growing, driven by the massive digitization of patient and regulatory documents.
Q4. Who are the top major players for this market?
The market is currently dominated by key established technology firms. The top major players include DocuSign, Inc., which holds a significant market share, along with Adobe Inc., and cybersecurity specialists such as OneSpan, Thales S.A., and Entrust.
Q5. Which country is the largest player?
North America, particularly the United States, is the largest regional market by revenue share. This dominance is due to a highly established legal framework (ESIGN Act), the widespread presence of major industry players, and the early, mass adoption of cloud-based digital solutions across the financial and technology sectors.
List of Figures
Figure 1: Global E-contract Signing Platform Market Revenue Breakdown (USD Billion, %) by Region, 2022 & 2029
Figure 2: Global E-contract Signing Platform Market Value Share (%), By Segment 1, 2022 & 2029
Figure 3: Global E-contract Signing Platform Market Forecast (USD Billion), by Sub-Segment 1, 2018-2029
Figure 4: Global E-contract Signing Platform Market Forecast (USD Billion), by Sub-Segment 2, 2018-2029
Figure 5: Global E-contract Signing Platform Market Value Share (%), By Segment 2, 2022 & 2029
Figure 6: Global E-contract Signing Platform Market Forecast (USD Billion), by Sub-Segment 1, 2018-2029
Figure 7: Global E-contract Signing Platform Market Forecast (USD Billion), by Sub-Segment 2, 2018-2029
Figure 8: Global E-contract Signing Platform Market Forecast (USD Billion), by Sub-Segment 3, 2018-2029
Figure 9: Global E-contract Signing Platform Market Forecast (USD Billion), by Others, 2018-2029
Figure 10: Global E-contract Signing Platform Market Value Share (%), By Segment 3, 2022 & 2029
Figure 11: Global E-contract Signing Platform Market Forecast (USD Billion), by Sub-Segment 1, 2018-2029
Figure 12: Global E-contract Signing Platform Market Forecast (USD Billion), by Sub-Segment 2, 2018-2029
Figure 13: Global E-contract Signing Platform Market Forecast (USD Billion), by Sub-Segment 3, 2018-2029
Figure 14: Global E-contract Signing Platform Market Forecast (USD Billion), by Others, 2018-2029
Figure 15: Global E-contract Signing Platform Market Value (USD Billion), by Region, 2022 & 2029
Figure 16: North America E-contract Signing Platform Market Value Share (%), By Segment 1, 2022 & 2029
Figure 17: North America E-contract Signing Platform Market Forecast (USD Billion), by Sub-Segment 1, 2018-2029
Figure 18: North America E-contract Signing Platform Market Forecast (USD Billion), by Sub-Segment 2, 2018-2029
Figure 19: North America E-contract Signing Platform Market Value Share (%), By Segment 2, 2022 & 2029
Figure 20: North America E-contract Signing Platform Market Forecast (USD Billion), by Sub-Segment 1, 2018-2029
Figure 21: North America E-contract Signing Platform Market Forecast (USD Billion), by Sub-Segment 2, 2018-2029
Figure 22: North America E-contract Signing Platform Market Forecast (USD Billion), by Sub-Segment 3, 2018-2029
Figure 23: North America E-contract Signing Platform Market Forecast (USD Billion), by Others, 2018-2029
Figure 24: North America E-contract Signing Platform Market Value Share (%), By Segment 3, 2022 & 2029
Figure 25: North America E-contract Signing Platform Market Forecast (USD Billion), by Sub-Segment 1, 2018-2029
Figure 26: North America E-contract Signing Platform Market Forecast (USD Billion), by Sub-Segment 2, 2018-2029
Figure 27: North America E-contract Signing Platform Market Forecast (USD Billion), by Sub-Segment 3, 2018-2029
Figure 28: North America E-contract Signing Platform Market Forecast (USD Billion), by Others, 2018-2029
Figure 29: North America E-contract Signing Platform Market Forecast (USD Billion), by U.S., 2018-2029
Figure 30: North America E-contract Signing Platform Market Forecast (USD Billion), by Canada, 2018-2029
Figure 31: Latin America E-contract Signing Platform Market Value Share (%), By Segment 1, 2022 & 2029
Figure 32: Latin America E-contract Signing Platform Market Forecast (USD Billion), by Sub-Segment 1, 2018-2029
Figure 33: Latin America E-contract Signing Platform Market Forecast (USD Billion), by Sub-Segment 2, 2018-2029
Figure 34: Latin America E-contract Signing Platform Market Value Share (%), By Segment 2, 2022 & 2029
Figure 35: Latin America E-contract Signing Platform Market Forecast (USD Billion), by Sub-Segment 1, 2018-2029
Figure 36: Latin America E-contract Signing Platform Market Forecast (USD Billion), by Sub-Segment 2, 2018-2029
Figure 37: Latin America E-contract Signing Platform Market Forecast (USD Billion), by Sub-Segment 3, 2018-2029
Figure 38: Latin America E-contract Signing Platform Market Forecast (USD Billion), by Others, 2018-2029
Figure 39: Latin America E-contract Signing Platform Market Value Share (%), By Segment 3, 2022 & 2029
Figure 40: Latin America E-contract Signing Platform Market Forecast (USD Billion), by Sub-Segment 1, 2018-2029
Figure 41: Latin America E-contract Signing Platform Market Forecast (USD Billion), by Sub-Segment 2, 2018-2029
Figure 42: Latin America E-contract Signing Platform Market Forecast (USD Billion), by Sub-Segment 3, 2018-2029
Figure 43: Latin America E-contract Signing Platform Market Forecast (USD Billion), by Others, 2018-2029
Figure 44: Latin America E-contract Signing Platform Market Forecast (USD Billion), by Brazil, 2018-2029
Figure 45: Latin America E-contract Signing Platform Market Forecast (USD Billion), by Mexico, 2018-2029
Figure 46: Latin America E-contract Signing Platform Market Forecast (USD Billion), by Rest of Latin America, 2018-2029
Figure 47: Europe E-contract Signing Platform Market Value Share (%), By Segment 1, 2022 & 2029
Figure 48: Europe E-contract Signing Platform Market Forecast (USD Billion), by Sub-Segment 1, 2018-2029
Figure 49: Europe E-contract Signing Platform Market Forecast (USD Billion), by Sub-Segment 2, 2018-2029
Figure 50: Europe E-contract Signing Platform Market Value Share (%), By Segment 2, 2022 & 2029
Figure 51: Europe E-contract Signing Platform Market Forecast (USD Billion), by Sub-Segment 1, 2018-2029
Figure 52: Europe E-contract Signing Platform Market Forecast (USD Billion), by Sub-Segment 2, 2018-2029
Figure 53: Europe E-contract Signing Platform Market Forecast (USD Billion), by Sub-Segment 3, 2018-2029
Figure 54: Europe E-contract Signing Platform Market Forecast (USD Billion), by Others, 2018-2029
Figure 55: Europe E-contract Signing Platform Market Value Share (%), By Segment 3, 2022 & 2029
Figure 56: Europe E-contract Signing Platform Market Forecast (USD Billion), by Sub-Segment 1, 2018-2029
Figure 57: Europe E-contract Signing Platform Market Forecast (USD Billion), by Sub-Segment 2, 2018-2029
Figure 58: Europe E-contract Signing Platform Market Forecast (USD Billion), by Sub-Segment 3, 2018-2029
Figure 59: Europe E-contract Signing Platform Market Forecast (USD Billion), by Others, 2018-2029
Figure 60: Europe E-contract Signing Platform Market Forecast (USD Billion), by U.K., 2018-2029
Figure 61: Europe E-contract Signing Platform Market Forecast (USD Billion), by Germany, 2018-2029
Figure 62: Europe E-contract Signing Platform Market Forecast (USD Billion), by France, 2018-2029
Figure 63: Europe E-contract Signing Platform Market Forecast (USD Billion), by Italy, 2018-2029
Figure 64: Europe E-contract Signing Platform Market Forecast (USD Billion), by Spain, 2018-2029
Figure 65: Europe E-contract Signing Platform Market Forecast (USD Billion), by Russia, 2018-2029
Figure 66: Europe E-contract Signing Platform Market Forecast (USD Billion), by Rest of Europe, 2018-2029
Figure 67: Asia Pacific E-contract Signing Platform Market Value Share (%), By Segment 1, 2022 & 2029
Figure 68: Asia Pacific E-contract Signing Platform Market Forecast (USD Billion), by Sub-Segment 1, 2018-2029
Figure 69: Asia Pacific E-contract Signing Platform Market Forecast (USD Billion), by Sub-Segment 2, 2018-2029
Figure 70: Asia Pacific E-contract Signing Platform Market Value Share (%), By Segment 2, 2022 & 2029
Figure 71: Asia Pacific E-contract Signing Platform Market Forecast (USD Billion), by Sub-Segment 1, 2018-2029
Figure 72: Asia Pacific E-contract Signing Platform Market Forecast (USD Billion), by Sub-Segment 2, 2018-2029
Figure 73: Asia Pacific E-contract Signing Platform Market Forecast (USD Billion), by Sub-Segment 3, 2018-2029
Figure 74: Asia Pacific E-contract Signing Platform Market Forecast (USD Billion), by Others, 2018-2029
Figure 75: Asia Pacific E-contract Signing Platform Market Value Share (%), By Segment 3, 2022 & 2029
Figure 76: Asia Pacific E-contract Signing Platform Market Forecast (USD Billion), by Sub-Segment 1, 2018-2029
Figure 77: Asia Pacific E-contract Signing Platform Market Forecast (USD Billion), by Sub-Segment 2, 2018-2029
Figure 78: Asia Pacific E-contract Signing Platform Market Forecast (USD Billion), by Sub-Segment 3, 2018-2029
Figure 79: Asia Pacific E-contract Signing Platform Market Forecast (USD Billion), by Others, 2018-2029
Figure 80: Asia Pacific E-contract Signing Platform Market Forecast (USD Billion), by China, 2018-2029
Figure 81: Asia Pacific E-contract Signing Platform Market Forecast (USD Billion), by India, 2018-2029
Figure 82: Asia Pacific E-contract Signing Platform Market Forecast (USD Billion), by Japan, 2018-2029
Figure 83: Asia Pacific E-contract Signing Platform Market Forecast (USD Billion), by Australia, 2018-2029
Figure 84: Asia Pacific E-contract Signing Platform Market Forecast (USD Billion), by Southeast Asia, 2018-2029
Figure 85: Asia Pacific E-contract Signing Platform Market Forecast (USD Billion), by Rest of Asia Pacific, 2018-2029
Figure 86: Middle East & Africa E-contract Signing Platform Market Value Share (%), By Segment 1, 2022 & 2029
Figure 87: Middle East & Africa E-contract Signing Platform Market Forecast (USD Billion), by Sub-Segment 1, 2018-2029
Figure 88: Middle East & Africa E-contract Signing Platform Market Forecast (USD Billion), by Sub-Segment 2, 2018-2029
Figure 89: Middle East & Africa E-contract Signing Platform Market Value Share (%), By Segment 2, 2022 & 2029
Figure 90: Middle East & Africa E-contract Signing Platform Market Forecast (USD Billion), by Sub-Segment 1, 2018-2029
Figure 91: Middle East & Africa E-contract Signing Platform Market Forecast (USD Billion), by Sub-Segment 2, 2018-2029
Figure 92: Middle East & Africa E-contract Signing Platform Market Forecast (USD Billion), by Sub-Segment 3, 2018-2029
Figure 93: Middle East & Africa E-contract Signing Platform Market Forecast (USD Billion), by Others, 2018-2029
Figure 94: Middle East & Africa E-contract Signing Platform Market Value Share (%), By Segment 3, 2022 & 2029
Figure 95: Middle East & Africa E-contract Signing Platform Market Forecast (USD Billion), by Sub-Segment 1, 2018-2029
Figure 96: Middle East & Africa E-contract Signing Platform Market Forecast (USD Billion), by Sub-Segment 2, 2018-2029
Figure 97: Middle East & Africa E-contract Signing Platform Market Forecast (USD Billion), by Sub-Segment 3, 2018-2029
Figure 98: Middle East & Africa E-contract Signing Platform Market Forecast (USD Billion), by Others, 2018-2029
Figure 99: Middle East & Africa E-contract Signing Platform Market Forecast (USD Billion), by GCC, 2018-2029
Figure 100: Middle East & Africa E-contract Signing Platform Market Forecast (USD Billion), by South Africa, 2018-2029
Figure 101: Middle East & Africa E-contract Signing Platform Market Forecast (USD Billion), by Rest of Middle East & Africa, 2018-2029
List of Tables
Table 1: Global E-contract Signing Platform Market Revenue (USD Billion) Forecast, by Segment 1, 2018-2029
Table 2: Global E-contract Signing Platform Market Revenue (USD Billion) Forecast, by Segment 2, 2018-2029
Table 3: Global E-contract Signing Platform Market Revenue (USD Billion) Forecast, by Segment 3, 2018-2029
Table 4: Global E-contract Signing Platform Market Revenue (USD Billion) Forecast, by Region, 2018-2029
Table 5: North America E-contract Signing Platform Market Revenue (USD Billion) Forecast, by Segment 1, 2018-2029
Table 6: North America E-contract Signing Platform Market Revenue (USD Billion) Forecast, by Segment 2, 2018-2029
Table 7: North America E-contract Signing Platform Market Revenue (USD Billion) Forecast, by Segment 3, 2018-2029
Table 8: North America E-contract Signing Platform Market Revenue (USD Billion) Forecast, by Country, 2018-2029
Table 9: Europe E-contract Signing Platform Market Revenue (USD Billion) Forecast, by Segment 1, 2018-2029
Table 10: Europe E-contract Signing Platform Market Revenue (USD Billion) Forecast, by Segment 2, 2018-2029
Table 11: Europe E-contract Signing Platform Market Revenue (USD Billion) Forecast, by Segment 3, 2018-2029
Table 12: Europe E-contract Signing Platform Market Revenue (USD Billion) Forecast, by Country, 2018-2029
Table 13: Latin America E-contract Signing Platform Market Revenue (USD Billion) Forecast, by Segment 1, 2018-2029
Table 14: Latin America E-contract Signing Platform Market Revenue (USD Billion) Forecast, by Segment 2, 2018-2029
Table 15: Latin America E-contract Signing Platform Market Revenue (USD Billion) Forecast, by Segment 3, 2018-2029
Table 16: Latin America E-contract Signing Platform Market Revenue (USD Billion) Forecast, by Country, 2018-2029
Table 17: Asia Pacific E-contract Signing Platform Market Revenue (USD Billion) Forecast, by Segment 1, 2018-2029
Table 18: Asia Pacific E-contract Signing Platform Market Revenue (USD Billion) Forecast, by Segment 2, 2018-2029
Table 19: Asia Pacific E-contract Signing Platform Market Revenue (USD Billion) Forecast, by Segment 3, 2018-2029
Table 20: Asia Pacific E-contract Signing Platform Market Revenue (USD Billion) Forecast, by Country, 2018-2029
Table 21: Middle East & Africa E-contract Signing Platform Market Revenue (USD Billion) Forecast, by Segment 1, 2018-2029
Table 22: Middle East & Africa E-contract Signing Platform Market Revenue (USD Billion) Forecast, by Segment 2, 2018-2029
Table 23: Middle East & Africa E-contract Signing Platform Market Revenue (USD Billion) Forecast, by Segment 3, 2018-2029
Table 24: Middle East & Africa E-contract Signing Platform Market Revenue (USD Billion) Forecast, by Country, 2018-2029
Research Process
Data Library Research are conducted by industry experts who offer insight on
industry structure, market segmentations technology assessment and competitive landscape (CL), and penetration, as well as on emerging trends. Their analysis is based on primary interviews (~ 80%) and secondary research (~ 20%) as well as years of professional expertise in their respective industries. Adding to this, by analysing historical trends and current market positions, our analysts predict where the market will be headed for the next five years. Furthermore, the varying trends of segment & categories geographically presented are also studied and the estimated based on the primary & secondary research.
In this particular report from the supply side Data Library Research has conducted primary surveys (interviews) with the key level executives (VP, CEO’s, Marketing Director, Business Development Manager
and SOFT) of the companies that active & prominent as well as the midsized organization
FIGURE 1: DLR RESEARH PROCESS
![research-methodology1]()
Primary Research
Extensive primary research was conducted to gain a deeper insight of the market and industry performance. The analysis is based on both primary and secondary research as well as years of professional expertise in the respective industries.
In addition to analysing current and historical trends, our analysts predict where the market is headed over the next five years.
It varies by segment for these categories geographically presented in the list of market tables. Speaking about this particular report we have conducted primary surveys (interviews) with the key level executives (VP, CEO’s, Marketing Director, Business Development Manager and many more) of the major players active in the market.
Secondary Research
Secondary research was mainly used to collect and identify information useful for the extensive, technical, market-oriented, and Friend’s study of the Global Extra Neutral Alcohol. It was also used to obtain key information about major players, market classification and segmentation according to the industry trends, geographical markets, and developments related to the market and technology perspectives. For this study, analysts have gathered information from various credible sources, such as annual reports, sec filings, journals, white papers, SOFT presentations, and company web sites.
Market Size Estimation
Both, top-down and bottom-up approaches were used to estimate and validate the size of the Global market and to estimate the size of various other dependent submarkets in the overall Extra Neutral Alcohol. The key players in the market were identified through secondary research and their market contributions in the respective geographies were determined through primary and secondary research.
Forecast Model
![research-methodology2]()