Electric Micro Bus Market Overview and Analysis

  • The Global Electric Micro Bus Market is expected to grow at a compound annual growth rate of 13.2% from 2025 to 2032 to reach USD 112.12 billion by 2032 from USD 88.56 billion in 2025.

Electric Micro Bus Market

Get Complete Analysis Of The Report - Download Updated Free Sample PDF

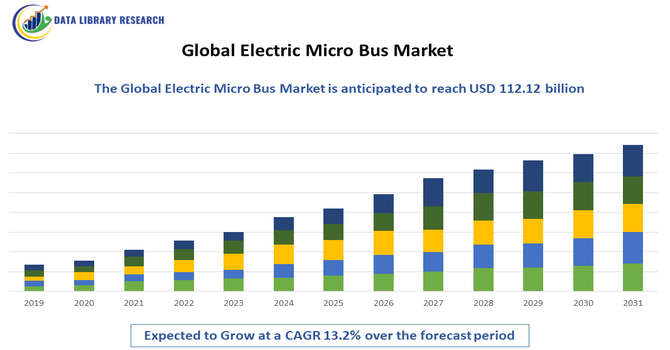
The Global Electric Micro Bus Market refers to the worldwide industry involved in the design, manufacture, and sale of compact, fully electric buses used for urban transport, shuttle services, and last-mile connectivity. These vehicles offer zero-emission mobility, lower operational costs, and reduced noise pollution. Market growth is driven by rising urbanization, government policies promoting sustainable transport, increasing demand for public electric mobility, and advancements in battery technology and electric drivetrains.

Electric Micro Bus Market Latest Trends

The global electric micro bus market is witnessing rapid growth due to increasing urbanization, rising traffic congestion, and growing environmental awareness. Cities are adopting electric microbuses for last-mile connectivity, reducing carbon emissions and noise pollution. Technological advancements in battery efficiency, fast charging infrastructure, and lightweight materials enhance vehicle performance and cost-effectiveness. Government incentives, subsidies, and stricter emission regulations further encourage adoption.

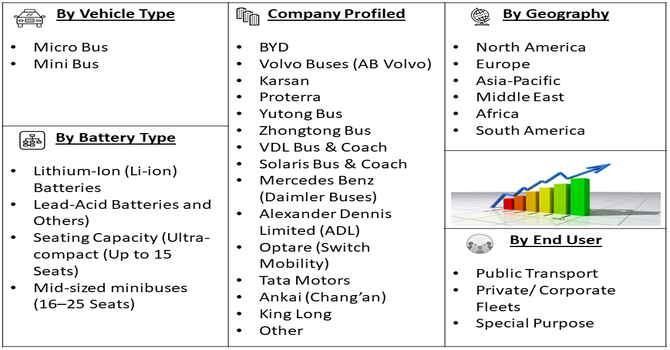
Segmentation: The Global Electric Micro Bus Market is segmented by Vehicle Type (Micro Bus, and Mini Bus), Battery Type (Lithium-Ion (Li-ion) Batteries, Lead-Acid Batteries and Others), Seating Capacity (Ultra-compact (Up to 15 Seats), and Mid-sized minibuses (16–25 Seats)), End-Use (Public Transport, Private/ Corporate Fleets and Special Purpose), and Geography (North America, Europe, Asia-Pacific, Middle East and Africa, and South America). The report provides the value (in USD million) for the above segments.

Electric Micro Bus Market Segment

For Detailed Market Segmentation - Get a Free Sample PDF

Market Drivers:

  • Government Policies and Incentives

Government initiatives promoting clean energy and sustainable transportation are key drivers for the electric micro bus market. Subsidies, tax incentives, and grants encourage fleet operators and municipalities to adopt electric microbuses, reducing reliance on diesel-powered vehicles. Regulatory pressure to meet emission reduction targets and comply with stringent environmental norms further accelerates adoption. Investments in charging infrastructure and smart city projects create a favorable environment for electric microbuses. These policies not only reduce operational costs for operators but also drive public acceptance of eco-friendly transport, significantly contributing to the market’s global growth trajectory.

  • Rising Urbanization and Public Transport Demand

Rapid urbanization and increasing population density in cities are driving demand for compact, energy-efficient electric microbuses. These vehicles offer flexible last-mile connectivity, reduce traffic congestion, and provide an eco-friendly alternative to conventional buses and taxis. Growing awareness of environmental sustainability and rising fuel costs further encourage adoption.

In May 2025, GreenCell Mobility reached a milestone by securing an order for over 1,200 electric buses under the PM E-Bus Sewa Scheme to strengthen India’s electric public transport network. The initiative aims to transform urban mobility by providing sustainable, zero-emission transportation solutions and promoting cleaner, eco-friendly city commuting. Fleet operators and private enterprises, including hotels and corporate campuses, are increasingly opting for electric microbuses for shuttles and short-route services. Technological advancements in battery range, fast charging, and vehicle design enhance convenience and performance, boosting market adoption globally and supporting long-term growth of electric urban mobility solutions.

Market Restraints:

  • High Initial Cost and Infrastructure Challenges

The high upfront cost of electric microbuses and associated charging infrastructure poses a significant restraint to market growth. Battery systems, advanced drivetrains, and vehicle electronics make these buses more expensive than traditional diesel counterparts. Limited public charging networks and inadequate fast-charging facilities in some regions hinder fleet adoption, particularly in emerging markets. Maintenance and replacement costs for batteries and specialized components add to operational expenses. Additionally, lack of standardized infrastructure and support for electric fleets can delay deployment. These economic and logistical challenges restrict widespread adoption, slowing the global growth of the electric micro bus market despite increasing demand for sustainable urban mobility.

Socioeconomic Impact on Electric Micro Bus Market

Electric microbuses significantly influence socioeconomic dynamics by promoting sustainable urban transport and reducing greenhouse gas emissions. Lower operational and maintenance costs compared to conventional diesel buses create economic benefits for fleet operators. Enhanced accessibility improves mobility for urban populations, particularly in densely populated cities. Job creation occurs in vehicle manufacturing, battery production, and charging infrastructure deployment. The shift toward electric fleets supports public health by reducing air pollution and noise, while stimulating investment in clean energy solutions. Thus, electric microbuses contribute to environmental sustainability, cost-efficient transportation, and improved quality of urban life, reflecting a positive socioeconomic impact globally.

Segmental Analysis:

  • Mini Bus segment is expected to witness the highest growth over the forecast period

The Mini Bus segment is projected to witness the highest growth due to rising demand for compact and efficient transport solutions in urban areas, tourism, and corporate shuttle services. Mini buses offer flexibility, lower operational costs, and suitability for narrow city roads compared to larger buses. Their ability to provide last-mile connectivity and environmentally friendly mobility aligns with increasing urbanization and sustainability initiatives. Advancements in electric drivetrains, battery range, and vehicle safety features make mini buses an attractive choice for fleet operators, driving significant adoption across public and private transportation networks globally.

  • Lead-Acid Batteries segment is expected to witness the highest growth over the forecast period

The Lead-Acid Batteries segment is expected to grow steadily due to their cost-effectiveness, reliability, and established technology. While lithium-ion batteries dominate high-performance applications, lead-acid batteries remain popular in budget-conscious fleets and emerging markets where affordability is critical. These batteries are simpler to maintain, widely available, and support moderate-range electric microbuses for city and last-mile operations. Operators seeking low-cost entry into electric mobility prefer lead-acid solutions, particularly for private, corporate, and municipal fleets. This widespread adoption positions lead-acid battery-powered electric microbuses as a key segment driving market growth in regions prioritizing cost efficiency over advanced performance.

  • Mid-sized minibuses (16–25 Seats) segment is expected to witness the highest growth over the forecast period

The 16–25 seat mid-sized minibus segment is projected to experience the highest growth as it balances capacity and efficiency for urban and intercity routes. These minibuses cater to corporate fleets, airport shuttles, and public transport, offering cost-effective, low-emission alternatives to larger buses. Their size enables maneuverability in congested urban roads while maintaining adequate passenger capacity. Electrification of mid-sized minibuses reduces fuel costs and supports environmental goals. Technological advancements in battery range, fast charging, and safety systems further enhance their appeal, driving adoption among fleet operators globally and contributing significantly to market growth.

  • Private/ Corporate Fleets segment is expected to witness the highest growth over the forecast period

The Private/Corporate Fleets segment is expected to see substantial growth due to increasing adoption of electric microbuses for employee shuttles, airport transfers, and tourism services. Companies are prioritizing sustainability, cost reduction, and enhanced employee experience, making electric minibuses an attractive solution. Lower operational costs, reduced emissions, and quiet operation align with corporate ESG initiatives. Technological improvements in range, charging speed, and fleet management systems enable efficient deployment. Expanding awareness of eco-friendly mobility and supportive government incentives further encourage corporate adoption, making this segment a key contributor to the growth of the global electric micro bus market.

  • Asia-Pacific Region is expected to witness highest growth over the forecast period

The Asia-Pacific region is projected to lead the global electric micro bus market due to rapid urbanization, rising population density, and increasing investment in sustainable public transport. Countries such as China, India, Japan, and South Korea are expanding EV infrastructure, offering subsidies, and implementing stringent emission regulations to promote adoption. For instance, In December 2023, Turkish manufacturer Karsan introduced its e-JEST electric minibus in Japan. Originally launched in Europe in 2018, the e-JEST expanded to the U.S. and Canada as the first electric minibus in those markets. The vehicle supports global adoption of compact, sustainable urban mobility solutions.

Simialrly, in March 2024, Volvo Buses launched the Volvo 8900 Electric, a low-entry electric bus for intercity, commuter, and city operations. Available in two- and three-axle configurations, it enables fleet operators to enhance efficiency, sustainability, and profitability while addressing growing demand for environmentally friendly public transportation solutions.

Growing demand for last-mile connectivity, tourism shuttles, and corporate transport solutions drives fleet operators to adopt electric microbuses. Local manufacturers and international collaborations are increasing production capabilities and technological advancements. Consequently, Asia-Pacific is expected to witness the highest growth during the forecast period, becoming a dominant market globally.

Electric Micro Bus Market Segment

To Learn More About This Report - Request a Free Sample Copy

Electric Micro Bus Market Competitive Landscape

The competitive landscape of the global electric micro bus market is increasingly dynamic, with manufacturers focusing on innovation, technology integration, and strategic partnerships. Key players include BYD, Proterra, ADL (Alexander Dennis Limited), Yutong, Zhongtong Bus, and VDL Bus & Coach, among others. Companies compete through product differentiation, battery efficiency, vehicle range, and charging infrastructure compatibility. Mergers, collaborations with city transport authorities, and government-backed pilot programs enhance market presence. R&D investments focus on lightweight designs, extended range, and smart fleet management solutions. Price competitiveness, after-sales support, and sustainability commitments are critical factors shaping the global electric micro bus market.

The major players for above market are:

  • BYD
  • Volvo Buses (AB Volvo)
  • Karsan
  • Proterra
  • Yutong Bus
  • Zhongtong Bus
  • VDL Bus & Coach
  • Solaris Bus & Coach
  • Mercedes Benz (Daimler Buses)
  • Alexander Dennis Limited (ADL)
  • Optare (Switch Mobility)
  • Tata Motors
  • Ankai (Chang’an)
  • King Long
  • SAIC Iveco Hongyan
  • Ashok Leyland
  • Foton Motor
  • NFI Group (New Flyer)
  • Ebusco

Recent Development

  • In May 2025, Evey Trans Private Limited, a subsidiary of Olectra Greentech, introduced low-floor electric buses in Puducherry on 26th May 2025. The initiative aims to enhance the region’s public transportation system by promoting the adoption of environmentally friendly electric vehicles and supporting sustainable urban mobility.


  • In May 2025, the Delhi Transport Department approved a new color scheme for the recently launched Delhi Electric Vehicle Interconnector (DEVI) buses to enhance their visibility and identity. The buses will now feature a combination of dark orange and yellow, improving recognition and promoting the electric public transport initiative.


Frequently Asked Questions (FAQ) :

Q1. What are the main growth-driving factors for this market?

The market is driven by global efforts to reduce urban air pollution and meet carbon neutrality goals. Governments are offering generous subsidies and "green" incentives for cities to replace diesel fleets. Additionally, the rising demand for efficient "last-mile" connectivity between train stations and residential areas makes these smaller, agile electric buses a perfect solution for modern smart cities.

Q2. What are the main restraining factors for this market?

Growth is limited by the high upfront cost of electric vehicles and the expensive infrastructure required for high-speed charging stations. Limited battery range can also be a concern for longer routes or hilly terrain. Furthermore, the global shortage of lithium and other battery minerals can lead to manufacturing delays and unpredictable pricing for smaller bus manufacturers.

Q3. Which segment is expected to witness high growth?

The Autonomous Electric Micro Bus segment is expected to see the highest growth. These self-driving shuttles are being tested in airports, university campuses, and gated communities to move small groups of people without the need for a driver. Their ability to operate on fixed loops 24/7 makes them highly cost-effective and technologically attractive for future transit.

Q4. Who are the top major players for this market?

The market is led by specialized electric vehicle manufacturers and traditional bus giants. Key players include BYD, Yutong, Proterra, Navya, and Local Motors (Olli). These companies dominate by developing modular platforms that can be customized for different seating capacities while integrating advanced battery management systems to maximize the vehicle's daily operational range.

Q5. Which country is the largest player?

China is the largest player in the electric micro bus market. It has the world's most aggressive electrification policy and is home to the largest manufacturers, such as BYD and Yutong. With massive government-led initiatives to electrify public transit in every major city, China accounts for the vast majority of global production and domestic bus deployment.

Electric Micro Bus MARKET STUDY GLOBAL MARKET ANALYSIS, INSIGHTS AND FORECAST, 2022-2029

    1. Introduction

    • 1.1. Research Scope
    • 1.2. Market Segmentation
    • 1.3. Research Methodology
    • 1.4. Definitions and Assumptions

    2. Executive Summary

      3. Market Dynamics

      • 3.1. Market Drivers
      • 3.2. Market Restraints
      • 3.3. Market Opportunities

      4. Key Insights

      • 4.1. Key Emerging Trends – For Major Countries
      • 4.2. Latest Technological Advancement
      • 4.3. Regulatory Landscape
      • 4.4. Industry SWOT Analysis
      • 4.5. Porters Five Forces Analysis

      5. Global Electric Micro Bus Market Analysis (USD Billion), Insights and Forecast, 2018-2029

      • 5.1. Key Findings / Summary
      • 5.2. Market Analysis, Insights and Forecast – By Segment 1
        • 5.2.1. Sub-Segment 1
        • 5.2.2. Sub-Segment 2
      • 5.3. Market Analysis, Insights and Forecast – By Segment 2
        • 5.3.1. Sub-Segment 1
        • 5.3.2. Sub-Segment 2
        • 5.3.3. Sub-Segment 3
        • 5.3.4. Others
      • 5.4. Market Analysis, Insights and Forecast – By Segment 3
        • 5.4.1. Sub-Segment 1
        • 5.4.2. Sub-Segment 2
        • 5.4.3. Sub-Segment 3
        • 5.4.4. Others
      • 5.5. Market Analysis, Insights and Forecast – By Region
        • 5.5.1. North America
        • 5.5.2. Latin America
        • 5.5.3. Europe
        • 5.5.4. Asia Pacific
        • 5.5.5. Middle East and Africa

      6. North America Electric Micro Bus Market Analysis (USD Billion), Insights and Forecast, 2018-2029

      • 6.1. Key Findings / Summary
      • 6.2. Market Analysis, Insights and Forecast – By Segment 1
        • 6.2.1. Sub-Segment 1
        • 6.2.2. Sub-Segment 2
      • 6.3. Market Analysis, Insights and Forecast – By Segment 2
        • 6.3.1. Sub-Segment 1
        • 6.3.2. Sub-Segment 2
        • 6.3.3. Sub-Segment 3
        • 6.3.4. Others
      • 6.4. Market Analysis, Insights and Forecast – By Segment 3
        • 6.4.1. Sub-Segment 1
        • 6.4.2. Sub-Segment 2
        • 6.4.3. Sub-Segment 3
        • 6.4.4. Others
      • 6.5. Market Analysis, Insights and Forecast – By Country
        • 6.5.1. U.S.
        • 6.5.2. Canada

      7. Latin America Electric Micro Bus Market Analysis (USD Billion), Insights and Forecast, 2018-2029

      • 7.1. Key Findings / Summary
      • 7.2. Market Analysis, Insights and Forecast – By Segment 1
        • 7.2.1. Sub-Segment 1
        • 7.2.2. Sub-Segment 2
      • 7.3. Market Analysis, Insights and Forecast – By Segment 2
        • 7.3.1. Sub-Segment 1
        • 7.3.2. Sub-Segment 2
        • 7.3.3. Sub-Segment 3
        • 7.3.4. Others
      • 7.4. Market Analysis, Insights and Forecast – By Segment 3
        • 7.4.1. Sub-Segment 1
        • 7.4.2. Sub-Segment 2
        • 7.4.3. Sub-Segment 3
        • 7.4.4. Others
      • 7.5. Insights and Forecast – By Country
        • 7.5.1. Brazil
        • 7.5.2. Mexico
        • 7.5.3. Rest of Latin America

      8. Europe Electric Micro Bus Market Analysis (USD Billion), Insights and Forecast, 2018-2029

      • 8.1. Key Findings / Summary
      • 8.2. Market Analysis, Insights and Forecast – By Segment 1
        • 8.2.1. Sub-Segment 1
        • 8.2.2. Sub-Segment 2
      • 8.3. Market Analysis, Insights and Forecast – By Segment 2
        • 8.3.1. Sub-Segment 1
        • 8.3.2. Sub-Segment 2
        • 8.3.3. Sub-Segment 3
        • 8.3.4. Others
      • 8.4. Market Analysis, Insights and Forecast – By Segment 3
        • 8.4.1. Sub-Segment 1
        • 8.4.2. Sub-Segment 2
        • 8.4.3. Sub-Segment 3
        • 8.4.4. Others
      • 8.5. Market Analysis, Insights and Forecast – By Country
        • 8.5.1. UK
        • 8.5.2. Germany
        • 8.5.3. France
        • 8.5.4. Italy
        • 8.5.5. Spain
        • 8.5.6. Russia
        • 8.5.7. Rest of Europe

      9. Asia Pacific Electric Micro Bus Market Analysis (USD Billion), Insights and Forecast, 2018-2029

      • 9.1. Key Findings / Summary
      • 9.2. Market Analysis, Insights and Forecast – By Segment 1
        • 9.2.1. Sub-Segment 1
        • 9.2.2. Sub-Segment 2
      • 9.3. Market Analysis, Insights and Forecast – By Segment 2
        • 9.3.1. Sub-Segment 1
        • 9.3.2. Sub-Segment 2
        • 9.3.3. Sub-Segment 3
        • 9.3.4. Others
      • 9.4. Market Analysis, Insights and Forecast – By Segment 3
        • 9.4.1. Sub-Segment 1
        • 9.4.2. Sub-Segment 2
        • 9.4.3. Sub-Segment 3
        • 9.4.4. Others
      • 9.5. Market Analysis, Insights and Forecast – By Country
        • 9.5.1. China
        • 9.5.2. India
        • 9.5.3. Japan
        • 9.5.4. Australia
        • 9.5.5. South East Asia
        • 9.5.6. Rest of Asia Pacific

      10. Middle East & Africa Electric Micro Bus Market Analysis (USD Billion), Insights and Forecast, 2018-2029

      • 10.1. Key Findings / Summary
      • 10.2. Market Analysis, Insights and Forecast – By Segment 1
        • 10.2.1. Sub-Segment 1
        • 10.2.2. Sub-Segment 2
      • 10.3. Market Analysis, Insights and Forecast – By Segment 2
        • 10.3.1. Sub-Segment 1
        • 10.3.2. Sub-Segment 2
        • 10.3.3. Sub-Segment 3
        • 10.3.4. Others
      • 10.4. Market Analysis, Insights and Forecast – By Segment 3
        • 10.4.1. Sub-Segment 1
        • 10.4.2. Sub-Segment 2
        • 10.4.3. Sub-Segment 3
        • 10.4.4. Others
      • 10.5. Market Analysis, Insights and Forecast – By Country
        • 10.5.1. GCC
        • 10.5.2. South Africa
        • 10.5.3. Rest of Middle East & Africa

      11. Competitive Analysis

      • 11.1. Company Market Share Analysis, 2018
      • 11.2. Key Industry Developments
      • 11.3. Company Profile
        • 11.3.1. Company 1
          • 11.3.1.1. Business Overview
          • 11.3.1.2. Segment 1 & Service Offering
          • 11.3.1.3. Overall Revenue
          • 11.3.1.4. Geographic Presence
          • 11.3.1.5. Recent Development
        *Similar details will be provided for the following companies
        • 11.3.2. Company 2
        • 11.3.3. Company 3
        • 11.3.4. Company 4
        • 11.3.5. Company 5
        • 11.3.6. Company 6
        • 11.3.7. Company 7
        • 11.3.8. Company 8
        • 11.3.9. Company 9
        • 11.3.10. Company 10
        • 11.3.11. Company 11
        • 11.3.12. Company 12
      List of Figures

      Figure 1: Global Electric Micro Bus Market Revenue Breakdown (USD Billion, %) by Region, 2022 & 2029
      Figure 2: Global Electric Micro Bus Market Value Share (%), By Segment 1, 2022 & 2029
      Figure 3: Global Electric Micro Bus Market Forecast (USD Billion), by Sub-Segment 1, 2018-2029
      Figure 4: Global Electric Micro Bus Market Forecast (USD Billion), by Sub-Segment 2, 2018-2029
      Figure 5: Global Electric Micro Bus Market Value Share (%), By Segment 2, 2022 & 2029
      Figure 6: Global Electric Micro Bus Market Forecast (USD Billion), by Sub-Segment 1, 2018-2029
      Figure 7: Global Electric Micro Bus Market Forecast (USD Billion), by Sub-Segment 2, 2018-2029
      Figure 8: Global Electric Micro Bus Market Forecast (USD Billion), by Sub-Segment 3, 2018-2029
      Figure 9: Global Electric Micro Bus Market Forecast (USD Billion), by Others, 2018-2029
      Figure 10: Global Electric Micro Bus Market Value Share (%), By Segment 3, 2022 & 2029
      Figure 11: Global Electric Micro Bus Market Forecast (USD Billion), by Sub-Segment 1, 2018-2029
      Figure 12: Global Electric Micro Bus Market Forecast (USD Billion), by Sub-Segment 2, 2018-2029
      Figure 13: Global Electric Micro Bus Market Forecast (USD Billion), by Sub-Segment 3, 2018-2029
      Figure 14: Global Electric Micro Bus Market Forecast (USD Billion), by Others, 2018-2029
      Figure 15: Global Electric Micro Bus Market Value (USD Billion), by Region, 2022 & 2029
      Figure 16: North America Electric Micro Bus Market Value Share (%), By Segment 1, 2022 & 2029
      Figure 17: North America Electric Micro Bus Market Forecast (USD Billion), by Sub-Segment 1, 2018-2029
      Figure 18: North America Electric Micro Bus Market Forecast (USD Billion), by Sub-Segment 2, 2018-2029
      Figure 19: North America Electric Micro Bus Market Value Share (%), By Segment 2, 2022 & 2029
      Figure 20: North America Electric Micro Bus Market Forecast (USD Billion), by Sub-Segment 1, 2018-2029
      Figure 21: North America Electric Micro Bus Market Forecast (USD Billion), by Sub-Segment 2, 2018-2029
      Figure 22: North America Electric Micro Bus Market Forecast (USD Billion), by Sub-Segment 3, 2018-2029
      Figure 23: North America Electric Micro Bus Market Forecast (USD Billion), by Others, 2018-2029
      Figure 24: North America Electric Micro Bus Market Value Share (%), By Segment 3, 2022 & 2029
      Figure 25: North America Electric Micro Bus Market Forecast (USD Billion), by Sub-Segment 1, 2018-2029
      Figure 26: North America Electric Micro Bus Market Forecast (USD Billion), by Sub-Segment 2, 2018-2029
      Figure 27: North America Electric Micro Bus Market Forecast (USD Billion), by Sub-Segment 3, 2018-2029
      Figure 28: North America Electric Micro Bus Market Forecast (USD Billion), by Others, 2018-2029
      Figure 29: North America Electric Micro Bus Market Forecast (USD Billion), by U.S., 2018-2029
      Figure 30: North America Electric Micro Bus Market Forecast (USD Billion), by Canada, 2018-2029
      Figure 31: Latin America Electric Micro Bus Market Value Share (%), By Segment 1, 2022 & 2029
      Figure 32: Latin America Electric Micro Bus Market Forecast (USD Billion), by Sub-Segment 1, 2018-2029
      Figure 33: Latin America Electric Micro Bus Market Forecast (USD Billion), by Sub-Segment 2, 2018-2029
      Figure 34: Latin America Electric Micro Bus Market Value Share (%), By Segment 2, 2022 & 2029
      Figure 35: Latin America Electric Micro Bus Market Forecast (USD Billion), by Sub-Segment 1, 2018-2029
      Figure 36: Latin America Electric Micro Bus Market Forecast (USD Billion), by Sub-Segment 2, 2018-2029
      Figure 37: Latin America Electric Micro Bus Market Forecast (USD Billion), by Sub-Segment 3, 2018-2029
      Figure 38: Latin America Electric Micro Bus Market Forecast (USD Billion), by Others, 2018-2029
      Figure 39: Latin America Electric Micro Bus Market Value Share (%), By Segment 3, 2022 & 2029
      Figure 40: Latin America Electric Micro Bus Market Forecast (USD Billion), by Sub-Segment 1, 2018-2029
      Figure 41: Latin America Electric Micro Bus Market Forecast (USD Billion), by Sub-Segment 2, 2018-2029
      Figure 42: Latin America Electric Micro Bus Market Forecast (USD Billion), by Sub-Segment 3, 2018-2029
      Figure 43: Latin America Electric Micro Bus Market Forecast (USD Billion), by Others, 2018-2029
      Figure 44: Latin America Electric Micro Bus Market Forecast (USD Billion), by Brazil, 2018-2029
      Figure 45: Latin America Electric Micro Bus Market Forecast (USD Billion), by Mexico, 2018-2029
      Figure 46: Latin America Electric Micro Bus Market Forecast (USD Billion), by Rest of Latin America, 2018-2029
      Figure 47: Europe Electric Micro Bus Market Value Share (%), By Segment 1, 2022 & 2029
      Figure 48: Europe Electric Micro Bus Market Forecast (USD Billion), by Sub-Segment 1, 2018-2029
      Figure 49: Europe Electric Micro Bus Market Forecast (USD Billion), by Sub-Segment 2, 2018-2029
      Figure 50: Europe Electric Micro Bus Market Value Share (%), By Segment 2, 2022 & 2029
      Figure 51: Europe Electric Micro Bus Market Forecast (USD Billion), by Sub-Segment 1, 2018-2029
      Figure 52: Europe Electric Micro Bus Market Forecast (USD Billion), by Sub-Segment 2, 2018-2029
      Figure 53: Europe Electric Micro Bus Market Forecast (USD Billion), by Sub-Segment 3, 2018-2029
      Figure 54: Europe Electric Micro Bus Market Forecast (USD Billion), by Others, 2018-2029
      Figure 55: Europe Electric Micro Bus Market Value Share (%), By Segment 3, 2022 & 2029
      Figure 56: Europe Electric Micro Bus Market Forecast (USD Billion), by Sub-Segment 1, 2018-2029
      Figure 57: Europe Electric Micro Bus Market Forecast (USD Billion), by Sub-Segment 2, 2018-2029
      Figure 58: Europe Electric Micro Bus Market Forecast (USD Billion), by Sub-Segment 3, 2018-2029
      Figure 59: Europe Electric Micro Bus Market Forecast (USD Billion), by Others, 2018-2029
      Figure 60: Europe Electric Micro Bus Market Forecast (USD Billion), by U.K., 2018-2029
      Figure 61: Europe Electric Micro Bus Market Forecast (USD Billion), by Germany, 2018-2029
      Figure 62: Europe Electric Micro Bus Market Forecast (USD Billion), by France, 2018-2029
      Figure 63: Europe Electric Micro Bus Market Forecast (USD Billion), by Italy, 2018-2029
      Figure 64: Europe Electric Micro Bus Market Forecast (USD Billion), by Spain, 2018-2029
      Figure 65: Europe Electric Micro Bus Market Forecast (USD Billion), by Russia, 2018-2029
      Figure 66: Europe Electric Micro Bus Market Forecast (USD Billion), by Rest of Europe, 2018-2029
      Figure 67: Asia Pacific Electric Micro Bus Market Value Share (%), By Segment 1, 2022 & 2029
      Figure 68: Asia Pacific Electric Micro Bus Market Forecast (USD Billion), by Sub-Segment 1, 2018-2029
      Figure 69: Asia Pacific Electric Micro Bus Market Forecast (USD Billion), by Sub-Segment 2, 2018-2029
      Figure 70: Asia Pacific Electric Micro Bus Market Value Share (%), By Segment 2, 2022 & 2029
      Figure 71: Asia Pacific Electric Micro Bus Market Forecast (USD Billion), by Sub-Segment 1, 2018-2029
      Figure 72: Asia Pacific Electric Micro Bus Market Forecast (USD Billion), by Sub-Segment 2, 2018-2029
      Figure 73: Asia Pacific Electric Micro Bus Market Forecast (USD Billion), by Sub-Segment 3, 2018-2029
      Figure 74: Asia Pacific Electric Micro Bus Market Forecast (USD Billion), by Others, 2018-2029
      Figure 75: Asia Pacific Electric Micro Bus Market Value Share (%), By Segment 3, 2022 & 2029
      Figure 76: Asia Pacific Electric Micro Bus Market Forecast (USD Billion), by Sub-Segment 1, 2018-2029
      Figure 77: Asia Pacific Electric Micro Bus Market Forecast (USD Billion), by Sub-Segment 2, 2018-2029
      Figure 78: Asia Pacific Electric Micro Bus Market Forecast (USD Billion), by Sub-Segment 3, 2018-2029
      Figure 79: Asia Pacific Electric Micro Bus Market Forecast (USD Billion), by Others, 2018-2029
      Figure 80: Asia Pacific Electric Micro Bus Market Forecast (USD Billion), by China, 2018-2029
      Figure 81: Asia Pacific Electric Micro Bus Market Forecast (USD Billion), by India, 2018-2029
      Figure 82: Asia Pacific Electric Micro Bus Market Forecast (USD Billion), by Japan, 2018-2029
      Figure 83: Asia Pacific Electric Micro Bus Market Forecast (USD Billion), by Australia, 2018-2029
      Figure 84: Asia Pacific Electric Micro Bus Market Forecast (USD Billion), by Southeast Asia, 2018-2029
      Figure 85: Asia Pacific Electric Micro Bus Market Forecast (USD Billion), by Rest of Asia Pacific, 2018-2029
      Figure 86: Middle East & Africa Electric Micro Bus Market Value Share (%), By Segment 1, 2022 & 2029
      Figure 87: Middle East & Africa Electric Micro Bus Market Forecast (USD Billion), by Sub-Segment 1, 2018-2029
      Figure 88: Middle East & Africa Electric Micro Bus Market Forecast (USD Billion), by Sub-Segment 2, 2018-2029
      Figure 89: Middle East & Africa Electric Micro Bus Market Value Share (%), By Segment 2, 2022 & 2029
      Figure 90: Middle East & Africa Electric Micro Bus Market Forecast (USD Billion), by Sub-Segment 1, 2018-2029
      Figure 91: Middle East & Africa Electric Micro Bus Market Forecast (USD Billion), by Sub-Segment 2, 2018-2029
      Figure 92: Middle East & Africa Electric Micro Bus Market Forecast (USD Billion), by Sub-Segment 3, 2018-2029
      Figure 93: Middle East & Africa Electric Micro Bus Market Forecast (USD Billion), by Others, 2018-2029
      Figure 94: Middle East & Africa Electric Micro Bus Market Value Share (%), By Segment 3, 2022 & 2029
      Figure 95: Middle East & Africa Electric Micro Bus Market Forecast (USD Billion), by Sub-Segment 1, 2018-2029
      Figure 96: Middle East & Africa Electric Micro Bus Market Forecast (USD Billion), by Sub-Segment 2, 2018-2029
      Figure 97: Middle East & Africa Electric Micro Bus Market Forecast (USD Billion), by Sub-Segment 3, 2018-2029
      Figure 98: Middle East & Africa Electric Micro Bus Market Forecast (USD Billion), by Others, 2018-2029
      Figure 99: Middle East & Africa Electric Micro Bus Market Forecast (USD Billion), by GCC, 2018-2029
      Figure 100: Middle East & Africa Electric Micro Bus Market Forecast (USD Billion), by South Africa, 2018-2029
      Figure 101: Middle East & Africa Electric Micro Bus Market Forecast (USD Billion), by Rest of Middle East & Africa, 2018-2029 
      List of Tables
      Table 1: Global Electric Micro Bus Market Revenue (USD Billion) Forecast, by Segment 1, 2018-2029
      Table 2: Global Electric Micro Bus Market Revenue (USD Billion) Forecast, by Segment 2, 2018-2029
      Table 3: Global Electric Micro Bus Market Revenue (USD Billion) Forecast, by Segment 3, 2018-2029
      Table 4: Global Electric Micro Bus Market Revenue (USD Billion) Forecast, by Region, 2018-2029
      Table 5: North America Electric Micro Bus Market Revenue (USD Billion) Forecast, by Segment 1, 2018-2029
      Table 6: North America Electric Micro Bus Market Revenue (USD Billion) Forecast, by Segment 2, 2018-2029
      Table 7: North America Electric Micro Bus Market Revenue (USD Billion) Forecast, by Segment 3, 2018-2029
      Table 8: North America Electric Micro Bus Market Revenue (USD Billion) Forecast, by Country, 2018-2029
      Table 9: Europe Electric Micro Bus Market Revenue (USD Billion) Forecast, by Segment 1, 2018-2029
      Table 10: Europe Electric Micro Bus Market Revenue (USD Billion) Forecast, by Segment 2, 2018-2029
      Table 11: Europe Electric Micro Bus Market Revenue (USD Billion) Forecast, by Segment 3, 2018-2029
      Table 12: Europe Electric Micro Bus Market Revenue (USD Billion) Forecast, by Country, 2018-2029
      Table 13: Latin America Electric Micro Bus Market Revenue (USD Billion) Forecast, by Segment 1, 2018-2029
      Table 14: Latin America Electric Micro Bus Market Revenue (USD Billion) Forecast, by Segment 2, 2018-2029
      Table 15: Latin America Electric Micro Bus Market Revenue (USD Billion) Forecast, by Segment 3, 2018-2029
      Table 16: Latin America Electric Micro Bus Market Revenue (USD Billion) Forecast, by Country, 2018-2029
      Table 17: Asia Pacific Electric Micro Bus Market Revenue (USD Billion) Forecast, by Segment 1, 2018-2029
      Table 18: Asia Pacific Electric Micro Bus Market Revenue (USD Billion) Forecast, by Segment 2, 2018-2029
      Table 19: Asia Pacific Electric Micro Bus Market Revenue (USD Billion) Forecast, by Segment 3, 2018-2029
      Table 20: Asia Pacific Electric Micro Bus Market Revenue (USD Billion) Forecast, by Country, 2018-2029
      Table 21: Middle East & Africa Electric Micro Bus Market Revenue (USD Billion) Forecast, by Segment 1, 2018-2029
      Table 22: Middle East & Africa Electric Micro Bus Market Revenue (USD Billion) Forecast, by Segment 2, 2018-2029
      Table 23: Middle East & Africa Electric Micro Bus Market Revenue (USD Billion) Forecast, by Segment 3, 2018-2029
      Table 24: Middle East & Africa Electric Micro Bus Market Revenue (USD Billion) Forecast, by Country, 2018-2029
      Research Process

      Data Library Research are conducted by industry experts who offer insight on industry structure, market segmentations technology assessment and competitive landscape (CL), and penetration, as well as on emerging trends. Their analysis is based on primary interviews (~ 80%) and secondary research (~ 20%) as well as years of professional expertise in their respective industries. Adding to this, by analysing historical trends and current market positions, our analysts predict where the market will be headed for the next five years. Furthermore, the varying trends of segment & categories geographically presented are also studied and the estimated based on the primary & secondary research.

      In this particular report from the supply side Data Library Research has conducted primary surveys (interviews) with the key level executives (VP, CEO’s, Marketing Director, Business Development Manager and SOFT) of the companies that active & prominent as well as the midsized organization

      FIGURE 1: DLR RESEARH PROCESS

      research-methodology1

      Primary Research

      Extensive primary research was conducted to gain a deeper insight of the market and industry performance. The analysis is based on both primary and secondary research as well as years of professional expertise in the respective industries.

      In addition to analysing current and historical trends, our analysts predict where the market is headed over the next five years.

      It varies by segment for these categories geographically presented in the list of market tables. Speaking about this particular report we have conducted primary surveys (interviews) with the key level executives (VP, CEO’s, Marketing Director, Business Development Manager and many more) of the major players active in the market.

      Secondary Research

      Secondary research was mainly used to collect and identify information useful for the extensive, technical, market-oriented, and Friend’s study of the Global Extra Neutral Alcohol. It was also used to obtain key information about major players, market classification and segmentation according to the industry trends, geographical markets, and developments related to the market and technology perspectives. For this study, analysts have gathered information from various credible sources, such as annual reports, sec filings, journals, white papers, SOFT presentations, and company web sites.

      Market Size Estimation

      Both, top-down and bottom-up approaches were used to estimate and validate the size of the Global market and to estimate the size of various other dependent submarkets in the overall Extra Neutral Alcohol. The key players in the market were identified through secondary research and their market contributions in the respective geographies were determined through primary and secondary research.

      Forecast Model

      research-methodology2