Energy Efficient Sludge Treatment Market Overview and Analysis:
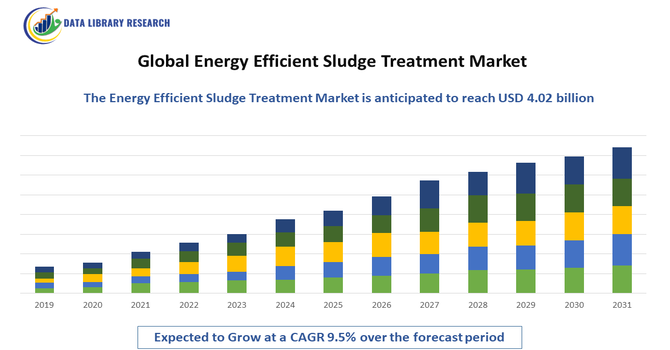
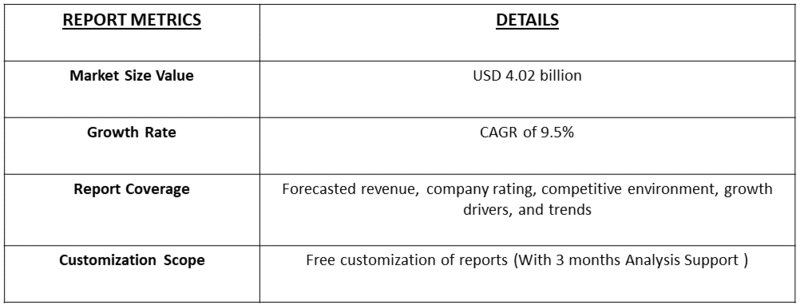
- The Global Energy Efficient Sludge Treatment Market size is estimated to be USD 1.82 billion in 2025 and is expected to reach USD 4.02 billion by 2032 at a CAGR of 9.5% from 2025-2032.
Get Complete Analysis Of The Report - Download Updated Free Sample PDF
The Global Energy Efficient Sludge Treatment Market involves technologies and solutions designed to optimize the treatment and disposal of wastewater sludge while minimizing energy consumption. It encompasses advanced methods such as anaerobic digestion, thermal hydrolysis, and dewatering systems. Growing environmental regulations, rising wastewater generation, and the need for cost-effective, sustainable operations are driving the adoption of energy-efficient sludge treatment solutions worldwide.
The growth of the global energy-efficient sludge treatment market is driven by increasing wastewater generation from industrial, municipal, and agricultural sources, coupled with stringent environmental regulations on sludge disposal. Rising energy costs and the demand for sustainable, cost-effective wastewater management solutions encourage adoption of energy-efficient technologies. Additionally, advancements in anaerobic digestion, thermal hydrolysis, and dewatering systems enhance sludge treatment efficiency while reducing operational costs, carbon footprint, and greenhouse gas emissions, making these solutions attractive for utilities and industries aiming to optimize performance, comply with regulations, and achieve long-term sustainability goals globally.
Energy Efficient Sludge Treatment Market Latest Trends:
The global energy efficient sludge treatment market is increasingly driven by adoption of cutting edge technologies such as anaerobic digestion, thermal hydrolysis, and membrane filtration. Utilities are leveraging smart solutions like IoT sensors and AI-based control systems to fine-tune operations, reduce energy use, and maximize biogas production. Modular and decentralized treatment facilities are also gaining traction, especially in rural or rapidly urbanizing regions. Stricter environmental regulations paired with circular-economy incentives are encouraging installations that recover resources from sludge, such as biogas and biosolids, rather than simply disposing of it.
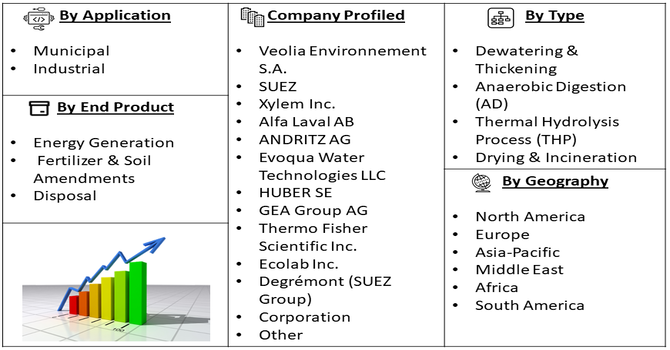
Segmentation: The market for energy-efficient sludge treatment is segmented by Process Type (Dewatering & Thickening, Anaerobic Digestion (AD), Thermal Hydrolysis Process (THP), and Drying & Incineration), Application (Municipal and Industrial), End Product (Energy Generation, Fertilizer & Soil Amendments, and Disposal), and Geography (North America, Europe, Asia-Pacific, Middle East and Africa, and South America). The report provides the value (in USD million) for the above segments.
For Detailed Market Segmentation - Get a Free Sample PDF
Market Drivers:
- Rising Environmental Regulations
The key drivers of the global energy-efficient sludge treatment market is the increasing stringency of environmental regulations worldwide. Governments and regulatory bodies are enforcing strict standards for wastewater discharge, sludge disposal, and greenhouse gas emissions, prompting municipalities and industries to adopt advanced, energy-efficient sludge treatment solutions. Compliance with these regulations not only reduces environmental pollution but also mitigates public health risks. Additionally, incentives and subsidies for sustainable wastewater management encourage investments in technologies such as anaerobic digestion, thermal hydrolysis, and advanced dewatering systems. These solutions help facilities minimize energy consumption, optimize resource recovery, and achieve long-term regulatory compliance, driving robust market growth globally.
- Demand for Energy Recovery and Cost Reduction
The growing need to reduce operational costs and generate renewable energy from wastewater sludge is another major driver. Energy-efficient sludge treatment technologies, particularly anaerobic digestion and thermal hydrolysis, enable facilities to convert sludge into biogas, which can be used for electricity or heat generation. This reduces reliance on conventional energy sources, lowers utility costs, and enhances overall sustainability. Rising energy prices and corporate sustainability initiatives further boost adoption. Additionally, energy recovery from sludge helps industries and municipalities achieve circular economy objectives while reducing carbon footprints, making energy-efficient sludge treatment both economically and environmentally attractive, thereby driving significant market growth.
Market Restraints:
- High Initial Capital Investment
A key restraint for the energy-efficient sludge treatment market is the high initial capital investment required for advanced treatment technologies. Installation of systems such as anaerobic digesters, thermal hydrolysis units, and automated dewatering equipment demands significant upfront costs, which can be a barrier for small-scale wastewater treatment facilities or municipalities with limited budgets. Additionally, ongoing maintenance, skilled personnel requirements, and infrastructure upgrades further increase operational expenditures. This financial burden may slow adoption, particularly in developing regions where funding and technical expertise are limited. Consequently, despite long-term operational savings and energy benefits, the high initial investment continues to restrain market growth in certain areas globally.
Socio Economic Impact on Energy Efficient Sludge Treatment Market
Energy efficient sludge treatment has significant socioeconomic benefits, enabling more sustainable wastewater management while lowering operational costs for municipalities. By recovering biogas and converting sludge into fertilizer, treatment plants contribute to circular economies and renewable energy production. These technologies reduce reliance on landfill disposal, decreasing environmental pollution and public health risks. Moreover, investments in infrastructure modernization — supported by government funding — drive job creation in engineering, operations, and R&D. For industrial sectors, efficient sludge treatment can improve corporate sustainability and regulatory compliance, enhancing both community welfare and economic resilience.
Segmental Analysis:
- Anaerobic Digestion (AD) segment is expected to witness highest growth over the forecast period
The Anaerobic Digestion (AD) segment is expected to witness the highest growth over the forecast period due to its efficiency in converting organic sludge into biogas while significantly reducing waste volume. AD offers environmental and economic benefits, including energy recovery, reduced greenhouse gas emissions, and decreased disposal costs. Increasing government support and incentives for renewable energy projects further encourage adoption. Technological advancements in continuous monitoring, automated feeding systems, and hybrid digestion processes are improving process efficiency and scalability. Rising demand from municipal and industrial wastewater treatment facilities for sustainable, cost-effective solutions positions AD as the leading sludge treatment method globally, driving substantial market growth.
- Municipal segment is expected to witness highest growth over the forecast period
The Municipal segment is projected to witness the highest growth over the forecast period as cities face increasing wastewater generation due to rapid urbanization and population growth. Municipal wastewater treatment facilities are under pressure to manage large volumes of sludge efficiently while complying with stringent environmental regulations. Energy-efficient sludge treatment solutions, such as anaerobic digestion and thermal hydrolysis, help municipalities reduce operational costs and recover energy and resources from waste. Investments in modern infrastructure, government initiatives supporting sustainable urban development, and the growing need to minimize landfill dependency are fueling adoption. Consequently, municipal applications dominate market demand and drive overall growth in the global energy-efficient sludge treatment market.
- Energy Generation segment is expected to witness highest growth over the forecast period
The Energy Generation segment is expected to witness the highest growth due to the increasing focus on converting sludge into renewable energy sources. Technologies like anaerobic digestion and incineration allow facilities to produce biogas, electricity, and heat from wastewater sludge, reducing reliance on fossil fuels and lowering operational costs. Rising energy prices, government incentives for clean energy, and sustainability targets are motivating utilities and industries to adopt energy recovery solutions. Additionally, integrating energy generation with wastewater management helps reduce greenhouse gas emissions and supports circular economy initiatives. This dual benefit of waste management and energy production drives rapid growth in the energy generation application segment.
- Asia Pacific region is expected to witness highest growth over the forecast period
The Asia Pacific region is anticipated to witness the highest growth in the energy-efficient sludge treatment market due to rapid industrialization, urbanization, and increasing wastewater generation. Governments across China, India, Japan, and Southeast Asia are implementing stringent environmental regulations and offering incentives to promote sustainable wastewater management. The rising need for energy-efficient treatment solutions, combined with a growing focus on renewable energy recovery, drives adoption. Investments in modern wastewater infrastructure, coupled with the region’s large population and industrial base, create significant demand for sludge-to-energy technologies. Technological collaborations and increasing awareness of environmental sustainability further strengthen the market growth trajectory in the Asia Pacific region.
To Learn More About This Report - Request a Free Sample Copy
Energy Efficient Sludge Treatment Market Competitive Landscape:
The competitive landscape of the energy efficient sludge treatment market features global engineering and water-treatment heavyweights like Veolia, SUEZ, Xylem, and Evoqua, alongside specialized technology companies. These firms compete by offering advanced dewatering systems, anaerobic digesters, and thermal hydrolysis units. Players also differentiate through smart automation, energy-recovery solutions, and process integration. Startups and niche providers are also emerging, focusing on modular, decentralized, or scalable systems. Strategic mergers, technology partnerships, and research-driven collaboration are common as suppliers seek to address sustainability mandates and meet growing infrastructure modernization demand.
The 20 major players for above market:
- Veolia Environnement S.A.
- SUEZ
- Xylem Inc.
- Alfa Laval AB
- ANDRITZ AG
- Evoqua Water Technologies LLC
- HUBER SE
- GEA Group AG
- Thermo Fisher Scientific Inc.
- Ecolab Inc.
- Degrémont (SUEZ Group)
- Lystek International, Inc.
- Sedron Technologies
- Hitachi Zosen Corporation
- Komline-Sanderson Engineering Corporation
- Schwing Bioset, Inc.
- Kubota Corporation
- WAMGROUP S.p.A.
- Phoenix Process Equipment Co.
- Shenzhou Machinery Equipment Co
Recent Development
- In September 2025, IIT Madras-incubated start-up JSP Enviro developed an innovative wastewater treatment technology, the Bio-Electrochemical Anaerobic Digestor System (BEADS), and successfully implemented it across industries in Tamil Nadu. The system enabled electricity-free, chemical-free treatment, minimized sludge production, and facilitated energy recovery, carbon reduction, and cost savings. With proven installations in Erode and Perundurai, this breakthrough demonstrated that sustainable wastewater management is profitable, positively influencing adoption trends and accelerating growth in the global energy-efficient sludge treatment market.
- In February 2024, ABB launched the ABB Ability Energy Management for Water and Wastewater – OPTIMAX solution to help plants identify and reduce unnecessary energy losses. By enabling real-time control, monitoring, and optimization of multiple assets, the tool reduced energy consumption, chemical usage, and greenhouse gas emissions in wastewater treatment facilities. Its successful implementation demonstrated enhanced operational efficiency and sustainability, encouraging broader adoption of energy-efficient solutions and positively influencing growth in the global energy-efficient sludge treatment market.
Frequently Asked Questions (FAQ) :
Q1. What are the main growth-driving factors for this market?
The primary driver is the urgent need for reduced operating costs in wastewater treatment plants, where energy consumption is a major expense. Energy-efficient systems, such as advanced anaerobic digestion, not only treat sludge effectively but also generate biogas (a renewable energy source) that can power the facility. Furthermore, increasingly strict environmental regulations on final sludge disposal and the global push toward a circular economy mandate sustainable, low-emission treatment solutions, strongly encouraging the adoption of these modern technologies.
Q2. What are the main restraining factors for this market?
The biggest constraint is the high initial capital investment required to upgrade or implement new, sophisticated energy-efficient treatment technologies. Older municipal facilities often face budget limitations, making it challenging to finance expensive equipment like thermal hydrolysis or advanced dewatering units. Additionally, the variability in sludge composition and volume can impact the efficiency of certain treatment processes, requiring customization that further increases project complexity and cost, slowing down widespread, standardized adoption.
Q3. Which segment is expected to witness high growth?
The Anaerobic Digestion Segment is projected to witness the highest growth. This biological process efficiently stabilizes sludge and, critically, converts organic matter into usable biogas, generating renewable energy for the plant. Advances in co-digestion (mixing sewage sludge with other organic waste) and pre-treatment technologies (like thermal hydrolysis) significantly boost biogas production and reduce sludge volume. This inherent ability to combine environmental compliance with self-sustaining energy creation makes it the most attractive and fastest-growing solution globally.
Q4. Who are the top major players for this market?
The market is led by global engineering and environmental technology firms that offer integrated sludge handling solutions. Top major players include Veolia Environnement S.A., Suez S.A., Evoqua Water Technologies LLC, and Xylem Inc. These companies compete by offering a comprehensive suite of technologies, including advanced dewatering equipment, thermal processing, and specialized biological treatment systems. Their strong global presence, deep technical expertise, and ability to manage large-scale municipal projects solidify their leadership.
Q5. Which country is the largest player?
China, located within the Asia-Pacific region, is expected to be the largest market player in terms of adoption and investment. This is driven by massive government mandates to clean up the environment and address rapid urbanization, which creates huge volumes of wastewater and sludge. The country's strong focus on developing sustainable infrastructure and its willingness to invest heavily in large-scale, modern energy-from-waste projects, including advanced anaerobic digestion facilities, ensures it leads global spending on efficient sludge treatment systems.
List of Figures
Figure 1: Global Energy Efficient Sludge Treatment Market Revenue Breakdown (USD Billion, %) by Region, 2022 & 2029
Figure 2: Global Energy Efficient Sludge Treatment Market Value Share (%), By Segment 1, 2022 & 2029
Figure 3: Global Energy Efficient Sludge Treatment Market Forecast (USD Billion), by Sub-Segment 1, 2018-2029
Figure 4: Global Energy Efficient Sludge Treatment Market Forecast (USD Billion), by Sub-Segment 2, 2018-2029
Figure 5: Global Energy Efficient Sludge Treatment Market Value Share (%), By Segment 2, 2022 & 2029
Figure 6: Global Energy Efficient Sludge Treatment Market Forecast (USD Billion), by Sub-Segment 1, 2018-2029
Figure 7: Global Energy Efficient Sludge Treatment Market Forecast (USD Billion), by Sub-Segment 2, 2018-2029
Figure 8: Global Energy Efficient Sludge Treatment Market Forecast (USD Billion), by Sub-Segment 3, 2018-2029
Figure 9: Global Energy Efficient Sludge Treatment Market Forecast (USD Billion), by Others, 2018-2029
Figure 10: Global Energy Efficient Sludge Treatment Market Value Share (%), By Segment 3, 2022 & 2029
Figure 11: Global Energy Efficient Sludge Treatment Market Forecast (USD Billion), by Sub-Segment 1, 2018-2029
Figure 12: Global Energy Efficient Sludge Treatment Market Forecast (USD Billion), by Sub-Segment 2, 2018-2029
Figure 13: Global Energy Efficient Sludge Treatment Market Forecast (USD Billion), by Sub-Segment 3, 2018-2029
Figure 14: Global Energy Efficient Sludge Treatment Market Forecast (USD Billion), by Others, 2018-2029
Figure 15: Global Energy Efficient Sludge Treatment Market Value (USD Billion), by Region, 2022 & 2029
Figure 16: North America Energy Efficient Sludge Treatment Market Value Share (%), By Segment 1, 2022 & 2029
Figure 17: North America Energy Efficient Sludge Treatment Market Forecast (USD Billion), by Sub-Segment 1, 2018-2029
Figure 18: North America Energy Efficient Sludge Treatment Market Forecast (USD Billion), by Sub-Segment 2, 2018-2029
Figure 19: North America Energy Efficient Sludge Treatment Market Value Share (%), By Segment 2, 2022 & 2029
Figure 20: North America Energy Efficient Sludge Treatment Market Forecast (USD Billion), by Sub-Segment 1, 2018-2029
Figure 21: North America Energy Efficient Sludge Treatment Market Forecast (USD Billion), by Sub-Segment 2, 2018-2029
Figure 22: North America Energy Efficient Sludge Treatment Market Forecast (USD Billion), by Sub-Segment 3, 2018-2029
Figure 23: North America Energy Efficient Sludge Treatment Market Forecast (USD Billion), by Others, 2018-2029
Figure 24: North America Energy Efficient Sludge Treatment Market Value Share (%), By Segment 3, 2022 & 2029
Figure 25: North America Energy Efficient Sludge Treatment Market Forecast (USD Billion), by Sub-Segment 1, 2018-2029
Figure 26: North America Energy Efficient Sludge Treatment Market Forecast (USD Billion), by Sub-Segment 2, 2018-2029
Figure 27: North America Energy Efficient Sludge Treatment Market Forecast (USD Billion), by Sub-Segment 3, 2018-2029
Figure 28: North America Energy Efficient Sludge Treatment Market Forecast (USD Billion), by Others, 2018-2029
Figure 29: North America Energy Efficient Sludge Treatment Market Forecast (USD Billion), by U.S., 2018-2029
Figure 30: North America Energy Efficient Sludge Treatment Market Forecast (USD Billion), by Canada, 2018-2029
Figure 31: Latin America Energy Efficient Sludge Treatment Market Value Share (%), By Segment 1, 2022 & 2029
Figure 32: Latin America Energy Efficient Sludge Treatment Market Forecast (USD Billion), by Sub-Segment 1, 2018-2029
Figure 33: Latin America Energy Efficient Sludge Treatment Market Forecast (USD Billion), by Sub-Segment 2, 2018-2029
Figure 34: Latin America Energy Efficient Sludge Treatment Market Value Share (%), By Segment 2, 2022 & 2029
Figure 35: Latin America Energy Efficient Sludge Treatment Market Forecast (USD Billion), by Sub-Segment 1, 2018-2029
Figure 36: Latin America Energy Efficient Sludge Treatment Market Forecast (USD Billion), by Sub-Segment 2, 2018-2029
Figure 37: Latin America Energy Efficient Sludge Treatment Market Forecast (USD Billion), by Sub-Segment 3, 2018-2029
Figure 38: Latin America Energy Efficient Sludge Treatment Market Forecast (USD Billion), by Others, 2018-2029
Figure 39: Latin America Energy Efficient Sludge Treatment Market Value Share (%), By Segment 3, 2022 & 2029
Figure 40: Latin America Energy Efficient Sludge Treatment Market Forecast (USD Billion), by Sub-Segment 1, 2018-2029
Figure 41: Latin America Energy Efficient Sludge Treatment Market Forecast (USD Billion), by Sub-Segment 2, 2018-2029
Figure 42: Latin America Energy Efficient Sludge Treatment Market Forecast (USD Billion), by Sub-Segment 3, 2018-2029
Figure 43: Latin America Energy Efficient Sludge Treatment Market Forecast (USD Billion), by Others, 2018-2029
Figure 44: Latin America Energy Efficient Sludge Treatment Market Forecast (USD Billion), by Brazil, 2018-2029
Figure 45: Latin America Energy Efficient Sludge Treatment Market Forecast (USD Billion), by Mexico, 2018-2029
Figure 46: Latin America Energy Efficient Sludge Treatment Market Forecast (USD Billion), by Rest of Latin America, 2018-2029
Figure 47: Europe Energy Efficient Sludge Treatment Market Value Share (%), By Segment 1, 2022 & 2029
Figure 48: Europe Energy Efficient Sludge Treatment Market Forecast (USD Billion), by Sub-Segment 1, 2018-2029
Figure 49: Europe Energy Efficient Sludge Treatment Market Forecast (USD Billion), by Sub-Segment 2, 2018-2029
Figure 50: Europe Energy Efficient Sludge Treatment Market Value Share (%), By Segment 2, 2022 & 2029
Figure 51: Europe Energy Efficient Sludge Treatment Market Forecast (USD Billion), by Sub-Segment 1, 2018-2029
Figure 52: Europe Energy Efficient Sludge Treatment Market Forecast (USD Billion), by Sub-Segment 2, 2018-2029
Figure 53: Europe Energy Efficient Sludge Treatment Market Forecast (USD Billion), by Sub-Segment 3, 2018-2029
Figure 54: Europe Energy Efficient Sludge Treatment Market Forecast (USD Billion), by Others, 2018-2029
Figure 55: Europe Energy Efficient Sludge Treatment Market Value Share (%), By Segment 3, 2022 & 2029
Figure 56: Europe Energy Efficient Sludge Treatment Market Forecast (USD Billion), by Sub-Segment 1, 2018-2029
Figure 57: Europe Energy Efficient Sludge Treatment Market Forecast (USD Billion), by Sub-Segment 2, 2018-2029
Figure 58: Europe Energy Efficient Sludge Treatment Market Forecast (USD Billion), by Sub-Segment 3, 2018-2029
Figure 59: Europe Energy Efficient Sludge Treatment Market Forecast (USD Billion), by Others, 2018-2029
Figure 60: Europe Energy Efficient Sludge Treatment Market Forecast (USD Billion), by U.K., 2018-2029
Figure 61: Europe Energy Efficient Sludge Treatment Market Forecast (USD Billion), by Germany, 2018-2029
Figure 62: Europe Energy Efficient Sludge Treatment Market Forecast (USD Billion), by France, 2018-2029
Figure 63: Europe Energy Efficient Sludge Treatment Market Forecast (USD Billion), by Italy, 2018-2029
Figure 64: Europe Energy Efficient Sludge Treatment Market Forecast (USD Billion), by Spain, 2018-2029
Figure 65: Europe Energy Efficient Sludge Treatment Market Forecast (USD Billion), by Russia, 2018-2029
Figure 66: Europe Energy Efficient Sludge Treatment Market Forecast (USD Billion), by Rest of Europe, 2018-2029
Figure 67: Asia Pacific Energy Efficient Sludge Treatment Market Value Share (%), By Segment 1, 2022 & 2029
Figure 68: Asia Pacific Energy Efficient Sludge Treatment Market Forecast (USD Billion), by Sub-Segment 1, 2018-2029
Figure 69: Asia Pacific Energy Efficient Sludge Treatment Market Forecast (USD Billion), by Sub-Segment 2, 2018-2029
Figure 70: Asia Pacific Energy Efficient Sludge Treatment Market Value Share (%), By Segment 2, 2022 & 2029
Figure 71: Asia Pacific Energy Efficient Sludge Treatment Market Forecast (USD Billion), by Sub-Segment 1, 2018-2029
Figure 72: Asia Pacific Energy Efficient Sludge Treatment Market Forecast (USD Billion), by Sub-Segment 2, 2018-2029
Figure 73: Asia Pacific Energy Efficient Sludge Treatment Market Forecast (USD Billion), by Sub-Segment 3, 2018-2029
Figure 74: Asia Pacific Energy Efficient Sludge Treatment Market Forecast (USD Billion), by Others, 2018-2029
Figure 75: Asia Pacific Energy Efficient Sludge Treatment Market Value Share (%), By Segment 3, 2022 & 2029
Figure 76: Asia Pacific Energy Efficient Sludge Treatment Market Forecast (USD Billion), by Sub-Segment 1, 2018-2029
Figure 77: Asia Pacific Energy Efficient Sludge Treatment Market Forecast (USD Billion), by Sub-Segment 2, 2018-2029
Figure 78: Asia Pacific Energy Efficient Sludge Treatment Market Forecast (USD Billion), by Sub-Segment 3, 2018-2029
Figure 79: Asia Pacific Energy Efficient Sludge Treatment Market Forecast (USD Billion), by Others, 2018-2029
Figure 80: Asia Pacific Energy Efficient Sludge Treatment Market Forecast (USD Billion), by China, 2018-2029
Figure 81: Asia Pacific Energy Efficient Sludge Treatment Market Forecast (USD Billion), by India, 2018-2029
Figure 82: Asia Pacific Energy Efficient Sludge Treatment Market Forecast (USD Billion), by Japan, 2018-2029
Figure 83: Asia Pacific Energy Efficient Sludge Treatment Market Forecast (USD Billion), by Australia, 2018-2029
Figure 84: Asia Pacific Energy Efficient Sludge Treatment Market Forecast (USD Billion), by Southeast Asia, 2018-2029
Figure 85: Asia Pacific Energy Efficient Sludge Treatment Market Forecast (USD Billion), by Rest of Asia Pacific, 2018-2029
Figure 86: Middle East & Africa Energy Efficient Sludge Treatment Market Value Share (%), By Segment 1, 2022 & 2029
Figure 87: Middle East & Africa Energy Efficient Sludge Treatment Market Forecast (USD Billion), by Sub-Segment 1, 2018-2029
Figure 88: Middle East & Africa Energy Efficient Sludge Treatment Market Forecast (USD Billion), by Sub-Segment 2, 2018-2029
Figure 89: Middle East & Africa Energy Efficient Sludge Treatment Market Value Share (%), By Segment 2, 2022 & 2029
Figure 90: Middle East & Africa Energy Efficient Sludge Treatment Market Forecast (USD Billion), by Sub-Segment 1, 2018-2029
Figure 91: Middle East & Africa Energy Efficient Sludge Treatment Market Forecast (USD Billion), by Sub-Segment 2, 2018-2029
Figure 92: Middle East & Africa Energy Efficient Sludge Treatment Market Forecast (USD Billion), by Sub-Segment 3, 2018-2029
Figure 93: Middle East & Africa Energy Efficient Sludge Treatment Market Forecast (USD Billion), by Others, 2018-2029
Figure 94: Middle East & Africa Energy Efficient Sludge Treatment Market Value Share (%), By Segment 3, 2022 & 2029
Figure 95: Middle East & Africa Energy Efficient Sludge Treatment Market Forecast (USD Billion), by Sub-Segment 1, 2018-2029
Figure 96: Middle East & Africa Energy Efficient Sludge Treatment Market Forecast (USD Billion), by Sub-Segment 2, 2018-2029
Figure 97: Middle East & Africa Energy Efficient Sludge Treatment Market Forecast (USD Billion), by Sub-Segment 3, 2018-2029
Figure 98: Middle East & Africa Energy Efficient Sludge Treatment Market Forecast (USD Billion), by Others, 2018-2029
Figure 99: Middle East & Africa Energy Efficient Sludge Treatment Market Forecast (USD Billion), by GCC, 2018-2029
Figure 100: Middle East & Africa Energy Efficient Sludge Treatment Market Forecast (USD Billion), by South Africa, 2018-2029
Figure 101: Middle East & Africa Energy Efficient Sludge Treatment Market Forecast (USD Billion), by Rest of Middle East & Africa, 2018-2029
List of Tables
Table 1: Global Energy Efficient Sludge Treatment Market Revenue (USD Billion) Forecast, by Segment 1, 2018-2029
Table 2: Global Energy Efficient Sludge Treatment Market Revenue (USD Billion) Forecast, by Segment 2, 2018-2029
Table 3: Global Energy Efficient Sludge Treatment Market Revenue (USD Billion) Forecast, by Segment 3, 2018-2029
Table 4: Global Energy Efficient Sludge Treatment Market Revenue (USD Billion) Forecast, by Region, 2018-2029
Table 5: North America Energy Efficient Sludge Treatment Market Revenue (USD Billion) Forecast, by Segment 1, 2018-2029
Table 6: North America Energy Efficient Sludge Treatment Market Revenue (USD Billion) Forecast, by Segment 2, 2018-2029
Table 7: North America Energy Efficient Sludge Treatment Market Revenue (USD Billion) Forecast, by Segment 3, 2018-2029
Table 8: North America Energy Efficient Sludge Treatment Market Revenue (USD Billion) Forecast, by Country, 2018-2029
Table 9: Europe Energy Efficient Sludge Treatment Market Revenue (USD Billion) Forecast, by Segment 1, 2018-2029
Table 10: Europe Energy Efficient Sludge Treatment Market Revenue (USD Billion) Forecast, by Segment 2, 2018-2029
Table 11: Europe Energy Efficient Sludge Treatment Market Revenue (USD Billion) Forecast, by Segment 3, 2018-2029
Table 12: Europe Energy Efficient Sludge Treatment Market Revenue (USD Billion) Forecast, by Country, 2018-2029
Table 13: Latin America Energy Efficient Sludge Treatment Market Revenue (USD Billion) Forecast, by Segment 1, 2018-2029
Table 14: Latin America Energy Efficient Sludge Treatment Market Revenue (USD Billion) Forecast, by Segment 2, 2018-2029
Table 15: Latin America Energy Efficient Sludge Treatment Market Revenue (USD Billion) Forecast, by Segment 3, 2018-2029
Table 16: Latin America Energy Efficient Sludge Treatment Market Revenue (USD Billion) Forecast, by Country, 2018-2029
Table 17: Asia Pacific Energy Efficient Sludge Treatment Market Revenue (USD Billion) Forecast, by Segment 1, 2018-2029
Table 18: Asia Pacific Energy Efficient Sludge Treatment Market Revenue (USD Billion) Forecast, by Segment 2, 2018-2029
Table 19: Asia Pacific Energy Efficient Sludge Treatment Market Revenue (USD Billion) Forecast, by Segment 3, 2018-2029
Table 20: Asia Pacific Energy Efficient Sludge Treatment Market Revenue (USD Billion) Forecast, by Country, 2018-2029
Table 21: Middle East & Africa Energy Efficient Sludge Treatment Market Revenue (USD Billion) Forecast, by Segment 1, 2018-2029
Table 22: Middle East & Africa Energy Efficient Sludge Treatment Market Revenue (USD Billion) Forecast, by Segment 2, 2018-2029
Table 23: Middle East & Africa Energy Efficient Sludge Treatment Market Revenue (USD Billion) Forecast, by Segment 3, 2018-2029
Table 24: Middle East & Africa Energy Efficient Sludge Treatment Market Revenue (USD Billion) Forecast, by Country, 2018-2029
Research Process
Data Library Research are conducted by industry experts who offer insight on
industry structure, market segmentations technology assessment and competitive landscape (CL), and penetration, as well as on emerging trends. Their analysis is based on primary interviews (~ 80%) and secondary research (~ 20%) as well as years of professional expertise in their respective industries. Adding to this, by analysing historical trends and current market positions, our analysts predict where the market will be headed for the next five years. Furthermore, the varying trends of segment & categories geographically presented are also studied and the estimated based on the primary & secondary research.
In this particular report from the supply side Data Library Research has conducted primary surveys (interviews) with the key level executives (VP, CEO’s, Marketing Director, Business Development Manager
and SOFT) of the companies that active & prominent as well as the midsized organization
FIGURE 1: DLR RESEARH PROCESS
![research-methodology1]()
Primary Research
Extensive primary research was conducted to gain a deeper insight of the market and industry performance. The analysis is based on both primary and secondary research as well as years of professional expertise in the respective industries.
In addition to analysing current and historical trends, our analysts predict where the market is headed over the next five years.
It varies by segment for these categories geographically presented in the list of market tables. Speaking about this particular report we have conducted primary surveys (interviews) with the key level executives (VP, CEO’s, Marketing Director, Business Development Manager and many more) of the major players active in the market.
Secondary Research
Secondary research was mainly used to collect and identify information useful for the extensive, technical, market-oriented, and Friend’s study of the Global Extra Neutral Alcohol. It was also used to obtain key information about major players, market classification and segmentation according to the industry trends, geographical markets, and developments related to the market and technology perspectives. For this study, analysts have gathered information from various credible sources, such as annual reports, sec filings, journals, white papers, SOFT presentations, and company web sites.
Market Size Estimation
Both, top-down and bottom-up approaches were used to estimate and validate the size of the Global market and to estimate the size of various other dependent submarkets in the overall Extra Neutral Alcohol. The key players in the market were identified through secondary research and their market contributions in the respective geographies were determined through primary and secondary research.
Forecast Model
![research-methodology2]()