Industrial Energy Management Systems Market Overview
In the last few years, the global industrial sector has grown at a substantial rate. Growing investments in this sector, as well as the use of sophisticated technologies, have significantly advanced it. Energy consumption in many sectors has increased as a result of increased production operations in numerous industries.
The global industrial energy management system market is predicted to expand significantly, and several factors are attributed to this quick expansion. The market is being propelled by the growing desire to achieve energy efficiency. Furthermore, the increased usage of energy management solutions in industrial development across several sectors of the market is boosting the overall market's expansion. As a result, the market is predicted to grow in revenue in the next years.
However, the high initial investment cost, as well as the extended playback time, may limit market expansion. This could be a setback for both regional and small- and medium-sized businesses.
However, factors such as increased awareness of energy efficiency among all users for residential reasons are likely to contribute to the market's overall growth. This is also predicted to generate a significant expansion for market players in home-based services and solutions, resulting in increased profit. In addition, an increase in demand for energy-efficient solutions in end-use categories such as commercial sites, office spaces, and businesses will drive market expansion. This is being done in order to reduce operational expenses in industries through efficient energy use by developing EMS solutions in the future.
| Report Metric |
Details |
| Market size available for years |
2023–2030 |
| Base year considered |
2023 |
| Forecast period |
2024–2030 |
| Forecast unit |
Value (USD Million) |
| Segments covered |
Component, Services, Vertical, and Region. |
| Regions covered |
North America (the U.S. and Canada), Europe (UK, Germany, France, Italy, Spain, Russia, Rest of Europe), Asia-Pacific (China, India, Japan, Australia, South East Asia, Rest of Asia Pacific), Latin America and the Middle East and Africa (Brazil, Saudi Arabia, UAE, Rest of LAMEA) |
| Companies covered |
Honeywell International Inc., Delta Electronics, Inc., Yokogawa Electric Corporation, and Delta Electronics, Inc. |
Covid-19 Impact on Industrial Energy Management Systems Market
Like many other industries, COVID-19 badly knocked the electronic and semiconductor industries. This unprecedented event has impacted nearly 230 countries in just a few weeks, resulting in the forced shutdown of manufacturing and transportation activities within and across the countries. This has directly affected the overall sector's growth. It is estimated that COVID-19 to leave more than USD 30 billion impacts on the electronics and semiconductor industry. The sector is majorly affected due to transport restrictions on major electronics and semiconductor raw material providers. However, the emerging need for semiconductors in several industries will offer rapid market recovery over the future period.
Industrial Energy Management Systems Market Segment Overview
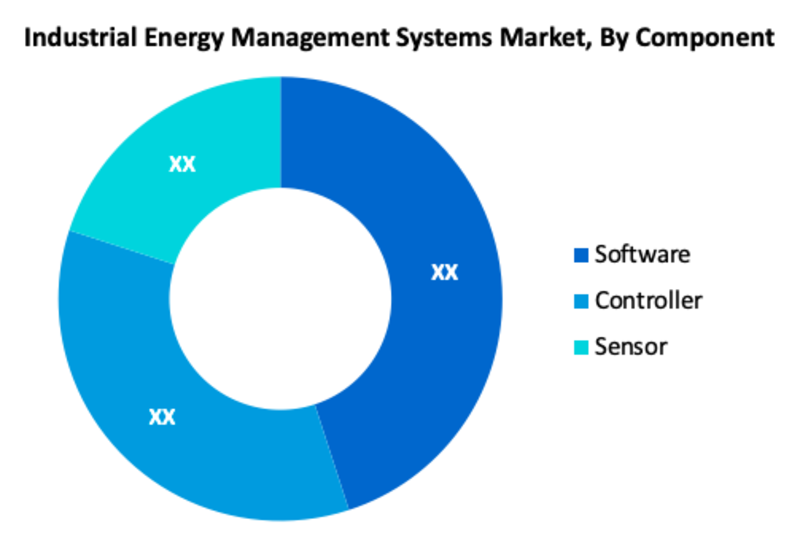
By Component, Software is one of the most prominent segments in the global Industrial Energy Management Systems Market. In addition to this, rising awareness of energy usage, efficiency, and demand control, as well as the resulting reduction in operating costs, boosted demand in this market. In reality, enterprises that use a lot of energy are more likely to make a lot of money if they integrate their industrial energy consumption systems because it will help them generate more profit by lowering their energy costs. The global industrial energy management systems market is likely to increase significantly in the near future as a result of all of these factors.
Industrial Energy Management Systems Market, By Component
· Software
· Controller
· Sensor
Industrial Energy Management Systems Market, By Services
· Consulting and Training
· Maintenance
· Implementation and Integration
· Monitoring and Control
Industrial Energy Management Systems Market, By Vertical
· Healthcare
· Enterprise
· Manufacturing
· Telecom and IT
· Power and Energy
Industrial Energy Management Systems Regional Overview
The global Industrial Energy Management Systems market is divided into North America, Europe, Asia Pacific, Latin America, and the Middle East & Africa. In recent years, Europe and North America accounted for a sizable market share. On the other hand, due to rising urbanization, the developing economies of the Asia Pacific and Latin America are considered as a potential possibility for growth in the years ahead.
Industrial Energy Management Systems Market, By Geography
· North America (US & Canada)
· Europe (UK, Germany, France, Italy, Spain, Russia & Rest of Europe)
· Asia-Pacific (Japan, China, India, Australia, & South Korea, & Rest of Asia-Pacific)
· LAMEA (Brazil, Saudi Arabia, UAE & Rest of LAMEA)
Industrial Energy Management Systems Market, Key Players
· Honeywell International Inc.
· Delta Electronics, Inc.
· Yokogawa Electric Corporation
· Delta Electronics, Inc.
Frequently Asked Questions (FAQ) :
Q1. What are the driving factors for the global Industrial Energy Management Systems market?
The increased usage of energy management solutions in industrial development across several sectors of the market is boosting the overall market's expansion
Q2. What are the restraining factors for the global Industrial Energy Management Systems market?
The high initial investment cost, as well as the extended playback time, may limit market expansion.
Q3. Which segment is projected to hold the largest share in the global Industrial Energy Management Systems market?
The software segment is projected to hold the largest share in the global Industrial Energy Management Systems market
Q4. Which region holds the largest share in the global Industrial Energy Management Systems market?
North America holds the largest share in the global Industrial Energy Management Systems market.
Q5. Which are the prominent players in the global Industrial Energy Management Systems market?
Honeywell International Inc., Delta Electronics, Inc., Yokogawa Electric Corporation, and Delta Electronics, Inc. are some key players in the global Industrial Energy Management Systems market
List of Figures
Figure 1: Global Energy Management System in Industrial Market Revenue Breakdown (USD Billion, %) by Region, 2019 & 2027
Figure 2: Global Energy Management System in Industrial Market Value Share (%), By Segment 1, 2019 & 2027
Figure 3: Global Energy Management System in Industrial Market Forecast (USD Billion), by Sub-Segment 1, 2016-2027
Figure 4: Global Energy Management System in Industrial Market Forecast (USD Billion), by Sub-Segment 2, 2016-2027
Figure 5: Global Energy Management System in Industrial Market Value Share (%), By Segment 2, 2019 & 2027
Figure 6: Global Energy Management System in Industrial Market Forecast (USD Billion), by Sub-Segment 1, 2016-2027
Figure 7: Global Energy Management System in Industrial Market Forecast (USD Billion), by Sub-Segment 2, 2016-2027
Figure 8: Global Energy Management System in Industrial Market Forecast (USD Billion), by Sub-Segment 3, 2016-2027
Figure 9: Global Energy Management System in Industrial Market Forecast (USD Billion), by Others, 2016-2027
Figure 10: Global Energy Management System in Industrial Market Value Share (%), By Segment 3, 2019 & 2027
Figure 11: Global Energy Management System in Industrial Market Forecast (USD Billion), by Sub-Segment 1, 2016-2027
Figure 12: Global Energy Management System in Industrial Market Forecast (USD Billion), by Sub-Segment 2, 2016-2027
Figure 13: Global Energy Management System in Industrial Market Forecast (USD Billion), by Sub-Segment 3, 2016-2027
Figure 14: Global Energy Management System in Industrial Market Forecast (USD Billion), by Others, 2016-2027
Figure 15: Global Energy Management System in Industrial Market Value (USD Billion), by Region, 2019 & 2027
Figure 16: North America Energy Management System in Industrial Market Value Share (%), By Segment 1, 2019 & 2027
Figure 17: North America Energy Management System in Industrial Market Forecast (USD Billion), by Sub-Segment 1, 2016-2027
Figure 18: North America Energy Management System in Industrial Market Forecast (USD Billion), by Sub-Segment 2, 2016-2027
Figure 19: North America Energy Management System in Industrial Market Value Share (%), By Segment 2, 2019 & 2027
Figure 20: North America Energy Management System in Industrial Market Forecast (USD Billion), by Sub-Segment 1, 2016-2027
Figure 21: North America Energy Management System in Industrial Market Forecast (USD Billion), by Sub-Segment 2, 2016-2027
Figure 22: North America Energy Management System in Industrial Market Forecast (USD Billion), by Sub-Segment 3, 2016-2027
Figure 23: North America Energy Management System in Industrial Market Forecast (USD Billion), by Others, 2016-2027
Figure 24: North America Energy Management System in Industrial Market Value Share (%), By Segment 3, 2019 & 2027
Figure 25: North America Energy Management System in Industrial Market Forecast (USD Billion), by Sub-Segment 1, 2016-2027
Figure 26: North America Energy Management System in Industrial Market Forecast (USD Billion), by Sub-Segment 2, 2016-2027
Figure 27: North America Energy Management System in Industrial Market Forecast (USD Billion), by Sub-Segment 3, 2016-2027
Figure 28: North America Energy Management System in Industrial Market Forecast (USD Billion), by Others, 2016-2027
Figure 29: North America Energy Management System in Industrial Market Forecast (USD Billion), by U.S., 2016-2027
Figure 30: North America Energy Management System in Industrial Market Forecast (USD Billion), by Canada, 2016-2027
Figure 31: Latin America Energy Management System in Industrial Market Value Share (%), By Segment 1, 2019 & 2027
Figure 32: Latin America Energy Management System in Industrial Market Forecast (USD Billion), by Sub-Segment 1, 2016-2027
Figure 33: Latin America Energy Management System in Industrial Market Forecast (USD Billion), by Sub-Segment 2, 2016-2027
Figure 34: Latin America Energy Management System in Industrial Market Value Share (%), By Segment 2, 2019 & 2027
Figure 35: Latin America Energy Management System in Industrial Market Forecast (USD Billion), by Sub-Segment 1, 2016-2027
Figure 36: Latin America Energy Management System in Industrial Market Forecast (USD Billion), by Sub-Segment 2, 2016-2027
Figure 37: Latin America Energy Management System in Industrial Market Forecast (USD Billion), by Sub-Segment 3, 2016-2027
Figure 38: Latin America Energy Management System in Industrial Market Forecast (USD Billion), by Others, 2016-2027
Figure 39: Latin America Energy Management System in Industrial Market Value Share (%), By Segment 3, 2019 & 2027
Figure 40: Latin America Energy Management System in Industrial Market Forecast (USD Billion), by Sub-Segment 1, 2016-2027
Figure 41: Latin America Energy Management System in Industrial Market Forecast (USD Billion), by Sub-Segment 2, 2016-2027
Figure 42: Latin America Energy Management System in Industrial Market Forecast (USD Billion), by Sub-Segment 3, 2016-2027
Figure 43: Latin America Energy Management System in Industrial Market Forecast (USD Billion), by Others, 2016-2027
Figure 44: Latin America Energy Management System in Industrial Market Forecast (USD Billion), by Brazil, 2016-2027
Figure 45: Latin America Energy Management System in Industrial Market Forecast (USD Billion), by Mexico, 2016-2027
Figure 46: Latin America Energy Management System in Industrial Market Forecast (USD Billion), by Rest of Latin America, 2016-2027
Figure 47: Europe Energy Management System in Industrial Market Value Share (%), By Segment 1, 2019 & 2027
Figure 48: Europe Energy Management System in Industrial Market Forecast (USD Billion), by Sub-Segment 1, 2016-2027
Figure 49: Europe Energy Management System in Industrial Market Forecast (USD Billion), by Sub-Segment 2, 2016-2027
Figure 50: Europe Energy Management System in Industrial Market Value Share (%), By Segment 2, 2019 & 2027
Figure 51: Europe Energy Management System in Industrial Market Forecast (USD Billion), by Sub-Segment 1, 2016-2027
Figure 52: Europe Energy Management System in Industrial Market Forecast (USD Billion), by Sub-Segment 2, 2016-2027
Figure 53: Europe Energy Management System in Industrial Market Forecast (USD Billion), by Sub-Segment 3, 2016-2027
Figure 54: Europe Energy Management System in Industrial Market Forecast (USD Billion), by Others, 2016-2027
Figure 55: Europe Energy Management System in Industrial Market Value Share (%), By Segment 3, 2019 & 2027
Figure 56: Europe Energy Management System in Industrial Market Forecast (USD Billion), by Sub-Segment 1, 2016-2027
Figure 57: Europe Energy Management System in Industrial Market Forecast (USD Billion), by Sub-Segment 2, 2016-2027
Figure 58: Europe Energy Management System in Industrial Market Forecast (USD Billion), by Sub-Segment 3, 2016-2027
Figure 59: Europe Energy Management System in Industrial Market Forecast (USD Billion), by Others, 2016-2027
Figure 60: Europe Energy Management System in Industrial Market Forecast (USD Billion), by U.K., 2016-2027
Figure 61: Europe Energy Management System in Industrial Market Forecast (USD Billion), by Germany, 2016-2027
Figure 62: Europe Energy Management System in Industrial Market Forecast (USD Billion), by France, 2016-2027
Figure 63: Europe Energy Management System in Industrial Market Forecast (USD Billion), by Italy, 2016-2027
Figure 64: Europe Energy Management System in Industrial Market Forecast (USD Billion), by Spain, 2016-2027
Figure 65: Europe Energy Management System in Industrial Market Forecast (USD Billion), by Russia, 2016-2027
Figure 66: Europe Energy Management System in Industrial Market Forecast (USD Billion), by Rest of Europe, 2016-2027
Figure 67: Asia Pacific Energy Management System in Industrial Market Value Share (%), By Segment 1, 2019 & 2027
Figure 68: Asia Pacific Energy Management System in Industrial Market Forecast (USD Billion), by Sub-Segment 1, 2016-2027
Figure 69: Asia Pacific Energy Management System in Industrial Market Forecast (USD Billion), by Sub-Segment 2, 2016-2027
Figure 70: Asia Pacific Energy Management System in Industrial Market Value Share (%), By Segment 2, 2019 & 2027
Figure 71: Asia Pacific Energy Management System in Industrial Market Forecast (USD Billion), by Sub-Segment 1, 2016-2027
Figure 72: Asia Pacific Energy Management System in Industrial Market Forecast (USD Billion), by Sub-Segment 2, 2016-2027
Figure 73: Asia Pacific Energy Management System in Industrial Market Forecast (USD Billion), by Sub-Segment 3, 2016-2027
Figure 74: Asia Pacific Energy Management System in Industrial Market Forecast (USD Billion), by Others, 2016-2027
Figure 75: Asia Pacific Energy Management System in Industrial Market Value Share (%), By Segment 3, 2019 & 2027
Figure 76: Asia Pacific Energy Management System in Industrial Market Forecast (USD Billion), by Sub-Segment 1, 2016-2027
Figure 77: Asia Pacific Energy Management System in Industrial Market Forecast (USD Billion), by Sub-Segment 2, 2016-2027
Figure 78: Asia Pacific Energy Management System in Industrial Market Forecast (USD Billion), by Sub-Segment 3, 2016-2027
Figure 79: Asia Pacific Energy Management System in Industrial Market Forecast (USD Billion), by Others, 2016-2027
Figure 80: Asia Pacific Energy Management System in Industrial Market Forecast (USD Billion), by China, 2016-2027
Figure 81: Asia Pacific Energy Management System in Industrial Market Forecast (USD Billion), by India, 2016-2027
Figure 82: Asia Pacific Energy Management System in Industrial Market Forecast (USD Billion), by Japan, 2016-2027
Figure 83: Asia Pacific Energy Management System in Industrial Market Forecast (USD Billion), by Australia, 2016-2027
Figure 84: Asia Pacific Energy Management System in Industrial Market Forecast (USD Billion), by Southeast Asia, 2016-2027
Figure 85: Asia Pacific Energy Management System in Industrial Market Forecast (USD Billion), by Rest of Asia Pacific, 2016-2027
Figure 86: Middle East & Africa Energy Management System in Industrial Market Value Share (%), By Segment 1, 2019 & 2027
Figure 87: Middle East & Africa Energy Management System in Industrial Market Forecast (USD Billion), by Sub-Segment 1, 2016-2027
Figure 88: Middle East & Africa Energy Management System in Industrial Market Forecast (USD Billion), by Sub-Segment 2, 2016-2027
Figure 89: Middle East & Africa Energy Management System in Industrial Market Value Share (%), By Segment 2, 2019 & 2027
Figure 90: Middle East & Africa Energy Management System in Industrial Market Forecast (USD Billion), by Sub-Segment 1, 2016-2027
Figure 91: Middle East & Africa Energy Management System in Industrial Market Forecast (USD Billion), by Sub-Segment 2, 2016-2027
Figure 92: Middle East & Africa Energy Management System in Industrial Market Forecast (USD Billion), by Sub-Segment 3, 2016-2027
Figure 93: Middle East & Africa Energy Management System in Industrial Market Forecast (USD Billion), by Others, 2016-2027
Figure 94: Middle East & Africa Energy Management System in Industrial Market Value Share (%), By Segment 3, 2019 & 2027
Figure 95: Middle East & Africa Energy Management System in Industrial Market Forecast (USD Billion), by Sub-Segment 1, 2016-2027
Figure 96: Middle East & Africa Energy Management System in Industrial Market Forecast (USD Billion), by Sub-Segment 2, 2016-2027
Figure 97: Middle East & Africa Energy Management System in Industrial Market Forecast (USD Billion), by Sub-Segment 3, 2016-2027
Figure 98: Middle East & Africa Energy Management System in Industrial Market Forecast (USD Billion), by Others, 2016-2027
Figure 99: Middle East & Africa Energy Management System in Industrial Market Forecast (USD Billion), by GCC, 2016-2027
Figure 100: Middle East & Africa Energy Management System in Industrial Market Forecast (USD Billion), by South Africa, 2016-2027
Figure 101: Middle East & Africa Energy Management System in Industrial Market Forecast (USD Billion), by Rest of Middle East & Africa, 2016-2027
List of Tables
Table 1: Global Energy Management System in Industrial Market Revenue (USD Billion) Forecast, by Segment 1, 2016-2027
Table 2: Global Energy Management System in Industrial Market Revenue (USD Billion) Forecast, by Segment 2, 2016-2027
Table 3: Global Energy Management System in Industrial Market Revenue (USD Billion) Forecast, by Segment 3, 2016-2027
Table 4: Global Energy Management System in Industrial Market Revenue (USD Billion) Forecast, by Region, 2016-2027
Table 5: North America Energy Management System in Industrial Market Revenue (USD Billion) Forecast, by Segment 1, 2016-2027
Table 6: North America Energy Management System in Industrial Market Revenue (USD Billion) Forecast, by Segment 2, 2016-2027
Table 7: North America Energy Management System in Industrial Market Revenue (USD Billion) Forecast, by Segment 3, 2016-2027
Table 8: North America Energy Management System in Industrial Market Revenue (USD Billion) Forecast, by Country, 2016-2027
Table 9: Europe Energy Management System in Industrial Market Revenue (USD Billion) Forecast, by Segment 1, 2016-2027
Table 10: Europe Energy Management System in Industrial Market Revenue (USD Billion) Forecast, by Segment 2, 2016-2027
Table 11: Europe Energy Management System in Industrial Market Revenue (USD Billion) Forecast, by Segment 3, 2016-2027
Table 12: Europe Energy Management System in Industrial Market Revenue (USD Billion) Forecast, by Country, 2016-2027
Table 13: Latin America Energy Management System in Industrial Market Revenue (USD Billion) Forecast, by Segment 1, 2016-2027
Table 14: Latin America Energy Management System in Industrial Market Revenue (USD Billion) Forecast, by Segment 2, 2016-2027
Table 15: Latin America Energy Management System in Industrial Market Revenue (USD Billion) Forecast, by Segment 3, 2016-2027
Table 16: Latin America Energy Management System in Industrial Market Revenue (USD Billion) Forecast, by Country, 2016-2027
Table 17: Asia Pacific Energy Management System in Industrial Market Revenue (USD Billion) Forecast, by Segment 1, 2016-2027
Table 18: Asia Pacific Energy Management System in Industrial Market Revenue (USD Billion) Forecast, by Segment 2, 2016-2027
Table 19: Asia Pacific Energy Management System in Industrial Market Revenue (USD Billion) Forecast, by Segment 3, 2016-2027
Table 20: Asia Pacific Energy Management System in Industrial Market Revenue (USD Billion) Forecast, by Country, 2016-2027
Table 21: Middle East & Africa Energy Management System in Industrial Market Revenue (USD Billion) Forecast, by Segment 1, 2016-2027
Table 22: Middle East & Africa Energy Management System in Industrial Market Revenue (USD Billion) Forecast, by Segment 2, 2016-2027
Table 23: Middle East & Africa Energy Management System in Industrial Market Revenue (USD Billion) Forecast, by Segment 3, 2016-2027
Table 24: Middle East & Africa Energy Management System in Industrial Market Revenue (USD Billion) Forecast, by Country, 2016-2027
Research Process
Data Library Research are conducted by industry experts who offer insight on
industry structure, market segmentations technology assessment and competitive landscape (CL), and penetration, as well as on emerging trends. Their analysis is based on primary interviews (~ 80%) and secondary research (~ 20%) as well as years of professional expertise in their respective industries. Adding to this, by analysing historical trends and current market positions, our analysts predict where the market will be headed for the next five years. Furthermore, the varying trends of segment & categories geographically presented are also studied and the estimated based on the primary & secondary research.
In this particular report from the supply side Data Library Research has conducted primary surveys (interviews) with the key level executives (VP, CEO’s, Marketing Director, Business Development Manager
and SOFT) of the companies that active & prominent as well as the midsized organization
FIGURE 1: DLR RESEARH PROCESS
![research-methodology1]()
Primary Research
Extensive primary research was conducted to gain a deeper insight of the market and industry performance. The analysis is based on both primary and secondary research as well as years of professional expertise in the respective industries.
In addition to analysing current and historical trends, our analysts predict where the market is headed over the next five years.
It varies by segment for these categories geographically presented in the list of market tables. Speaking about this particular report we have conducted primary surveys (interviews) with the key level executives (VP, CEO’s, Marketing Director, Business Development Manager and many more) of the major players active in the market.
Secondary Research
Secondary research was mainly used to collect and identify information useful for the extensive, technical, market-oriented, and Friend’s study of the Global Extra Neutral Alcohol. It was also used to obtain key information about major players, market classification and segmentation according to the industry trends, geographical markets, and developments related to the market and technology perspectives. For this study, analysts have gathered information from various credible sources, such as annual reports, sec filings, journals, white papers, SOFT presentations, and company web sites.
Market Size Estimation
Both, top-down and bottom-up approaches were used to estimate and validate the size of the Global market and to estimate the size of various other dependent submarkets in the overall Extra Neutral Alcohol. The key players in the market were identified through secondary research and their market contributions in the respective geographies were determined through primary and secondary research.
Forecast Model
![research-methodology2]()