Global Eye Drops & Lubricants Market Opportunities and Forecast 2023-2030

  •   DLR485
  •   April, 2022
  •   Pages: 120
  •  Global
Eye Drops & Lubricants Market Overview

Eye disorders affect a large number of people. Some of these, however, may be small and self-correcting, or they may be simply treated at home. Other conditions may necessitate the assistance of a professional. In the treatment of certain eye issues, eye drops and lubricants are highly suggested because they are effective and less unpleasant. These solutions and lubricants are used to treat conditions like discomfort, diabetic macular edema, dry eye, redness, refractive errors, glaucoma, conjunctivitis, itching, CMV retinitis, and age-related macular degeneration. The global Eye Drops & Lubricants market is projected to rise at a significant rate in the coming years.
 
Increased frequency of ophthalmic diseases and demographic change are driving the global eye drops and lubricants market. Moreover, drug discovery and development is expected to drive market expansion over the predicted period. However, the market is expected to be restrained by adverse effects associated with ophthalmic eye drops and lubricants. Furthermore, in the coming years, strict rules and regulations are likely to hamper industry expansion. However, throughout the projected period, the market is expected to be propelled by increased investment by key players in the eye drops and lubricants market in growing countries.

Report Metric Details
Market size available for years 2023–2030
Base year considered 2023
Forecast period 2024–2030
Forecast unit Value (USD Million)
Segments covered Type, Application, and Region.
Regions covered North America (the U.S. and Canada), Europe (UK, Germany, France, Italy, Spain, Russia, Rest of Europe), Asia-Pacific (China, India, Japan, Australia, South East Asia, Rest of Asia Pacific), Latin America and the Middle East and Africa (Brazil, Saudi Arabia, UAE, Rest of LAMEA)
Companies covered Novartis International AG (Alcon Inc.), Akorn Consumer Health (TheraTears), Allergan plc, ROHTO Pharmaceutical Co., Ltd., Johnson & Johnson, Pfizer, Inc., Similasan Corporation USA, Sager Pharma Kft., Prestige Consumer Healthcare, Inc., and Valeant pharmaceuticals International, Inc. (Bausch & Lomb Incorporated).


Covid-19 Impact on Eye Drops & Lubricants Market
 
In addition, the current Eye Drops & Lubricants Market study offers a detailed analysis of the current COVID-19 pandemic impact on the market growth and its influence on the future growth of the Eye Drops & Lubricants Market. The recently published report demonstrates the elevation in the demand for the healthcare sector. The healthcare manufacturers have experienced long-term as well as short-term effect which includes supply shortages, panic buying, and stocking, regulation changes as short-term whereas approval delays and possible trend variations in consumption could be perceived as long-term impacts of COVID-19 on the health and pharmaceutical market.

The increasing need for a cure has pushed vaccine research and manufacturers to the limit. In addition to this, panic conditions have already spurred the demand for many healthcare products and services which are discussed in detail in this report. Moreover, the impact of COVID-19 on overall market revenue for the base year 2020 and its projection up to 2027 is provided in detail in this report.
 
Eye Drops & Lubricants Market Segment Overview


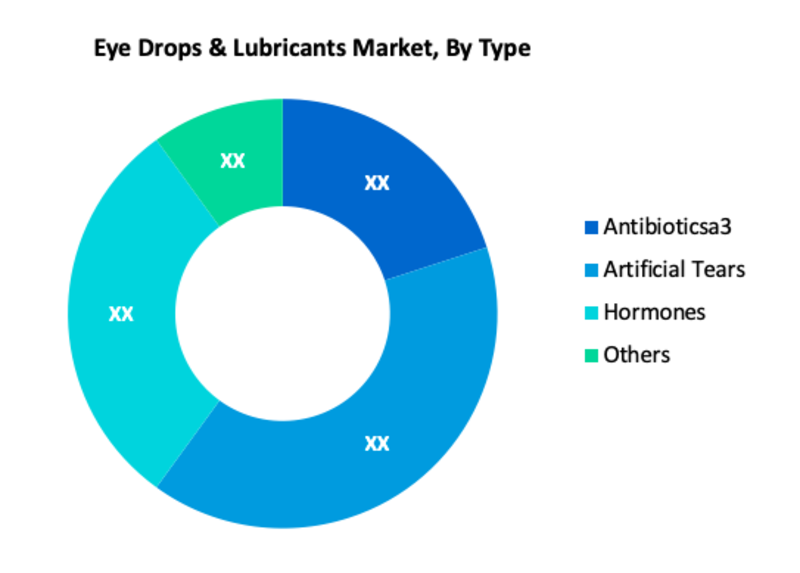
According to type, the Artificial Tears segment is expected to account for major market share in the forecast period. This is because of the rise in demand for these medications to treat artificial tears and the increase in the occurrence of dry eye syndrome across the globe. On the other hand, the Hormones segment is projected to enlarge at a high CAGR in the forthcoming years. This is owing to the high occurrence rate of dry eye in postmenopausal women. Based on application, the eye diseases segment held maximum market share due to an upsurge in the global geriatric population and the high occurrence rate of eye diseases. Moreover, the eye care segment is anticipated to grow at a higher rate in the forecast period. This is because a large number of cataracts and other eye-related operations necessitate the usage of eye drops.
 
Eye Drops & Lubricants Market, By Type
·       Antibioticsa3
·       Artificial Tears
·       Hormones
·       Others
 
Eye Drops & Lubricants Market, By Application
  • Eye Diseases
    • Conjunctivitis
    • Dry Eye
    • Glaucoma
    • Refractive Errors
    • Others
  • Eye Care
  • Others
Eye Drops & Lubricants Market Regional Overview

Region-Wise, North America is anticipated to hold a major share in the Eye Drops & Lubricants market. This is because of the rise in health care investments by manufacturers and high R&D expenditure by companies for the development of these medications. Furthermore, an increase in the occurrence of ophthalmic disorders propelled the growth of the market in the region. However, the market in the Asia Pacific is anticipated to enlarge at a high CAGR in the coming years. This is due to the speedy expansion of health care infrastructure, high occurrence of ophthalmic diseases, and increase in health care initiatives by governments.
 
Eye Drops & Lubricants Market, By Geography
 
·       North America (US & Canada)
·       Europe (UK, Germany, France, Italy, Spain, Russia & Rest of Europe)
·       Asia-Pacific (Japan, China, India, Australia, & South Korea, & Rest of Asia-Pacific)
·       LAMEA (Brazil, Saudi Arabia, UAE & Rest of LAMEA)
 
Eye Drops & Lubricants Market Competitor overview

Some key developments and strategies adopted by manufacturers in the Eye Drops & Lubricants are highlighted below.

·       In April 2021, Alcon, the global leader in eye care dedicated to helping people see brilliantly, announced the U.S. launch of the newest addition to its innovative portfolio of dry eye products – Systane® Hydration Multi-Dose Preservative-Free (MDPF) Lubricant Eye Drops. With its proprietary HydroBoost® Technology, this new preservative-free eye drop provides extra moisture for patients with sensitive dry eyes.

Eye Drops & Lubricants Market, Key Players

·       Novartis International AG (Alcon Inc.)
·       Akorn Consumer Health (TheraTears)
·       Allergan plc
·       ROHTO Pharmaceutical Co., Ltd.
·       Johnson & Johnson
·       Pfizer, Inc.
·       Similasan Corporation USA
·       Sager Pharma Kft.
·       Prestige Consumer Healthcare, Inc.
·       Valeant pharmaceuticals International, Inc. (Bausch & Lomb Incorporated)

Frequently Asked Questions (FAQ) :

Q1. What are the driving factors for the Eye Drops & Lubricants market?

Increased frequency of ophthalmic diseases and demographic change are driving the global eye drops and lubricants market.

Q2. Which Segments are covered in the Eye Drops & Lubricants Market report?

Type, Application, and Region. these segments are covered in the Eye Drops & Lubricants market report.

Q3. Which segment is projected to hold the largest share in the Eye Drops & Lubricants Market?

Artificial Tears segments are projected to hold the largest share in the Eye Drops & Lubricants Market.

Q4. Which region holds the largest share in the Eye Drops & Lubricants market?

North America held the largest share in the global Eye Drops & Lubricants market

Q5. Which are the prominent players in the Eye Drops & Lubricants Market?

Novartis International AG (Alcon Inc.), Akorn Consumer Health (TheraTears), Allergan plc, ROHTO Pharmaceutical Co., Ltd., Johnson & Johnson, Pfizer, Inc., Similasan Corporation USA, Sager Pharma Kft., Prestige Consumer Healthcare, Inc., and Valeant pharmaceuticals International, Inc. (Bausch & Lomb Incorporated). are some key players in the Eye Drops & Lubricants Market.
Eye Drops & Lubricants Market Study Global Market Analysis, Insights and Forecast, 2020-2027

    1. Introduction

    • 1.1. Research Scope
    • 1.2. Market Segmentation
    • 1.3. Research Methodology
    • 1.4. Definitions and Assumptions

    2. Executive Summary

      3. Market Dynamics

      • 3.1. Market Drivers
      • 3.2. Market Restraints
      • 3.3. Market Opportunities

      4. Key Insights

      • 4.1. Key Emerging Trends – For Major Countries
      • 4.2. Latest Technological Advancement
      • 4.3. Regulatory Landscape
      • 4.4. Industry SWOT Analysis
      • 4.5. Porters Five Forces Analysis

      5. Global Eye Drops & Lubricants Market Analysis (USD Billion), Insights and Forecast, 2020-2027

      • 5.1. Key Findings / Summary
      • 5.2. Market Analysis, Insights and Forecast – By Type
        • 5.2.1. Antibioticsa3
        • 5.2.2. Artificial Tears
        • 5.2.3. Hormones
        • 5.2.4. Others
      • 5.3. Market Analysis, Insights and Forecast – By Application
        • 5.3.1. Eye Diseases
          • 5.3.1.1. Conjunctivitis
          • 5.3.1.2. Dry Eye
          • 5.3.1.3. Glaucoma
          • 5.3.1.4. Refractive Errors
          • 5.3.1.5. Others
        • 5.3.2. Eye Care
        • 5.3.3. Others
      • 5.4. Market Analysis, Insights and Forecast – By Region
        • 5.4.1. North America
        • 5.4.2. Europe
        • 5.4.3. Asia Pacific
        • 5.4.4. Latin America, Middle East and Africa

      6. North America Eye Drops & Lubricants Market Analysis (USD Billion), Insights and Forecast, 2020-2027

      • 6.1. Key Findings / Summary
      • 6.2. Market Analysis, Insights and Forecast – By Type
        • 6.2.1. Antibioticsa3
        • 6.2.2. Artificial Tears
        • 6.2.3. Hormones
        • 6.2.4. Others
      • 6.3. Market Analysis, Insights and Forecast – By Application
        • 6.3.1. Eye Diseases
          • 6.3.1.1. Conjunctivitis
          • 6.3.1.2. Dry Eye
          • 6.3.1.3. Glaucoma
          • 6.3.1.4. Refractive Errors
          • 6.3.1.5. Others
        • 6.3.2. Eye Care
        • 6.3.3. Others
      • 6.4. Market Analysis, Insights and Forecast – By Country
        • 6.4.1. U.S.
        • 6.4.2. Canada

      7. Europe Eye Drops & Lubricants Market Analysis (USD Billion), Insights and Forecast, 2020-2027

      • 7.1. Key Findings / Summary
      • 7.2. Market Analysis, Insights and Forecast – By Type
        • 7.2.1. Antibioticsa3
        • 7.2.2. Artificial Tears
        • 7.2.3. Hormones
        • 7.2.4. Others
      • 7.3. Market Analysis, Insights and Forecast – By Application
        • 7.3.1. Eye Diseases
          • 7.3.1.1. Conjunctivitis
          • 7.3.1.2. Dry Eye
          • 7.3.1.3. Glaucoma
          • 7.3.1.4. Refractive Errors
          • 7.3.1.5. Others
        • 7.3.2. Eye Care
        • 7.3.3. Others
      • 7.4. Market Analysis, Insights and Forecast – By Country
        • 7.4.1. UK
        • 7.4.2. Germany
        • 7.4.3. France
        • 7.4.4. Italy
        • 7.4.5. Spain
        • 7.4.6. Russia
        • 7.4.7. Rest of Europe

      8. Asia Pacific Eye Drops & Lubricants Market Analysis (USD Billion), Insights and Forecast, 2020-2027

      • 8.1. Key Findings / Summary
      • 8.2. Market Analysis, Insights and Forecast – By Type
        • 8.2.1. Antibioticsa3
        • 8.2.2. Artificial Tears
        • 8.2.3. Hormones
        • 8.2.4. Others
      • 8.3. Market Analysis, Insights and Forecast – By Application
        • 8.3.1. Eye Diseases
          • 8.3.1.1. Conjunctivitis
          • 8.3.1.2. Dry Eye
          • 8.3.1.3. Glaucoma
          • 8.3.1.4. Refractive Errors
          • 8.3.1.5. Others
        • 8.3.2. Eye Care
        • 8.3.3. Others
      • 8.4. Market Analysis, Insights and Forecast – By Country
        • 8.4.1. China
        • 8.4.2. India
        • 8.4.3. Japan
        • 8.4.4. Australia
        • 8.4.5. South East Asia
        • 8.4.6. Rest of Asia Pacific

      9. Latin America, Middle East and Africa Eye Drops & Lubricants Market Analysis (USD Billion), Insights and Forecast, 2020-2027

      • 9.1. Key Findings / Summary
      • 9.2. Market Analysis, Insights and Forecast – By Type
        • 9.2.1. Antibioticsa3
        • 9.2.2. Artificial Tears
        • 9.2.3. Hormones
        • 9.2.4. Others
      • 9.3. Market Analysis, Insights and Forecast – By Application
        • 9.3.1. Eye Diseases
          • 9.3.1.1. Conjunctivitis
          • 9.3.1.2. Dry Eye
          • 9.3.1.3. Glaucoma
          • 9.3.1.4. Refractive Errors
          • 9.3.1.5. Others
        • 9.3.2. Eye Care
        • 9.3.3. Others
      • 9.4. Market Analysis, Insights and Forecast – By Country
        • 9.4.1. Brazil
        • 9.4.2. Saudi Arabia
        • 9.4.3. UAE
        • 9.4.4. Rest of LAMEA

      10. Competitive Analysis

      • 10.1. Company Market Share Analysis, 2018
      • 10.2. Key Industry Developments
      • 10.3. Company Profile
      • 10.4. Novartis International AG (Alcon Inc.)
        • 10.4.1. Business Overview
        • 10.4.2. Segment 1 & Service Offering
        • 10.4.3. Overall Revenue
        • 10.4.4. Geographic Presence
        • 10.4.5. Recent Development
      *Similar details will be provided for the following companies
      • 10.5. Akorn Consumer Health (TheraTears)
      • 10.6. Allergan plc
      • 10.7. ROHTO Pharmaceutical Co., Ltd.
      • 10.8. Johnson & Johnson
      • 10.9. Pfizer, Inc.
      • 10.10. Similasan Corporation USA
      • 10.11. Sager Pharma Kft.
      • 10.12. Prestige Consumer Healthcare, Inc.
      List of Figures

      Figure 1: Global Eye Drops & Lubricants Market Revenue Breakdown (USD Billion, %) by Region, 2019 & 2027
      Figure 2: Global Market Value Share (%), By Segment 1, 2019 & 2027
      Figure 3: Global Market Forecast (USD Billion), by Sub-Segment 1, 2016-2027
      Figure 4: Global Market Forecast (USD Billion), by Sub-Segment 2, 2016-2027
      Figure 5: Global Market Value Share (%), By Segment 2, 2019 & 2027
      Figure 6: Global Market Forecast (USD Billion), by Sub-Segment 1, 2016-2027
      Figure 7: Global Market Forecast (USD Billion), by Sub-Segment 2, 2016-2027
      Figure 8: Global Market Forecast (USD Billion), by Sub-Segment 3, 2016-2027
      Figure 9: Global Eye Drops & Lubricants Market Forecast (USD Billion), by Others, 2016-2027
      Figure 10: Global Market Value Share (%), By Segment 3, 2019 & 2027
      Figure 11: Global Market Forecast (USD Billion), by Sub-Segment 1, 2016-2027
      Figure 12: Global Market Forecast (USD Billion), by Sub-Segment 2, 2016-2027
      Figure 13: Global Market Forecast (USD Billion), by Sub-Segment 3, 2016-2027
      Figure 14: Global Market Forecast (USD Billion), by Others, 2016-2027
      Figure 15: Global Market Value (USD Billion), by Region, 2019 & 2027
      Figure 16: North America Eye Drops & Lubricants Market Value Share (%), By Segment 1, 2019 & 2027
      Figure 17: North America Market Forecast (USD Billion), by Sub-Segment 1, 2016-2027
      Figure 18: North America Market Forecast (USD Billion), by Sub-Segment 2, 2016-2027
      Figure 19: North America Market Value Share (%), By Segment 2, 2019 & 2027
      Figure 20: North America Market Forecast (USD Billion), by Sub-Segment 1, 2016-2027
      Figure 21: North America Market Forecast (USD Billion), by Sub-Segment 2, 2016-2027
      Figure 22: North America Market Forecast (USD Billion), by Sub-Segment 3, 2016-2027
      Figure 23: North America Market Forecast (USD Billion), by Others, 2016-2027
      Figure 24: North America Market Value Share (%), By Segment 3, 2019 & 2027
      Figure 25: North America Market Forecast (USD Billion), by Sub-Segment 1, 2016-2027
      Figure 26: North America Market Forecast (USD Billion), by Sub-Segment 2, 2016-2027
      Figure 27: North America Market Forecast (USD Billion), by Sub-Segment 3, 2016-2027
      Figure 28: North America Market Forecast (USD Billion), by Others, 2016-2027
      Figure 29: North America Market Forecast (USD Billion), by U.S., 2016-2027
      Figure 30: North America Market Forecast (USD Billion), by Canada, 2016-2027
      Figure 31: Latin America Eye Drops & Lubricants Market Value Share (%), By Segment 1, 2019 & 2027
      Figure 32: Latin America Market Forecast (USD Billion), by Sub-Segment 1, 2016-2027
      Figure 33: Latin America Market Forecast (USD Billion), by Sub-Segment 2, 2016-2027
      Figure 34: Latin America Market Value Share (%), By Segment 2, 2019 & 2027
      Figure 35: Latin America Market Forecast (USD Billion), by Sub-Segment 1, 2016-2027
      Figure 36: Latin America Market Forecast (USD Billion), by Sub-Segment 2, 2016-2027
      Figure 37: Latin America Market Forecast (USD Billion), by Sub-Segment 3, 2016-2027
      Figure 38: Latin America Market Forecast (USD Billion), by Others, 2016-2027
      Figure 39: Latin America Market Value Share (%), By Segment 3, 2019 & 2027
      Figure 40: Latin America Market Forecast (USD Billion), by Sub-Segment 1, 2016-2027
      Figure 41: Latin America Market Forecast (USD Billion), by Sub-Segment 2, 2016-2027
      Figure 42: Latin America Market Forecast (USD Billion), by Sub-Segment 3, 2016-2027
      Figure 43: Latin America Market Forecast (USD Billion), by Others, 2016-2027
      Figure 44: Latin America Market Forecast (USD Billion), by Brazil, 2016-2027
      Figure 45: Latin America Market Forecast (USD Billion), by Mexico, 2016-2027
      Figure 46: Latin America Market Forecast (USD Billion), by Rest of Latin America, 2016-2027
      Figure 47: Europe Eye Drops & Lubricants Market Value Share (%), By Segment 1, 2019 & 2027
      Figure 48: Europe Market Forecast (USD Billion), by Sub-Segment 1, 2016-2027
      Figure 49: Europe Market Forecast (USD Billion), by Sub-Segment 2, 2016-2027
      Figure 50: Europe Market Value Share (%), By Segment 2, 2019 & 2027
      Figure 51: Europe Market Forecast (USD Billion), by Sub-Segment 1, 2016-2027
      Figure 52: Europe Market Forecast (USD Billion), by Sub-Segment 2, 2016-2027
      Figure 53: Europe Market Forecast (USD Billion), by Sub-Segment 3, 2016-2027
      Figure 54: Europe Market Forecast (USD Billion), by Others, 2016-2027
      Figure 55: Europe Market Value Share (%), By Segment 3, 2019 & 2027
      Figure 56: Europe Market Forecast (USD Billion), by Sub-Segment 1, 2016-2027
      Figure 57: Europe Market Forecast (USD Billion), by Sub-Segment 2, 2016-2027
      Figure 58: Europe Market Forecast (USD Billion), by Sub-Segment 3, 2016-2027
      Figure 59: Europe Market Forecast (USD Billion), by Others, 2016-2027
      Figure 60: Europe Market Forecast (USD Billion), by U.K., 2016-2027
      Figure 61: Europe Market Forecast (USD Billion), by Germany, 2016-2027
      Figure 62: Europe Market Forecast (USD Billion), by France, 2016-2027
      Figure 63: Europe Market Forecast (USD Billion), by Italy, 2016-2027
      Figure 64: Europe Market Forecast (USD Billion), by Spain, 2016-2027
      Figure 65: Europe Market Forecast (USD Billion), by Russia, 2016-2027
      Figure 66: Europe Market Forecast (USD Billion), by Rest of Europe, 2016-2027
      Figure 67: Asia Pacific Eye Drops & Lubricants Market Value Share (%), By Segment 1, 2019 & 2027
      Figure 68: Asia Pacific Market Forecast (USD Billion), by Sub-Segment 1, 2016-2027
      Figure 69: Asia Pacific Market Forecast (USD Billion), by Sub-Segment 2, 2016-2027
      Figure 70: Asia Pacific Market Value Share (%), By Segment 2, 2019 & 2027
      Figure 71: Asia Pacific Market Forecast (USD Billion), by Sub-Segment 1, 2016-2027
      Figure 72: Asia Pacific Market Forecast (USD Billion), by Sub-Segment 2, 2016-2027
      Figure 73: Asia Pacific Market Forecast (USD Billion), by Sub-Segment 3, 2016-2027
      Figure 74: Asia Pacific Market Forecast (USD Billion), by Others, 2016-2027
      Figure 75: Asia Pacific Market Value Share (%), By Segment 3, 2019 & 2027
      Figure 76: Asia Pacific Market Forecast (USD Billion), by Sub-Segment 1, 2016-2027
      Figure 77: Asia Pacific Market Forecast (USD Billion), by Sub-Segment 2, 2016-2027
      Figure 78: Asia Pacific Market Forecast (USD Billion), by Sub-Segment 3, 2016-2027
      Figure 79: Asia Pacific Market Forecast (USD Billion), by Others, 2016-2027
      Figure 80: Asia Pacific Market Forecast (USD Billion), by China, 2016-2027
      Figure 81: Asia Pacific Market Forecast (USD Billion), by India, 2016-2027
      Figure 82: Asia Pacific Market Forecast (USD Billion), by Japan, 2016-2027
      Figure 83: Asia Pacific Market Forecast (USD Billion), by Australia, 2016-2027
      Figure 84: Asia Pacific Market Forecast (USD Billion), by Southeast Asia, 2016-2027
      Figure 85: Asia Pacific Market Forecast (USD Billion), by Rest of Asia Pacific, 2016-2027
      Figure 86: Middle East & Africa Eye Drops & Lubricants Market Value Share (%), By Segment 1, 2019 & 2027
      Figure 87: Middle East & Africa Market Forecast (USD Billion), by Sub-Segment 1, 2016-2027
      Figure 88: Middle East & Africa Market Forecast (USD Billion), by Sub-Segment 2, 2016-2027
      Figure 89: Middle East & Africa Market Value Share (%), By Segment 2, 2019 & 2027
      Figure 90: Middle East & Africa Market Forecast (USD Billion), by Sub-Segment 1, 2016-2027
      Figure 91: Middle East & Africa Market Forecast (USD Billion), by Sub-Segment 2, 2016-2027
      Figure 92: Middle East & Africa Market Forecast (USD Billion), by Sub-Segment 3, 2016-2027
      Figure 93: Middle East & Africa Market Forecast (USD Billion), by Others, 2016-2027
      Figure 94: Middle East & Africa Market Value Share (%), By Segment 3, 2019 & 2027
      Figure 95: Middle East & Africa Market Forecast (USD Billion), by Sub-Segment 1, 2016-2027
      Figure 96: Middle East & Africa Market Forecast (USD Billion), by Sub-Segment 2, 2016-2027
      Figure 97: Middle East & Africa Market Forecast (USD Billion), by Sub-Segment 3, 2016-2027
      Figure 98: Middle East & Africa Market Forecast (USD Billion), by Others, 2016-2027
      Figure 99: Middle East & Africa Market Forecast (USD Billion), by GCC, 2016-2027
      Figure 100: Middle East & Africa Market Forecast (USD Billion), by South Africa, 2016-2027
      Figure 101: Middle East & Africa Market Forecast (USD Billion), by Rest of Middle East & Africa, 2016-2027 
      List of Tables
      Table 1: Global Eye Drops & Lubricants Market Revenue (USD Billion) Forecast, by Segment 1, 2016-2027
      Table 2: Global Market Revenue (USD Billion) Forecast, by Segment 2, 2016-2027
      Table 3: Global Market Revenue (USD Billion) Forecast, by Segment 3, 2016-2027
      Table 4: Global Market Revenue (USD Billion) Forecast, by Region, 2016-2027
      Table 5: North America Eye Drops & Lubricants Market Revenue (USD Billion) Forecast, by Segment 1, 2016-2027
      Table 6: North America Market Revenue (USD Billion) Forecast, by Segment 2, 2016-2027
      Table 7: North America Market Revenue (USD Billion) Forecast, by Segment 3, 2016-2027
      Table 8: North America Market Revenue (USD Billion) Forecast, by Country, 2016-2027
      Table 9: Europe Eye Drops & Lubricants Market Revenue (USD Billion) Forecast, by Segment 1, 2016-2027
      Table 10: Europe Market Revenue (USD Billion) Forecast, by Segment 2, 2016-2027
      Table 11: Europe Market Revenue (USD Billion) Forecast, by Segment 3, 2016-2027
      Table 12: Europe Market Revenue (USD Billion) Forecast, by Country, 2016-2027
      Table 13: Latin America Eye Drops & Lubricants Market Revenue (USD Billion) Forecast, by Segment 1, 2016-2027
      Table 14: Latin America Market Revenue (USD Billion) Forecast, by Segment 2, 2016-2027
      Table 15: Latin America Market Revenue (USD Billion) Forecast, by Segment 3, 2016-2027
      Table 16: Latin America Market Revenue (USD Billion) Forecast, by Country, 2016-2027
      Table 17: Asia Pacific Eye Drops & Lubricants Market Revenue (USD Billion) Forecast, by Segment 1, 2016-2027
      Table 18: Asia Pacific Market Revenue (USD Billion) Forecast, by Segment 2, 2016-2027
      Table 19: Asia Pacific Market Revenue (USD Billion) Forecast, by Segment 3, 2016-2027
      Table 20: Asia Pacific Market Revenue (USD Billion) Forecast, by Country, 2016-2027
      Table 21: Middle East & Africa Eye Drops & Lubricants Market Revenue (USD Billion) Forecast, by Segment 1, 2016-2027
      Table 22: Middle East & Africa Market Revenue (USD Billion) Forecast, by Segment 2, 2016-2027
      Table 23: Middle East & Africa Market Revenue (USD Billion) Forecast, by Segment 3, 2016-2027
      Table 24: Middle East & Africa Market Revenue (USD Billion) Forecast, by Country, 2016-2027
      Research Process

      Data Library Research are conducted by industry experts who offer insight on industry structure, market segmentations technology assessment and competitive landscape (CL), and penetration, as well as on emerging trends. Their analysis is based on primary interviews (~ 80%) and secondary research (~ 20%) as well as years of professional expertise in their respective industries. Adding to this, by analysing historical trends and current market positions, our analysts predict where the market will be headed for the next five years. Furthermore, the varying trends of segment & categories geographically presented are also studied and the estimated based on the primary & secondary research.

      In this particular report from the supply side Data Library Research has conducted primary surveys (interviews) with the key level executives (VP, CEO’s, Marketing Director, Business Development Manager and SOFT) of the companies that active & prominent as well as the midsized organization

      FIGURE 1: DLR RESEARH PROCESS

      research-methodology1

      Primary Research

      Extensive primary research was conducted to gain a deeper insight of the market and industry performance. The analysis is based on both primary and secondary research as well as years of professional expertise in the respective industries.

      In addition to analysing current and historical trends, our analysts predict where the market is headed over the next five years.

      It varies by segment for these categories geographically presented in the list of market tables. Speaking about this particular report we have conducted primary surveys (interviews) with the key level executives (VP, CEO’s, Marketing Director, Business Development Manager and many more) of the major players active in the market.

      Secondary Research

      Secondary research was mainly used to collect and identify information useful for the extensive, technical, market-oriented, and Friend’s study of the Global Extra Neutral Alcohol. It was also used to obtain key information about major players, market classification and segmentation according to the industry trends, geographical markets, and developments related to the market and technology perspectives. For this study, analysts have gathered information from various credible sources, such as annual reports, sec filings, journals, white papers, SOFT presentations, and company web sites.

      Market Size Estimation

      Both, top-down and bottom-up approaches were used to estimate and validate the size of the Global market and to estimate the size of various other dependent submarkets in the overall Extra Neutral Alcohol. The key players in the market were identified through secondary research and their market contributions in the respective geographies were determined through primary and secondary research.

      Forecast Model

      research-methodology2