Fab EDA Tools Market Overview and Analysis:

The Global Fab EDA Tools market is forecasted to exceed USD 32.8 billion by 2032, from USD 10.23 billion in 2025, expanding at a Compound Annual Growth Rate (CAGR) of approximately 9.2% from 2025.

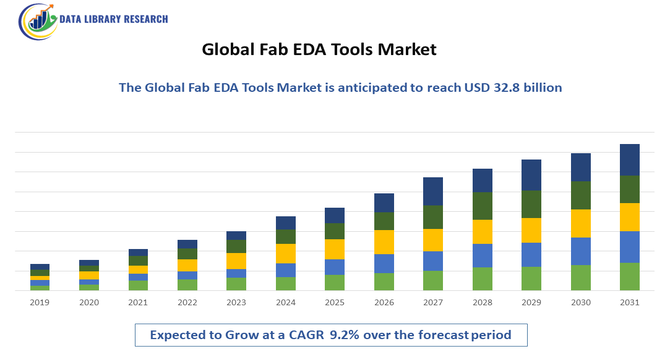
The Global Fab EDA Tools Market is experiencing strong growth driven by the rising complexity of semiconductor manufacturing processes and the increasing need for precise design-to-fabrication integration. The rapid expansion of advanced nodes, such as 5nm, 3nm, and upcoming sub-3nm technologies, is accelerating demand for highly accurate modeling, simulation, and verification tools to ensure yield optimization. Additionally, the surge in chip production for AI, automotive electronics, and high-performance computing is pushing fabs to adopt more sophisticated EDA solutions. Growing investments in semiconductor foundries worldwide further support market expansion.

Fab EDA Tools Market Latest Trends:

The Global Fab EDA Tools Market is witnessing major advancements driven by the growing adoption of AI-enabled design automation, which enhances accuracy in process simulation, layout verification, and yield prediction. A strong shift toward cloud-based EDA platforms is emerging as fabs seek scalable computing power for complex semiconductor designs. Integration of machine learning models for predictive maintenance and real-time defect detection is also gaining momentum. Additionally, tighter collaboration between foundries and EDA vendors is enabling co-optimization of design and manufacturing (DTCO), supporting next-generation node development and improving overall fabrication efficiency.

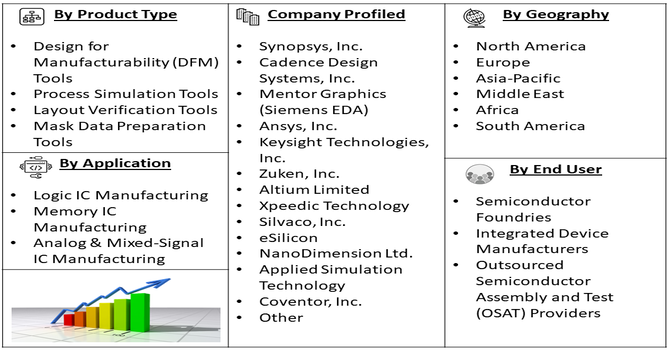
Segmentation: Global Fab EDA Tools Market is segmented By Tool Type (Design for Manufacturability (DFM) Tools, Process Simulation Tools, Layout Verification Tools, Mask Data Preparation Tools), Deployment Mode (On-Premise EDA Tools, Cloud-Based EDA Tools), Application (Logic IC Manufacturing, Memory IC Manufacturing, Analog & Mixed-Signal IC Manufacturing), End-User (Semiconductor Foundries, Integrated Device Manufacturers, Outsourced Semiconductor Assembly and Test (OSAT) Providers), and Geography (North America, Europe, Asia-Pacific, Middle East and Africa, and South America). The report provides the value (in USD million) for the above segments.

Market Drivers:

  • Increasing Complexity of Semiconductor Manufacturing and Advanced Nodes

The rapid evolution of semiconductor technology, including the adoption of 5nm, 3nm, and sub-3nm process nodes, is a major driver for the Fab EDA tools market. As feature sizes shrink, chip layouts become more complex, requiring precise modeling, simulation, and verification to maintain high yield and performance. For instance, in June 2025, Samsung Foundry and Siemens expanded collaboration, enabling Siemens’ Calibre, Solido, and Aprisa EDA tools to support advanced processes from 14 nm to 2 nm, while jointly innovating in power integrity, silicon photonics, and analog reliability. This partnership addressed growing semiconductor manufacturing complexity, facilitating advanced node designs and driving growth in the Fab EDA Tools Market. The increasing intricacy of IC design and fabrication pushes semiconductor foundries and IDMs to invest in sophisticated EDA tools, driving overall market growth.

  • Rising Demand for High-Performance Computing, AI, and Automotive Chips

The global surge in demand for high-performance computing, AI accelerators, data center processors, and automotive electronics is fueling the adoption of Fab EDA tools.

These applications require complex designs with higher transistor counts and stringent performance specifications, necessitating accurate simulation, yield optimization, and process verification. For instance, in April 2025, Synopsys, Inc. and Intel Foundry partnered to provide certified AI-driven digital and analog design flows, along with production-ready EDA for 18A and 18A-P process nodes, including EMIB-T packaging support. This collaboration supported rising demand for high-performance computing, AI, and automotive chips, accelerating adoption of advanced Fab EDA tools and driving market growth. This growing reliance on advanced EDA tools directly contributes to the market’s rapid expansion worldwide.

Market Restraints:

  • High Cost of Advanced EDA Tools and Implementation

One of the primary restraints is the substantial cost associated with acquiring and implementing advanced Fab EDA tools. High-end solutions, such as computational lithography, DFM, and yield optimization tools, require significant upfront investment in software licenses, computing infrastructure, and ongoing maintenance. Small and medium-sized foundries or IDMs may find it challenging to afford these sophisticated tools, limiting widespread adoption. Additionally, the total cost of ownership increases when integrating EDA tools with existing fab processes and training staff, which can slow deployment in cost-sensitive regions or for smaller players.

Socioeconomic Impact on Fab EDA Tools Market

The Global Fab EDA (Electronic Design Automation) Tools Market significantly influences socioeconomic development by enabling the design and manufacturing of advanced semiconductor devices critical for modern technology. EDA tools improve chip design efficiency, reducing time-to-market and development costs, which fosters innovation across industries like consumer electronics, automotive, and telecommunications. This market supports high-skilled employment in software development, engineering, and research sectors worldwide. By accelerating semiconductor advancements, EDA tools contribute to technological progress, economic growth, and competitiveness in the global tech landscape. Additionally, these tools facilitate energy-efficient chip designs, indirectly supporting sustainability goals. The market’s expansion also drives educational investments and workforce development, ensuring continued innovation and addressing the growing demand for smarter, faster electronic devices essential to today’s digital economy.

Segmental Analysis:

  • Design for Manufacturability (DFM) Tools segment is expected to witness highest growth over the forecast period

DFM tools are critical for ensuring that semiconductor designs can be efficiently and reliably manufactured. These tools help identify potential manufacturing issues early in the design phase, optimize layouts, and improve yield rates. As semiconductor nodes shrink to 5nm, 3nm, and beyond, the complexity of IC designs increases, making DFM tools essential for minimizing defects and ensuring high-performance output. Consequently, this segment contributes significantly to market value in USD million.

  • Cloud-Based EDA Tools segment is expected to witness highest growth over the forecast period

Cloud-based EDA tools are increasingly adopted due to their scalability, cost-effectiveness, and ability to handle complex design simulations without heavy local infrastructure. They allow semiconductor fabs and IDMs to access high-performance computing resources, collaborate across global teams, and reduce time-to-market for new IC designs. The shift from traditional on-premise systems to cloud deployment is driving significant growth in this segment.

  • Logic IC Manufacturing segment is expected to witness highest growth over the forecast period

Logic IC manufacturing dominates the application segment due to the high complexity of logic designs used in processors, GPUs, AI accelerators, and other high-performance computing chips. These ICs require sophisticated EDA tools for layout verification, yield optimization, and process simulation to meet performance and reliability requirements, contributing substantially to market demand.

  • Semiconductor Foundries segment is expected to witness highest growth over the forecast period

Semiconductor foundries represent the largest end-user segment as they handle high-volume production for multiple IDMs and fabless companies. Foundries rely heavily on advanced EDA tools to manage process variations, improve yield, and accelerate design-to-production cycles. Their demand for sophisticated software solutions drives a significant portion of the market’s revenue.

  • North America region is expected to witness highest growth over the forecast period

The North America region is expected to witness the highest growth over the forecast period in the Global Fab EDA Tools Market. This growth is driven by the presence of major semiconductor foundries, integrated device manufacturers, and advanced research facilities in the United States and Canada. For instance, in April 2023, the expansion of Synopsys.ai’s generative AI-based circuit optimization capabilities significantly enhanced design efficiency and innovation in North America’s Fab EDA Tools Market. By enabling smarter, faster circuit design processes, this advancement boosted competitiveness among semiconductor manufacturers, accelerated time-to-market, and increased adoption of AI-driven tools, driving robust market growth in the region.

Strong investments in next-generation process nodes, AI-enabled chip design, and high-performance computing applications fuel demand for sophisticated EDA tools. For instance, in June 2025, Siemens Digital Industries Software launched Innovator 3D IC and Calibre 3DStress, targeting heterogeneously integrated 2.5D/3D IC designs by resolving simulation, authoring, and reliability challenges. These innovations enhanced design efficiency and accuracy, driving adoption of advanced EDA solutions in North America and strengthening growth in the region’s Fab EDA Tools Market.

Additionally, the region’s focus on innovation, stringent quality standards, and well-established infrastructure for semiconductor R&D further supports rapid adoption of Fab EDA solutions.

Thus, together such factors are driving this market’s growth in this region.

Fab EDA Tools Market Competitive Landscape

The Global Fab EDA Tools Market is highly competitive, with leading players focusing on technological innovation, advanced software solutions, strategic partnerships, and regional expansion to strengthen their market presence. Companies are investing in AI-enabled EDA tools, cloud-based platforms, design-for-manufacturability solutions, and process simulation technologies to meet the increasing complexity of semiconductor manufacturing and advanced node requirements. Collaboration with semiconductor foundries and integrated device manufacturers, along with mergers and acquisitions, further enhances market competitiveness and ensures rapid adoption of sophisticated EDA solutions globally.

Key Players:

  • Synopsys, Inc.
  • Cadence Design Systems, Inc.
  • Mentor Graphics (Siemens EDA)
  • Ansys, Inc.
  • Keysight Technologies, Inc.
  • Zuken, Inc.
  • Altium Limited
  • Xpeedic Technology
  • Silvaco, Inc.
  • Magma Design Automation (acquired by Synopsys)
  • Empyrean Software
  • Tanner EDA (Mentor Graphics)
  • eSilicon
  • NanoDimension Ltd.
  • Applied Simulation Technology
  • Coventor, Inc.
  • Efinix, Inc.
  • Veeco Instruments Inc.
  • Tanner EDA
  • Optiwave Systems Inc.

Recent News

  • In January 2025, The introduction of a multi-node AI-driven verification environment enhanced the accuracy and speed of advanced chip design validation. By leveraging AI and distributed computing, this solution reduced errors and shortened development cycles, strengthening market demand and accelerating technological advancements within the Global Fab EDA Tools Market.


  • In May 2024, The launch of a cloud-based EDA deployment suite improved scalability and collaboration for chip designers, enabling seamless access to tools and resources remotely. This innovation accelerated design workflows and fostered global teamwork, significantly boosting efficiency and driving growth in the Global Fab EDA Tools Market.


Frequently Asked Questions (FAQ) :

Q1. What are the main growth-driving factors for this market?

The market is driven by the soaring complexity of semiconductor chips, which are shrinking to smaller process nodes like 3nm. Chip designers need highly advanced EDA tools to ensure these intricate designs work correctly before costly fabrication. Furthermore, the massive demand for AI, 5G, and automotive chips requires customized designs, accelerating tool adoption across the industry.

Q2. What are the main restraining factors for this market?

The main barrier is the exceptionally high cost of EDA software licenses and non-recurring engineering (NRE) fees, making advanced tools inaccessible to smaller design firms. Additionally, the industry faces a talent shortage of engineers skilled in designing and verifying chips at sub-5nm complexities, which slows down the adoption and full utilization of new EDA capabilities.

Q3. Which segment is expected to witness high growth?

The Semiconductor Foundries segment is expected to witness the highest growth over the forecast period due to increasing demand for advanced chip manufacturing services. Rising adoption of cutting-edge technologies, such as AI, 5G, and IoT, along with growing outsourcing trends by semiconductor companies, are driving significant expansion in this segment.

Q4. Who are the top major players for this market?

The Fab EDA market is dominated by a few key companies that control most of the crucial tools. The top players are Synopsys, Inc., Cadence Design Systems, Inc., and Siemens EDA (formerly Mentor Graphics). These firms compete heavily in areas like design verification, physical design, and integrating AI into the entire automated chip design process.

Q5. Which country is the largest player?

The largest country for EDA tool revenue is the United States, which dominates the North American market. This leadership is due to the presence of the world's largest chip design companies and leading EDA vendors. Strong government support, such as the CHIPS Act, further encourages domestic semiconductor research and development, solidifying the U.S.'s market share.

Fab EDA Tools MARKET STUDY GLOBAL MARKET ANALYSIS, INSIGHTS AND FORECAST, 2022-2029

    1. Introduction

    • 1.1. Research Scope
    • 1.2. Market Segmentation
    • 1.3. Research Methodology
    • 1.4. Definitions and Assumptions

    2. Executive Summary

      3. Market Dynamics

      • 3.1. Market Drivers
      • 3.2. Market Restraints
      • 3.3. Market Opportunities

      4. Key Insights

      • 4.1. Key Emerging Trends – For Major Countries
      • 4.2. Latest Technological Advancement
      • 4.3. Regulatory Landscape
      • 4.4. Industry SWOT Analysis
      • 4.5. Porters Five Forces Analysis

      5. Global Fab EDA Tools Market Analysis (USD Billion), Insights and Forecast, 2018-2029

      • 5.1. Key Findings / Summary
      • 5.2. Market Analysis, Insights and Forecast – By Segment 1
        • 5.2.1. Sub-Segment 1
        • 5.2.2. Sub-Segment 2
      • 5.3. Market Analysis, Insights and Forecast – By Segment 2
        • 5.3.1. Sub-Segment 1
        • 5.3.2. Sub-Segment 2
        • 5.3.3. Sub-Segment 3
        • 5.3.4. Others
      • 5.4. Market Analysis, Insights and Forecast – By Segment 3
        • 5.4.1. Sub-Segment 1
        • 5.4.2. Sub-Segment 2
        • 5.4.3. Sub-Segment 3
        • 5.4.4. Others
      • 5.5. Market Analysis, Insights and Forecast – By Region
        • 5.5.1. North America
        • 5.5.2. Latin America
        • 5.5.3. Europe
        • 5.5.4. Asia Pacific
        • 5.5.5. Middle East and Africa

      6. North America Fab EDA Tools Market Analysis (USD Billion), Insights and Forecast, 2018-2029

      • 6.1. Key Findings / Summary
      • 6.2. Market Analysis, Insights and Forecast – By Segment 1
        • 6.2.1. Sub-Segment 1
        • 6.2.2. Sub-Segment 2
      • 6.3. Market Analysis, Insights and Forecast – By Segment 2
        • 6.3.1. Sub-Segment 1
        • 6.3.2. Sub-Segment 2
        • 6.3.3. Sub-Segment 3
        • 6.3.4. Others
      • 6.4. Market Analysis, Insights and Forecast – By Segment 3
        • 6.4.1. Sub-Segment 1
        • 6.4.2. Sub-Segment 2
        • 6.4.3. Sub-Segment 3
        • 6.4.4. Others
      • 6.5. Market Analysis, Insights and Forecast – By Country
        • 6.5.1. U.S.
        • 6.5.2. Canada

      7. Latin America Fab EDA Tools Market Analysis (USD Billion), Insights and Forecast, 2018-2029

      • 7.1. Key Findings / Summary
      • 7.2. Market Analysis, Insights and Forecast – By Segment 1
        • 7.2.1. Sub-Segment 1
        • 7.2.2. Sub-Segment 2
      • 7.3. Market Analysis, Insights and Forecast – By Segment 2
        • 7.3.1. Sub-Segment 1
        • 7.3.2. Sub-Segment 2
        • 7.3.3. Sub-Segment 3
        • 7.3.4. Others
      • 7.4. Market Analysis, Insights and Forecast – By Segment 3
        • 7.4.1. Sub-Segment 1
        • 7.4.2. Sub-Segment 2
        • 7.4.3. Sub-Segment 3
        • 7.4.4. Others
      • 7.5. Insights and Forecast – By Country
        • 7.5.1. Brazil
        • 7.5.2. Mexico
        • 7.5.3. Rest of Latin America

      8. Europe Fab EDA Tools Market Analysis (USD Billion), Insights and Forecast, 2018-2029

      • 8.1. Key Findings / Summary
      • 8.2. Market Analysis, Insights and Forecast – By Segment 1
        • 8.2.1. Sub-Segment 1
        • 8.2.2. Sub-Segment 2
      • 8.3. Market Analysis, Insights and Forecast – By Segment 2
        • 8.3.1. Sub-Segment 1
        • 8.3.2. Sub-Segment 2
        • 8.3.3. Sub-Segment 3
        • 8.3.4. Others
      • 8.4. Market Analysis, Insights and Forecast – By Segment 3
        • 8.4.1. Sub-Segment 1
        • 8.4.2. Sub-Segment 2
        • 8.4.3. Sub-Segment 3
        • 8.4.4. Others
      • 8.5. Market Analysis, Insights and Forecast – By Country
        • 8.5.1. UK
        • 8.5.2. Germany
        • 8.5.3. France
        • 8.5.4. Italy
        • 8.5.5. Spain
        • 8.5.6. Russia
        • 8.5.7. Rest of Europe

      9. Asia Pacific Fab EDA Tools Market Analysis (USD Billion), Insights and Forecast, 2018-2029

      • 9.1. Key Findings / Summary
      • 9.2. Market Analysis, Insights and Forecast – By Segment 1
        • 9.2.1. Sub-Segment 1
        • 9.2.2. Sub-Segment 2
      • 9.3. Market Analysis, Insights and Forecast – By Segment 2
        • 9.3.1. Sub-Segment 1
        • 9.3.2. Sub-Segment 2
        • 9.3.3. Sub-Segment 3
        • 9.3.4. Others
      • 9.4. Market Analysis, Insights and Forecast – By Segment 3
        • 9.4.1. Sub-Segment 1
        • 9.4.2. Sub-Segment 2
        • 9.4.3. Sub-Segment 3
        • 9.4.4. Others
      • 9.5. Market Analysis, Insights and Forecast – By Country
        • 9.5.1. China
        • 9.5.2. India
        • 9.5.3. Japan
        • 9.5.4. Australia
        • 9.5.5. South East Asia
        • 9.5.6. Rest of Asia Pacific

      10. Middle East & Africa Fab EDA Tools Market Analysis (USD Billion), Insights and Forecast, 2018-2029

      • 10.1. Key Findings / Summary
      • 10.2. Market Analysis, Insights and Forecast – By Segment 1
        • 10.2.1. Sub-Segment 1
        • 10.2.2. Sub-Segment 2
      • 10.3. Market Analysis, Insights and Forecast – By Segment 2
        • 10.3.1. Sub-Segment 1
        • 10.3.2. Sub-Segment 2
        • 10.3.3. Sub-Segment 3
        • 10.3.4. Others
      • 10.4. Market Analysis, Insights and Forecast – By Segment 3
        • 10.4.1. Sub-Segment 1
        • 10.4.2. Sub-Segment 2
        • 10.4.3. Sub-Segment 3
        • 10.4.4. Others
      • 10.5. Market Analysis, Insights and Forecast – By Country
        • 10.5.1. GCC
        • 10.5.2. South Africa
        • 10.5.3. Rest of Middle East & Africa

      11. Competitive Analysis

      • 11.1. Company Market Share Analysis, 2018
      • 11.2. Key Industry Developments
      • 11.3. Company Profile
        • 11.3.1. Company 1
          • 11.3.1.1. Business Overview
          • 11.3.1.2. Segment 1 & Service Offering
          • 11.3.1.3. Overall Revenue
          • 11.3.1.4. Geographic Presence
          • 11.3.1.5. Recent Development
        *Similar details will be provided for the following companies
        • 11.3.2. Company 2
        • 11.3.3. Company 3
        • 11.3.4. Company 4
        • 11.3.5. Company 5
        • 11.3.6. Company 6
        • 11.3.7. Company 7
        • 11.3.8. Company 8
        • 11.3.9. Company 9
        • 11.3.10. Company 10
        • 11.3.11. Company 11
        • 11.3.12. Company 12
      List of Figures

      Figure 1: Global Fab EDA Tools Market Revenue Breakdown (USD Billion, %) by Region, 2022 & 2029
      Figure 2: Global Fab EDA Tools Market Value Share (%), By Segment 1, 2022 & 2029
      Figure 3: Global Fab EDA Tools Market Forecast (USD Billion), by Sub-Segment 1, 2018-2029
      Figure 4: Global Fab EDA Tools Market Forecast (USD Billion), by Sub-Segment 2, 2018-2029
      Figure 5: Global Fab EDA Tools Market Value Share (%), By Segment 2, 2022 & 2029
      Figure 6: Global Fab EDA Tools Market Forecast (USD Billion), by Sub-Segment 1, 2018-2029
      Figure 7: Global Fab EDA Tools Market Forecast (USD Billion), by Sub-Segment 2, 2018-2029
      Figure 8: Global Fab EDA Tools Market Forecast (USD Billion), by Sub-Segment 3, 2018-2029
      Figure 9: Global Fab EDA Tools Market Forecast (USD Billion), by Others, 2018-2029
      Figure 10: Global Fab EDA Tools Market Value Share (%), By Segment 3, 2022 & 2029
      Figure 11: Global Fab EDA Tools Market Forecast (USD Billion), by Sub-Segment 1, 2018-2029
      Figure 12: Global Fab EDA Tools Market Forecast (USD Billion), by Sub-Segment 2, 2018-2029
      Figure 13: Global Fab EDA Tools Market Forecast (USD Billion), by Sub-Segment 3, 2018-2029
      Figure 14: Global Fab EDA Tools Market Forecast (USD Billion), by Others, 2018-2029
      Figure 15: Global Fab EDA Tools Market Value (USD Billion), by Region, 2022 & 2029
      Figure 16: North America Fab EDA Tools Market Value Share (%), By Segment 1, 2022 & 2029
      Figure 17: North America Fab EDA Tools Market Forecast (USD Billion), by Sub-Segment 1, 2018-2029
      Figure 18: North America Fab EDA Tools Market Forecast (USD Billion), by Sub-Segment 2, 2018-2029
      Figure 19: North America Fab EDA Tools Market Value Share (%), By Segment 2, 2022 & 2029
      Figure 20: North America Fab EDA Tools Market Forecast (USD Billion), by Sub-Segment 1, 2018-2029
      Figure 21: North America Fab EDA Tools Market Forecast (USD Billion), by Sub-Segment 2, 2018-2029
      Figure 22: North America Fab EDA Tools Market Forecast (USD Billion), by Sub-Segment 3, 2018-2029
      Figure 23: North America Fab EDA Tools Market Forecast (USD Billion), by Others, 2018-2029
      Figure 24: North America Fab EDA Tools Market Value Share (%), By Segment 3, 2022 & 2029
      Figure 25: North America Fab EDA Tools Market Forecast (USD Billion), by Sub-Segment 1, 2018-2029
      Figure 26: North America Fab EDA Tools Market Forecast (USD Billion), by Sub-Segment 2, 2018-2029
      Figure 27: North America Fab EDA Tools Market Forecast (USD Billion), by Sub-Segment 3, 2018-2029
      Figure 28: North America Fab EDA Tools Market Forecast (USD Billion), by Others, 2018-2029
      Figure 29: North America Fab EDA Tools Market Forecast (USD Billion), by U.S., 2018-2029
      Figure 30: North America Fab EDA Tools Market Forecast (USD Billion), by Canada, 2018-2029
      Figure 31: Latin America Fab EDA Tools Market Value Share (%), By Segment 1, 2022 & 2029
      Figure 32: Latin America Fab EDA Tools Market Forecast (USD Billion), by Sub-Segment 1, 2018-2029
      Figure 33: Latin America Fab EDA Tools Market Forecast (USD Billion), by Sub-Segment 2, 2018-2029
      Figure 34: Latin America Fab EDA Tools Market Value Share (%), By Segment 2, 2022 & 2029
      Figure 35: Latin America Fab EDA Tools Market Forecast (USD Billion), by Sub-Segment 1, 2018-2029
      Figure 36: Latin America Fab EDA Tools Market Forecast (USD Billion), by Sub-Segment 2, 2018-2029
      Figure 37: Latin America Fab EDA Tools Market Forecast (USD Billion), by Sub-Segment 3, 2018-2029
      Figure 38: Latin America Fab EDA Tools Market Forecast (USD Billion), by Others, 2018-2029
      Figure 39: Latin America Fab EDA Tools Market Value Share (%), By Segment 3, 2022 & 2029
      Figure 40: Latin America Fab EDA Tools Market Forecast (USD Billion), by Sub-Segment 1, 2018-2029
      Figure 41: Latin America Fab EDA Tools Market Forecast (USD Billion), by Sub-Segment 2, 2018-2029
      Figure 42: Latin America Fab EDA Tools Market Forecast (USD Billion), by Sub-Segment 3, 2018-2029
      Figure 43: Latin America Fab EDA Tools Market Forecast (USD Billion), by Others, 2018-2029
      Figure 44: Latin America Fab EDA Tools Market Forecast (USD Billion), by Brazil, 2018-2029
      Figure 45: Latin America Fab EDA Tools Market Forecast (USD Billion), by Mexico, 2018-2029
      Figure 46: Latin America Fab EDA Tools Market Forecast (USD Billion), by Rest of Latin America, 2018-2029
      Figure 47: Europe Fab EDA Tools Market Value Share (%), By Segment 1, 2022 & 2029
      Figure 48: Europe Fab EDA Tools Market Forecast (USD Billion), by Sub-Segment 1, 2018-2029
      Figure 49: Europe Fab EDA Tools Market Forecast (USD Billion), by Sub-Segment 2, 2018-2029
      Figure 50: Europe Fab EDA Tools Market Value Share (%), By Segment 2, 2022 & 2029
      Figure 51: Europe Fab EDA Tools Market Forecast (USD Billion), by Sub-Segment 1, 2018-2029
      Figure 52: Europe Fab EDA Tools Market Forecast (USD Billion), by Sub-Segment 2, 2018-2029
      Figure 53: Europe Fab EDA Tools Market Forecast (USD Billion), by Sub-Segment 3, 2018-2029
      Figure 54: Europe Fab EDA Tools Market Forecast (USD Billion), by Others, 2018-2029
      Figure 55: Europe Fab EDA Tools Market Value Share (%), By Segment 3, 2022 & 2029
      Figure 56: Europe Fab EDA Tools Market Forecast (USD Billion), by Sub-Segment 1, 2018-2029
      Figure 57: Europe Fab EDA Tools Market Forecast (USD Billion), by Sub-Segment 2, 2018-2029
      Figure 58: Europe Fab EDA Tools Market Forecast (USD Billion), by Sub-Segment 3, 2018-2029
      Figure 59: Europe Fab EDA Tools Market Forecast (USD Billion), by Others, 2018-2029
      Figure 60: Europe Fab EDA Tools Market Forecast (USD Billion), by U.K., 2018-2029
      Figure 61: Europe Fab EDA Tools Market Forecast (USD Billion), by Germany, 2018-2029
      Figure 62: Europe Fab EDA Tools Market Forecast (USD Billion), by France, 2018-2029
      Figure 63: Europe Fab EDA Tools Market Forecast (USD Billion), by Italy, 2018-2029
      Figure 64: Europe Fab EDA Tools Market Forecast (USD Billion), by Spain, 2018-2029
      Figure 65: Europe Fab EDA Tools Market Forecast (USD Billion), by Russia, 2018-2029
      Figure 66: Europe Fab EDA Tools Market Forecast (USD Billion), by Rest of Europe, 2018-2029
      Figure 67: Asia Pacific Fab EDA Tools Market Value Share (%), By Segment 1, 2022 & 2029
      Figure 68: Asia Pacific Fab EDA Tools Market Forecast (USD Billion), by Sub-Segment 1, 2018-2029
      Figure 69: Asia Pacific Fab EDA Tools Market Forecast (USD Billion), by Sub-Segment 2, 2018-2029
      Figure 70: Asia Pacific Fab EDA Tools Market Value Share (%), By Segment 2, 2022 & 2029
      Figure 71: Asia Pacific Fab EDA Tools Market Forecast (USD Billion), by Sub-Segment 1, 2018-2029
      Figure 72: Asia Pacific Fab EDA Tools Market Forecast (USD Billion), by Sub-Segment 2, 2018-2029
      Figure 73: Asia Pacific Fab EDA Tools Market Forecast (USD Billion), by Sub-Segment 3, 2018-2029
      Figure 74: Asia Pacific Fab EDA Tools Market Forecast (USD Billion), by Others, 2018-2029
      Figure 75: Asia Pacific Fab EDA Tools Market Value Share (%), By Segment 3, 2022 & 2029
      Figure 76: Asia Pacific Fab EDA Tools Market Forecast (USD Billion), by Sub-Segment 1, 2018-2029
      Figure 77: Asia Pacific Fab EDA Tools Market Forecast (USD Billion), by Sub-Segment 2, 2018-2029
      Figure 78: Asia Pacific Fab EDA Tools Market Forecast (USD Billion), by Sub-Segment 3, 2018-2029
      Figure 79: Asia Pacific Fab EDA Tools Market Forecast (USD Billion), by Others, 2018-2029
      Figure 80: Asia Pacific Fab EDA Tools Market Forecast (USD Billion), by China, 2018-2029
      Figure 81: Asia Pacific Fab EDA Tools Market Forecast (USD Billion), by India, 2018-2029
      Figure 82: Asia Pacific Fab EDA Tools Market Forecast (USD Billion), by Japan, 2018-2029
      Figure 83: Asia Pacific Fab EDA Tools Market Forecast (USD Billion), by Australia, 2018-2029
      Figure 84: Asia Pacific Fab EDA Tools Market Forecast (USD Billion), by Southeast Asia, 2018-2029
      Figure 85: Asia Pacific Fab EDA Tools Market Forecast (USD Billion), by Rest of Asia Pacific, 2018-2029
      Figure 86: Middle East & Africa Fab EDA Tools Market Value Share (%), By Segment 1, 2022 & 2029
      Figure 87: Middle East & Africa Fab EDA Tools Market Forecast (USD Billion), by Sub-Segment 1, 2018-2029
      Figure 88: Middle East & Africa Fab EDA Tools Market Forecast (USD Billion), by Sub-Segment 2, 2018-2029
      Figure 89: Middle East & Africa Fab EDA Tools Market Value Share (%), By Segment 2, 2022 & 2029
      Figure 90: Middle East & Africa Fab EDA Tools Market Forecast (USD Billion), by Sub-Segment 1, 2018-2029
      Figure 91: Middle East & Africa Fab EDA Tools Market Forecast (USD Billion), by Sub-Segment 2, 2018-2029
      Figure 92: Middle East & Africa Fab EDA Tools Market Forecast (USD Billion), by Sub-Segment 3, 2018-2029
      Figure 93: Middle East & Africa Fab EDA Tools Market Forecast (USD Billion), by Others, 2018-2029
      Figure 94: Middle East & Africa Fab EDA Tools Market Value Share (%), By Segment 3, 2022 & 2029
      Figure 95: Middle East & Africa Fab EDA Tools Market Forecast (USD Billion), by Sub-Segment 1, 2018-2029
      Figure 96: Middle East & Africa Fab EDA Tools Market Forecast (USD Billion), by Sub-Segment 2, 2018-2029
      Figure 97: Middle East & Africa Fab EDA Tools Market Forecast (USD Billion), by Sub-Segment 3, 2018-2029
      Figure 98: Middle East & Africa Fab EDA Tools Market Forecast (USD Billion), by Others, 2018-2029
      Figure 99: Middle East & Africa Fab EDA Tools Market Forecast (USD Billion), by GCC, 2018-2029
      Figure 100: Middle East & Africa Fab EDA Tools Market Forecast (USD Billion), by South Africa, 2018-2029
      Figure 101: Middle East & Africa Fab EDA Tools Market Forecast (USD Billion), by Rest of Middle East & Africa, 2018-2029 
      List of Tables
      Table 1: Global Fab EDA Tools Market Revenue (USD Billion) Forecast, by Segment 1, 2018-2029
      Table 2: Global Fab EDA Tools Market Revenue (USD Billion) Forecast, by Segment 2, 2018-2029
      Table 3: Global Fab EDA Tools Market Revenue (USD Billion) Forecast, by Segment 3, 2018-2029
      Table 4: Global Fab EDA Tools Market Revenue (USD Billion) Forecast, by Region, 2018-2029
      Table 5: North America Fab EDA Tools Market Revenue (USD Billion) Forecast, by Segment 1, 2018-2029
      Table 6: North America Fab EDA Tools Market Revenue (USD Billion) Forecast, by Segment 2, 2018-2029
      Table 7: North America Fab EDA Tools Market Revenue (USD Billion) Forecast, by Segment 3, 2018-2029
      Table 8: North America Fab EDA Tools Market Revenue (USD Billion) Forecast, by Country, 2018-2029
      Table 9: Europe Fab EDA Tools Market Revenue (USD Billion) Forecast, by Segment 1, 2018-2029
      Table 10: Europe Fab EDA Tools Market Revenue (USD Billion) Forecast, by Segment 2, 2018-2029
      Table 11: Europe Fab EDA Tools Market Revenue (USD Billion) Forecast, by Segment 3, 2018-2029
      Table 12: Europe Fab EDA Tools Market Revenue (USD Billion) Forecast, by Country, 2018-2029
      Table 13: Latin America Fab EDA Tools Market Revenue (USD Billion) Forecast, by Segment 1, 2018-2029
      Table 14: Latin America Fab EDA Tools Market Revenue (USD Billion) Forecast, by Segment 2, 2018-2029
      Table 15: Latin America Fab EDA Tools Market Revenue (USD Billion) Forecast, by Segment 3, 2018-2029
      Table 16: Latin America Fab EDA Tools Market Revenue (USD Billion) Forecast, by Country, 2018-2029
      Table 17: Asia Pacific Fab EDA Tools Market Revenue (USD Billion) Forecast, by Segment 1, 2018-2029
      Table 18: Asia Pacific Fab EDA Tools Market Revenue (USD Billion) Forecast, by Segment 2, 2018-2029
      Table 19: Asia Pacific Fab EDA Tools Market Revenue (USD Billion) Forecast, by Segment 3, 2018-2029
      Table 20: Asia Pacific Fab EDA Tools Market Revenue (USD Billion) Forecast, by Country, 2018-2029
      Table 21: Middle East & Africa Fab EDA Tools Market Revenue (USD Billion) Forecast, by Segment 1, 2018-2029
      Table 22: Middle East & Africa Fab EDA Tools Market Revenue (USD Billion) Forecast, by Segment 2, 2018-2029
      Table 23: Middle East & Africa Fab EDA Tools Market Revenue (USD Billion) Forecast, by Segment 3, 2018-2029
      Table 24: Middle East & Africa Fab EDA Tools Market Revenue (USD Billion) Forecast, by Country, 2018-2029
      Research Process

      Data Library Research are conducted by industry experts who offer insight on industry structure, market segmentations technology assessment and competitive landscape (CL), and penetration, as well as on emerging trends. Their analysis is based on primary interviews (~ 80%) and secondary research (~ 20%) as well as years of professional expertise in their respective industries. Adding to this, by analysing historical trends and current market positions, our analysts predict where the market will be headed for the next five years. Furthermore, the varying trends of segment & categories geographically presented are also studied and the estimated based on the primary & secondary research.

      In this particular report from the supply side Data Library Research has conducted primary surveys (interviews) with the key level executives (VP, CEO’s, Marketing Director, Business Development Manager and SOFT) of the companies that active & prominent as well as the midsized organization

      FIGURE 1: DLR RESEARH PROCESS

      research-methodology1

      Primary Research

      Extensive primary research was conducted to gain a deeper insight of the market and industry performance. The analysis is based on both primary and secondary research as well as years of professional expertise in the respective industries.

      In addition to analysing current and historical trends, our analysts predict where the market is headed over the next five years.

      It varies by segment for these categories geographically presented in the list of market tables. Speaking about this particular report we have conducted primary surveys (interviews) with the key level executives (VP, CEO’s, Marketing Director, Business Development Manager and many more) of the major players active in the market.

      Secondary Research

      Secondary research was mainly used to collect and identify information useful for the extensive, technical, market-oriented, and Friend’s study of the Global Extra Neutral Alcohol. It was also used to obtain key information about major players, market classification and segmentation according to the industry trends, geographical markets, and developments related to the market and technology perspectives. For this study, analysts have gathered information from various credible sources, such as annual reports, sec filings, journals, white papers, SOFT presentations, and company web sites.

      Market Size Estimation

      Both, top-down and bottom-up approaches were used to estimate and validate the size of the Global market and to estimate the size of various other dependent submarkets in the overall Extra Neutral Alcohol. The key players in the market were identified through secondary research and their market contributions in the respective geographies were determined through primary and secondary research.

      Forecast Model

      research-methodology2