Get Complete Analysis Of The Report - Download Updated Free Sample PDF
The growth of the Global Fixed Catering Point of Sale (POS) Terminal Market is primarily driven by the increasing demand for automation and digitalization in the foodservice and hospitality sectors. Restaurants, quick-service outlets, corporate cafeterias, and institutional catering facilities are adopting fixed POS terminals to streamline order processing, improve transaction speed, manage inventory efficiently, and enhance overall customer experience. The surge in cashless payments, integration with loyalty programs, and real-time data analytics for operational insights are further encouraging adoption.
The Global Fixed Catering Point of Sale (POS) Terminal Market is being shaped by several compelling trends, including increased adoption of cloud-based POS software that enables real-time transaction tracking, centralized multi-location management, and seamless integration with online ordering and delivery platforms. Contactless and digital payments are gaining strong traction, fueled by consumer preference for hygienic, frictionless payment experiences and the proliferation of mobile wallets and QR code–based payment methods. AI and analytics capabilities are also being embedded in POS terminals to provide catering operators with predictive insights on customer behavior, demand forecasting, upselling opportunities, and inventory optimization.
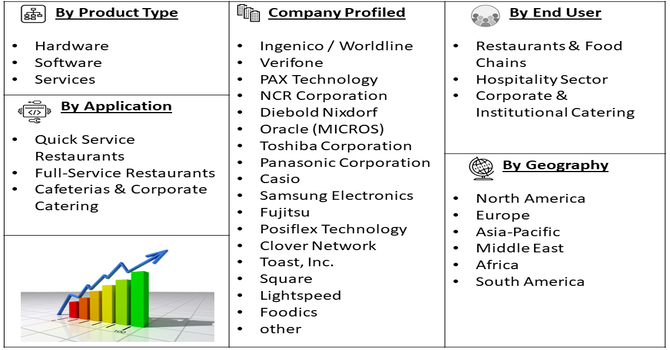
Segmentation: Global Fixed Catering Point of Sale Terminal Market is segmented By Type (Hardware, Software, Services), Deployment (On-Premise POS, Cloud-Based POS), Application (Quick Service Restaurants, Full-Service Restaurants, Cafeterias & Corporate Catering), End User (Restaurants & Food Chains, Hospitality Sector, Corporate & Institutional Catering), and Geography (North America, Europe, Asia-Pacific, Middle East and Africa, and South America). The report provides the value (in USD million) for the above segments.
For Detailed Market Segmentation - Get a Free Sample PDF
Market Drivers:
A primary driver of the Global Fixed Catering POS Terminal Market is the growing need for automation and efficiency in the foodservice and catering industry. Fixed POS terminals help streamline order taking, billing, and inventory management, enabling operators to reduce human errors, optimize workflow, and improve service speed.
In November 2025, PAR Technology Corporation announced that Erbert & Gerbert’s Sandwich Shop selected PAR POS, hardware, payment services, OPS Recovery, and managed services to drive its next phase of growth, following a successful experience with PAR’s Punchh loyalty platform. After reviewing leading restaurant tech providers, the chain chose PAR for its scalable, efficient systems. This adoption strengthened the global fixed catering POS terminal market by reinforcing the growing demand for automation, streamlined operations, and efficiency-focused foodservice technologies.
The rapid growth of quick-service restaurants (QSRs), cloud kitchens, and large-scale catering operations is another significant factor driving market growth. These establishments handle high volumes of transactions daily and require robust POS solutions to manage orders quickly and accurately.
Additionally, the increasing adoption of cashless and contactless payment methods—such as mobile wallets, NFC, and QR code-based payments—has accelerated demand for fixed POS terminals that support multiple payment options. The combined pressure of high transaction volumes, customer preference for convenient digital payments, and the need for integrated loyalty and rewards programs makes fixed POS systems a critical tool for modern catering and foodservice businesses.
Market Restraints:
The Global Fixed Catering Point of Sale (POS) Terminal Market faces several restraints that may limit its growth, with the high initial investment being a primary challenge. Setting up fixed POS systems—including hardware, software, and integration with existing infrastructure—can be costly for small and medium-sized catering businesses, limiting adoption. Additionally, the complexity of installation, the need for staff training, and ongoing maintenance requirements pose operational challenges, particularly for businesses with limited technical expertise. Compatibility issues with legacy systems or third-party applications can further hinder seamless integration, while cybersecurity and data privacy concerns regarding sensitive customer and transaction information act as additional barriers.
The global fixed catering Point of Sale (POS) terminal market has a broad socioeconomic impact by helping foodservice businesses improve efficiency, reduce waste, and increase profitability, which in turn supports job creation and economic growth across the hospitality sector. As restaurants, cafeterias, and catering services adopt modern POS systems, they benefit from faster transactions, better inventory control, and data-driven decision-making, leading to more stable operations and improved customer satisfaction. This technological shift also encourages digital literacy and creates demand for skilled workers in software support, maintenance, and data management. Moreover, the increasing adoption of POS solutions by small and medium-sized enterprises helps level the playing field with larger competitors, promoting more inclusive economic development.
Segmental Analysis:
Within the type segment, Hardware dominates as a critical component of fixed catering POS systems, encompassing terminals, touchscreens, receipt printers, cash drawers, and payment devices. These durable devices are essential for high-volume catering environments, enabling fast and accurate order processing, secure payments, and reliable operation in busy kitchens and service areas. The robustness and reliability of POS hardware make it indispensable for restaurants, cafeterias, and catering services where continuous operation is required.
Cloud-Based POS systems are gaining traction due to their flexibility, scalability, and ability to provide real-time data across multiple locations. Unlike traditional on-premise systems, cloud POS allows operators to manage orders, monitor sales, track inventory, and generate reports remotely, facilitating multi-location management and centralized decision-making. The rising demand for remote accessibility and integration with online ordering and delivery platforms is driving the adoption of cloud-based solutions in the catering sector.
Quick Service Restaurants represent a significant application segment as they handle high volumes of transactions and require rapid, accurate order processing. Fixed POS terminals in QSRs help streamline order intake, manage payments efficiently, integrate with kitchen display systems, and support loyalty programs. The growth of QSR chains worldwide, fueled by fast-paced lifestyles and increasing urbanization, is a major factor boosting the demand for fixed POS systems in this application.
Restaurants and food chains form the largest end-user segment due to their extensive need for order management, billing, and operational analytics. Fixed POS terminals enable these establishments to enhance customer experience, reduce errors, and improve workflow efficiency across dine-in, takeaway, and delivery services.
Chain restaurants benefit particularly from POS systems that provide multi-location management, real-time sales tracking, and integration with loyalty and marketing programs. For instance, October 2025, SpotOn, a restaurant management system designed for operators, was named the #1 Restaurant POS in G2’s Fall 2025 Grid Report based on verified feedback from owners, managers, and staff. It surpassed major competitor Toast across several performance categories, reflecting strong satisfaction and support. This recognition positively influenced the global fixed catering POS terminal market by boosting demand for high-performing, user-driven systems and encouraging greater competition, innovation, and service quality across the industry.
The Asia-Pacific segment is expected to witness the highest growth in the global fixed catering Point of Sale (POS) terminal market over the forecast period, driven by rapid urbanization, a booming foodservice industry, and increasing adoption of digital payment solutions.
Growing numbers of restaurants, cloud kitchens, and quick-service chains, especially in countries like China, India, and Southeast Asian nations, are accelerating the demand for modern POS systems that enhance operational efficiency and customer experience. For instance, in 2025, Meituan, China’s leading food delivery platform, expanded into the U.S. restaurant sector by launching Peppr, a POS system aimed at supporting small, independent eateries. Despite the crowded U.S. tech landscape, Meituan viewed the market as a strong growth opportunity. This move positively influenced China’s fixed catering POS terminal market by showcasing Chinese tech competitiveness, encouraging innovation, and driving further development of advanced, export-ready POS solutions within the country.
Government initiatives promoting digital transactions, expanding internet penetration, and rising consumer preference for convenient, tech-enabled dining further strengthen market expansion in the region. Additionally, the presence of cost-effective hardware manufacturers and strong investments in hospitality technology make Asia-Pacific a key hotspot for sustained POS market growth.
| Report Matrics | Details |
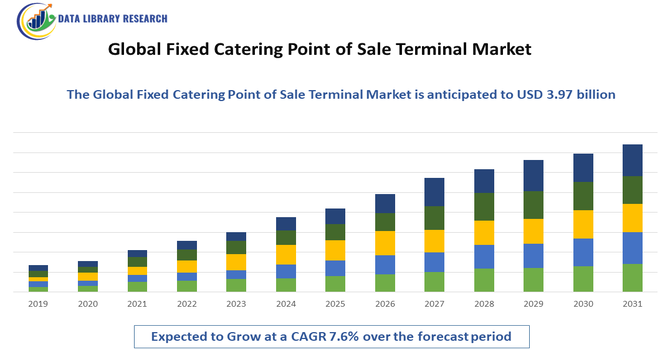
| Market Size Value | USD 3.97 billion |
| Growth Rate | CAGR of 7.6% |
| Forecast | 2026-2033 |
| Historical data | 2021-2024 |
| Base Year | 2025 |
| Report Coverage | Forecasted revenue, company rating, competitive environment, growth drivers, and trends |
| Segment Coverage | Type, Application, End-User, Geography |
| Regional Scope | North America, Europe, Asia Pacific, Middle East |
| Customized scope | Free customization of reports (With 3 months Analysis Support ) |
| To Learn More About This Report | Request a Free Sample Copy |
The competitive landscape of the Global Fixed Catering POS Terminal Market is characterized by a mix of leading payment technology firms, hardware manufacturers, and restaurant-focused POS providers, all competing on product robustness, integration with cloud services, payment security, and customer service support. Major players are increasingly focusing on innovations such as contactless payment, AI-driven analytics, and scalable software platforms to differentiate and gain market share.
Key Players:
Recent Development
Q1. What are the main growth-driving factors for this market?
The market is primarily driven by the food service industry's increasing need for streamlined and efficient operations, especially in Quick Service Restaurants (QSRs) and Full-Service Restaurants (FSRs). A major factor is the global shift toward digital and contactless payments, which accelerated during the pandemic. Furthermore, the adoption of cloud-based POS systems, which offer remote management and real-time data analytics, is fueling the demand for reliable fixed terminals.
Q2. What are the main restraining factors for this market?
Key restraining factors include the high initial costs associated with purchasing and implementing sophisticated POS hardware and software, especially for smaller businesses. Additionally, the increasing risk of cybersecurity threats and data breaches creates hesitation among merchants. Businesses must also navigate the complexity of integrating new POS systems with their existing inventory and operational software, which can be time-consuming and expensive.
Q3. Which segment is expected to witness high growth?
While fixed terminals hold a dominant market share, the cloud-based deployment segment is anticipated to witness the highest growth rate. This is due to the rising demand for flexible, scalable, and cost-effective solutions that allow remote data access and management for multi-location catering businesses. Within the application area, the Quick Service Restaurant (QSR) segment is also expected to grow rapidly due to its high volume of daily transactions.
Q4. Who are the top major players for this market?
The fixed catering POS terminal market is highly competitive, featuring global technology and payment giants. Some of the top major players include NCR Corporation, Oracle Corporation, Verifone Systems Inc., and Ingenico. These companies compete by focusing on innovation, offering integrated software solutions, and expanding their cloud-based platforms to provide comprehensive, secure, and user-friendly systems for restaurants and other food service establishments worldwide.
Q5. Which country is the largest player?
The Asia-Pacific (APAC) region currently holds the largest market share for POS terminals globally, driven by rapid urbanization, significant growth in the food service sector, and widespread government support for digital and mobile payment adoption. Within APAC, major contributors like China and India are at the forefront, where the sheer volume of businesses and consumers transitioning to digital transactions fuels massive demand for fixed terminal infrastructure.
Data Library Research are conducted by industry experts who offer insight on industry structure, market segmentations technology assessment and competitive landscape (CL), and penetration, as well as on emerging trends. Their analysis is based on primary interviews (~ 80%) and secondary research (~ 20%) as well as years of professional expertise in their respective industries. Adding to this, by analysing historical trends and current market positions, our analysts predict where the market will be headed for the next five years. Furthermore, the varying trends of segment & categories geographically presented are also studied and the estimated based on the primary & secondary research.
In this particular report from the supply side Data Library Research has conducted primary surveys (interviews) with the key level executives (VP, CEO’s, Marketing Director, Business Development Manager and SOFT) of the companies that active & prominent as well as the midsized organization
FIGURE 1: DLR RESEARH PROCESS
Extensive primary research was conducted to gain a deeper insight of the market and industry performance. The analysis is based on both primary and secondary research as well as years of professional expertise in the respective industries.
In addition to analysing current and historical trends, our analysts predict where the market is headed over the next five years.
It varies by segment for these categories geographically presented in the list of market tables. Speaking about this particular report we have conducted primary surveys (interviews) with the key level executives (VP, CEO’s, Marketing Director, Business Development Manager and many more) of the major players active in the market.
Secondary ResearchSecondary research was mainly used to collect and identify information useful for the extensive, technical, market-oriented, and Friend’s study of the Global Extra Neutral Alcohol. It was also used to obtain key information about major players, market classification and segmentation according to the industry trends, geographical markets, and developments related to the market and technology perspectives. For this study, analysts have gathered information from various credible sources, such as annual reports, sec filings, journals, white papers, SOFT presentations, and company web sites.
Market Size EstimationBoth, top-down and bottom-up approaches were used to estimate and validate the size of the Global market and to estimate the size of various other dependent submarkets in the overall Extra Neutral Alcohol. The key players in the market were identified through secondary research and their market contributions in the respective geographies were determined through primary and secondary research.
Forecast Model