Flexible Screen Crystal Encapsulation Market Overview and Analysis

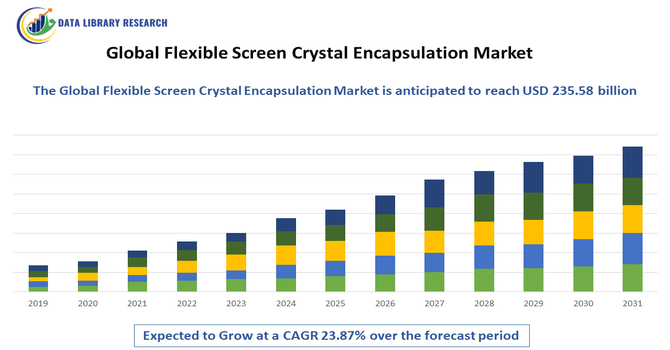
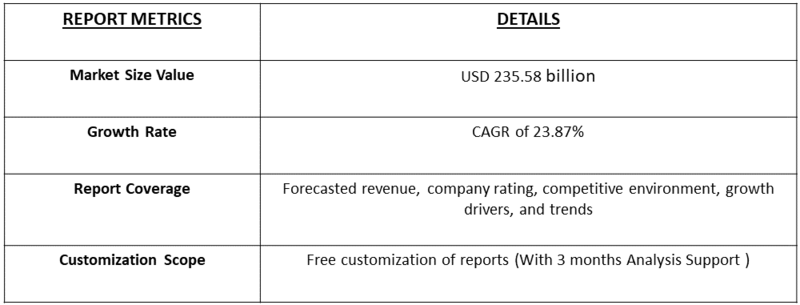
The Global Flexible Screen Crystal Encapsulation Market is approximately USD valued at 29.28 billion in the year 2025, and approximately to reach USD 235.58 billion in the year 2032, growing with a CAGR of 23.87% over the forecast period.

The Global Flexible Screen Crystal Encapsulation Market refers to the industry focused on the development, production, and commercialization of encapsulation materials and technologies used to protect flexible display screens—such as those found in foldable smartphones, wearable devices, and flexible OLED panels—from environmental damage like moisture, oxygen, and mechanical stress. This market encompasses innovations in thin-film encapsulation (TFE), hybrid encapsulation, and barrier coatings that ensure the durability and performance of flexible screens, driven by growing demand in consumer electronics, automotive displays, and emerging tech applications across global markets.

Flexible Screen Crystal Encapsulation Market Latest Trends

The Global Flexible Screen Crystal Encapsulation Market is witnessing significant trends driven by rapid advancements in display technology and growing adoption of flexible OLED panels across consumer electronics. Key trends include increased use of thin-film encapsulation (TFE) for ultra-thin and lightweight devices, rising integration of hybrid encapsulation methods for improved durability, and a surge in demand for foldable smartphones and wearables. Additionally, manufacturers are focusing on eco-friendly materials, enhanced barrier performance, and scalability of production processes to meet growing global demand, particularly in Asia-Pacific and North America.

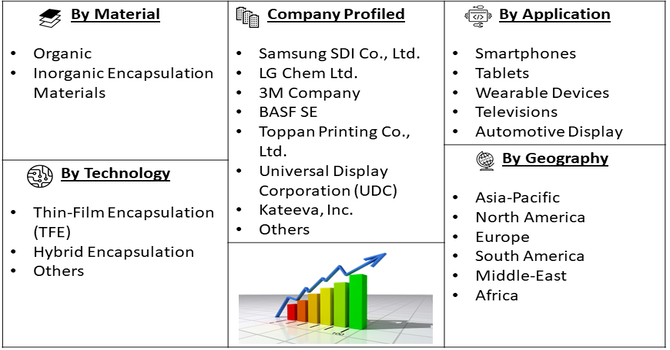
Segmentation: The Global Flexible Screen Crystal Encapsulation Market is segmented based by Material (Organic and Inorganic Encapsulation Materials), Technology (Thin-Film Encapsulation (TFE), Hybrid Encapsulation, and Others), Application (Smartphones, Tablets, Wearable Devices, Televisions, and Automotive Display) and Geography (North America, Europe, Asia-Pacific, Latin America, Middle East & Africa). The report provides the value (in USD million) for the above segments.

Market Drivers:

  • Rising Demand for Flexible and Foldable Electronics

The major driver of the flexible screen crystal encapsulation market is the growing global demand for flexible, foldable, and rollable electronic devices, particularly smartphones and wearables. Consumers are increasingly drawn to innovative form factors that offer portability without compromising screen size or performance. This trend has pushed manufacturers to adopt flexible OLED technology, which requires high-performance encapsulation to protect delicate components from moisture, dust, and oxygen exposure. Foldable smartphones from brands like Samsung, Huawei, and Motorola have already demonstrated strong market traction, accelerating investment in encapsulation solutions. As product lifespans and durability become more critical to consumers, effective encapsulation becomes essential, further driving demand for advanced materials and technologies in this evolving electronics landscape.

  • Advancements in OLED and Thin-Film Encapsulation Technologies

Another key driver for this market is the technological progress in OLED displays and thin-film encapsulation (TFE) techniques. OLEDs are thinner, more energy-efficient, and offer better contrast and flexibility than traditional LCDs. However, their sensitivity to moisture and oxygen necessitates highly effective encapsulation solutions. Thin-film encapsulation, in particular, has emerged as a preferred method because it enables ultra-slim, lightweight, and flexible devices without sacrificing protection. Innovations in atomic layer deposition (ALD), inkjet printing of barrier layers, and hybrid material development are helping manufacturers achieve superior encapsulation at reduced costs. These advancements are making flexible displays more viable for mass production, increasing their presence in smartphones, TVs, and wearables—and in turn, boosting demand for encapsulation solutions.

Market Restraints:

  • High Production Costs and Technical Complexity

Despite its promising growth, the flexible screen crystal encapsulation market faces a major restraint in the form of high production costs and technical complexities. The development and application of advanced encapsulation techniques like thin-film or hybrid methods require expensive equipment, specialized materials, and highly controlled manufacturing environments. Additionally, ensuring consistent barrier performance while maintaining display flexibility poses significant engineering challenges. For smaller manufacturers or those in developing regions, these hurdles can limit entry and scalability. Moreover, any defect or inconsistency in encapsulation can severely affect product lifespan and reliability, leading to higher rejection rates and losses. As a result, many companies hesitate to invest heavily in flexible display production without guaranteed returns, slowing broader market adoption.

Social Economic Impact on Flexible Screen Crystal Encapsulation Market

The socio-economic impact of the Global Flexible Screen Crystal Encapsulation Market is significant, as it supports the rapid evolution of next-generation consumer electronics, enhancing user experience and driving digital lifestyle adoption. Economically, it contributes to job creation in high-tech manufacturing, R&D, and supply chain sectors, particularly in regions like Asia-Pacific and North America. The market also fosters innovation and competitiveness among tech companies, encouraging investment in advanced materials and sustainable production methods. Socially, it promotes the proliferation of portable, energy-efficient, and multifunctional devices that improve communication, healthcare monitoring (through wearables), and infotainment accessibility. As flexible electronics become more mainstream, they can bridge the digital divide and enhance quality of life, especially in developing regions through affordable and durable smart devices.

Segmental Analysis:

  • Inorganic Encapsulation Materials Segment is Expected to Witness High Growth Over the Forecasted Period

The inorganic encapsulation materials segment is projected to witness significant growth due to its superior barrier properties against moisture, oxygen, and other environmental contaminants. Materials such as silicon nitride and aluminum oxide are commonly used for their excellent chemical stability and durability, making them ideal for protecting sensitive flexible OLED and AMOLED displays. Inorganic encapsulation is especially critical in applications requiring long-term reliability, such as foldable smartphones and high-end wearables. As manufacturers aim for enhanced performance and extended product lifespan, the demand for high-quality inorganic barrier films is rising.

Additionally, advancements in atomic layer deposition (ALD) techniques are improving the scalability and uniformity of inorganic coatings, further driving their adoption across large-scale production environments. For instance, in May 2025, an article published in the journal, npj Flexible Electronics, reported that research developed a silbione-blended organic/inorganic hybrid epoxy polymer (SBH) that significantly enhances the mechanical flexibility and durability of thin-film encapsulation for wearable organic light-emitting diodes (OLEDs) devices. The SBH films demonstrated superior toughness, low water vapor transmission rates, and strong protection under harsh conditions, making them highly suitable for flexible, wearable electronics. This advancement strengthens the inorganic encapsulation materials segment by improving barrier reliability and flexibility, supporting broader adoption of durable, high-performance flexible displays in the wearable market.

  • Thin-Film Encapsulation (TFE) Segment is Expected to Witness High Growth Over the Forecasted Period

The thin-film encapsulation (TFE) segment is anticipated to see substantial growth due to its ability to provide lightweight, flexible, and highly effective protection for advanced displays. TFE consists of alternating layers of organic and inorganic materials, creating a multi-layer barrier that resists moisture and oxygen ingress while maintaining device flexibility. This technology is particularly important for foldable and rollable OLED displays, where traditional rigid encapsulation methods are unsuitable. The rising popularity of ultra-slim devices like foldable smartphones, curved televisions, and flexible wearables is driving TFE adoption. Furthermore, technological improvements in deposition methods—such as atomic layer deposition (ALD) and inkjet printing—are making TFE more cost-effective and scalable, enabling broader integration across the electronics industry and fueling segment growth.

  • Smart Phones Segment is Expected to Witness High Growth Over the Forecasted Period

The smartphones segment is expected to be the fastest-growing application area within the flexible screen crystal encapsulation market. As leading smartphone manufacturers increasingly incorporate foldable and flexible OLED screens into their flagship models, the need for durable, lightweight, and effective encapsulation solutions becomes critical. Consumer demand for innovation, larger displays in smaller form factors, and premium features is accelerating the shift toward foldable phones. Encapsulation plays a key role in protecting these sensitive flexible displays from environmental damage, ensuring device longevity and performance. Major brands like Samsung, Huawei, and Motorola are investing heavily in flexible display technology, which in turn boosts the demand for encapsulation materials and technologies. The trend is expected to continue as foldable smartphones move into mainstream adoption.

  • Asia-Pacific Region is Expected to Witness High Growth Over the Forecasted Period

The Asia-Pacific region is poised to witness the highest growth in the flexible screen crystal encapsulation market, driven by the presence of leading display manufacturers and strong demand for consumer electronics. Countries like South Korea, China, Japan, and Taiwan are home to major players such as Samsung Display, LG Display, and BOE Technology, which are at the forefront of flexible OLED production.

The region benefits from robust manufacturing infrastructure, significant R&D investment, and supportive government policies promoting high-tech industries. For instance, in February 2025, ASUS announced the all-new Zenfone 12 Ultra, a premium 6.78-inch smartphone designed to redefine elegance, functionality, and innovation. Powered by the latest Snapdragon 8 Elite Mobile Platform, this flagship device combined modern style with advanced AI features, offering both on-device and cloud-based AI options. It also emphasized sustainable design, setting a new benchmark for premium smartphones in terms of performance and eco-friendliness. This announcement influenced the flexible screen crystal encapsulation market by increasing demand for high-quality, durable encapsulation materials that support large, advanced displays with AI capabilities. ASUS’s focus on premium design and sustainability pushed manufacturers to innovate more reliable and eco-friendly encapsulation solutions, thereby advancing the market’s growth and technological development.

Rapid urbanization, rising disposable incomes, and increased smartphone penetration in emerging markets like India and Southeast Asia further fuel demand for flexible electronic devices. As a result, the Asia-Pacific region is expected to remain a central hub for production, innovation, and consumption throughout the forecast period.

Flexible Screen Crystal Encapsulation Market Competitive Landscape

The competitive landscape of the Global Flexible Screen Crystal Encapsulation Market is characterized by intense innovation, strategic partnerships, and strong R&D investment among key players aiming to gain technological leadership. Major companies such as Samsung SDI, LG Chem, 3M, BASF, Toppan Printing, and Universal Display Corporation dominate the market with advanced encapsulation technologies, particularly in thin-film and hybrid solutions. These players focus on enhancing barrier performance, reducing production costs, and scaling up manufacturing to meet rising demand from flexible OLED display manufacturers. Startups and smaller firms are also entering the market with niche innovations, contributing to healthy competition. Additionally, collaborations between material suppliers and electronics manufacturers are accelerating product development cycles and enabling faster commercialization of next-generation flexible devices.

List 20 major players for above market are:

  • Samsung SDI Co., Ltd.
  • LG Chem Ltd.
  • 3M Company
  • BASF SE
  • Toppan Printing Co., Ltd.
  • Universal Display Corporation (UDC)
  • Kateeva, Inc.
  • BOE Technology Group Co., Ltd.
  • DuPont de Nemours, Inc.
  • Toray Industries, Inc.
  • Merck KGaA
  • Applied Materials, Inc.
  • Veeco Instruments Inc.
  • Sumitomo Chemical Co., Ltd.
  • BarriTech
  • Cambrios Technologies Corporation
  • Rolic Technologies (a BASF company)
  • Fraunhofer FEP (Research Institute)
  • Innolux Corporation
  • Kyung-In Synthetic Corporation (KISCO)

Recent Developments

  • In March 2025, Samsung Electronics Co., Ltd. unveiled the Galaxy A56 5G, Galaxy A36 5G, and Galaxy A26 5G, the latest additions to its Galaxy A series. This launch positively impacted the flexible screen crystal encapsulation market by driving demand for advanced encapsulation materials and technologies that support durability and longevity in mid-range smartphones. Samsung’s focus on enhancing device robustness and integrating AI features highlighted the need for reliable flexible displays, accelerating innovation and adoption of improved encapsulation solutions within the industry.


  • In February 2024, an article published in the journal, Micromachines, reported that Plasma-Enhanced Atomic Layer Deposition (PEALD) and Molecular Layer Deposition (MLD) techniques for creating organic–inorganic hybrid thin-film encapsulation in flexible organic electroluminescent devices. It emphasized on the importance of these devices, explains how PEALD and MLD improve packaging, and discusses methods to optimize encapsulation layers. The study highlights result on stability and reliability, summarizing current progress and suggesting future research directions to enhance performance and commercial viability in flexible electronics.


Frequently Asked Questions (FAQ) :

Q1. What are the main growth driving factors for this market?

The main drivers include the rising demand for flexible and foldable displays in smartphones, tablets, and wearable tech, along with advancements in OLED and AMOLED technologies. Consumer preference for lightweight, durable, and innovative electronics is pushing manufacturers to adopt flexible screen solutions. Additionally, increased R&D investments and rapid product launches by key players are boosting market growth globally.

Q2. What are the main restraining factors for this market?

The key restraints include the high cost of production and encapsulation materials, as well as complex manufacturing processes that require advanced infrastructure. Technical challenges in achieving long-term durability and perfect barrier protection can also hinder widespread adoption. Additionally, limited availability of skilled workforce and slow standardization of encapsulation technologies may slow down market expansion, especially among smaller manufacturers and emerging economies.

Q3. Which segment is expected to witness high growth?

The consumer electronics segment, particularly flexible smartphones and wearable devices, is expected to witness the highest growth. This is driven by increasing consumer demand for compact, foldable, and lightweight devices. Flexible OLED screens are gaining popularity due to their superior display quality and flexibility. As tech giants innovate with next-gen devices, the need for advanced encapsulation solutions in this segment continues to grow rapidly.

Q4. Who are the top major players for this market?

Leading players in the market include Samsung SDI, LG Chem, Toppan Printing Co. Ltd., 3M, and BASF. These companies invest heavily in R&D and advanced encapsulation technologies to maintain their market edge. They are involved in partnerships and product innovation to support the flexible display industry. Other notable players include Universal Display Corporation and Kateeva, contributing to technological advancements in this space.

Q5. Which country is the largest player?

South Korea is the largest player in the global flexible screen crystal encapsulation market, primarily due to the presence of major display manufacturers like Samsung and LG. The country leads in OLED technology, R&D capabilities, and mass production infrastructure. Its strong tech ecosystem and government support for electronics innovation have helped position South Korea at the forefront of this rapidly growing market.

Flexible Screen Crystal Encapsulation MARKET STUDY GLOBAL MARKET ANALYSIS, INSIGHTS AND FORECAST, 2023-2029

    1. Introduction

    • 1.1. Research Scope
    • 1.2. Market Segmentation
    • 1.3. Research Methodology
    • 1.4. Definitions and Assumptions

    2. Executive Summary

      3. Market Dynamics

      • 3.1. Market Drivers
      • 3.2. Market Restraints
      • 3.3. Market Opportunities

      4. Key Insights

      • 4.1. Key Emerging Trends – For Major Countries
      • 4.2. Latest Technological Advancement
      • 4.3. Regulatory Landscape
      • 4.4. Industry SWOT Analysis
      • 4.5. Porters Five Forces Analysis

      5. Global Flexible Screen Crystal Encapsulation Market Analysis (USD Billion), Insights and Forecast, 2018-2029

      • 5.1. Key Findings / Summary
      • 5.2. Market Analysis, Insights and Forecast – By Segment 1
        • 5.2.1. Sub-Segment 1
        • 5.2.2. Sub-Segment 2
      • 5.3. Market Analysis, Insights and Forecast – By Segment 2
        • 5.3.1. Sub-Segment 1
        • 5.3.2. Sub-Segment 2
        • 5.3.3. Sub-Segment 3
        • 5.3.4. Others
      • 5.4. Market Analysis, Insights and Forecast – By Segment 3
        • 5.4.1. Sub-Segment 1
        • 5.4.2. Sub-Segment 2
        • 5.4.3. Sub-Segment 3
        • 5.4.4. Others
      • 5.5. Market Analysis, Insights and Forecast – By Region
        • 5.5.1. North America
        • 5.5.2. Latin America
        • 5.5.3. Europe
        • 5.5.4. Asia Pacific
        • 5.5.5. Middle East and Africa

      6. North America Flexible Screen Crystal Encapsulation Market Analysis (USD Billion), Insights and Forecast, 2018-2029

      • 6.1. Key Findings / Summary
      • 6.2. Market Analysis, Insights and Forecast – By Segment 1
        • 6.2.1. Sub-Segment 1
        • 6.2.2. Sub-Segment 2
      • 6.3. Market Analysis, Insights and Forecast – By Segment 2
        • 6.3.1. Sub-Segment 1
        • 6.3.2. Sub-Segment 2
        • 6.3.3. Sub-Segment 3
        • 6.3.4. Others
      • 6.4. Market Analysis, Insights and Forecast – By Segment 3
        • 6.4.1. Sub-Segment 1
        • 6.4.2. Sub-Segment 2
        • 6.4.3. Sub-Segment 3
        • 6.4.4. Others
      • 6.5. Market Analysis, Insights and Forecast – By Country
        • 6.5.1. U.S.
        • 6.5.2. Canada

      7. Latin America Flexible Screen Crystal Encapsulation Market Analysis (USD Billion), Insights and Forecast, 2018-2029

      • 7.1. Key Findings / Summary
      • 7.2. Market Analysis, Insights and Forecast – By Segment 1
        • 7.2.1. Sub-Segment 1
        • 7.2.2. Sub-Segment 2
      • 7.3. Market Analysis, Insights and Forecast – By Segment 2
        • 7.3.1. Sub-Segment 1
        • 7.3.2. Sub-Segment 2
        • 7.3.3. Sub-Segment 3
        • 7.3.4. Others
      • 7.4. Market Analysis, Insights and Forecast – By Segment 3
        • 7.4.1. Sub-Segment 1
        • 7.4.2. Sub-Segment 2
        • 7.4.3. Sub-Segment 3
        • 7.4.4. Others
      • 7.5. Insights and Forecast – By Country
        • 7.5.1. Brazil
        • 7.5.2. Mexico
        • 7.5.3. Rest of Latin America

      8. Europe Flexible Screen Crystal Encapsulation Market Analysis (USD Billion), Insights and Forecast, 2018-2029

      • 8.1. Key Findings / Summary
      • 8.2. Market Analysis, Insights and Forecast – By Segment 1
        • 8.2.1. Sub-Segment 1
        • 8.2.2. Sub-Segment 2
      • 8.3. Market Analysis, Insights and Forecast – By Segment 2
        • 8.3.1. Sub-Segment 1
        • 8.3.2. Sub-Segment 2
        • 8.3.3. Sub-Segment 3
        • 8.3.4. Others
      • 8.4. Market Analysis, Insights and Forecast – By Segment 3
        • 8.4.1. Sub-Segment 1
        • 8.4.2. Sub-Segment 2
        • 8.4.3. Sub-Segment 3
        • 8.4.4. Others
      • 8.5. Market Analysis, Insights and Forecast – By Country
        • 8.5.1. UK
        • 8.5.2. Germany
        • 8.5.3. France
        • 8.5.4. Italy
        • 8.5.5. Spain
        • 8.5.6. Russia
        • 8.5.7. Rest of Europe

      9. Asia Pacific Flexible Screen Crystal Encapsulation Market Analysis (USD Billion), Insights and Forecast, 2018-2029

      • 9.1. Key Findings / Summary
      • 9.2. Market Analysis, Insights and Forecast – By Segment 1
        • 9.2.1. Sub-Segment 1
        • 9.2.2. Sub-Segment 2
      • 9.3. Market Analysis, Insights and Forecast – By Segment 2
        • 9.3.1. Sub-Segment 1
        • 9.3.2. Sub-Segment 2
        • 9.3.3. Sub-Segment 3
        • 9.3.4. Others
      • 9.4. Market Analysis, Insights and Forecast – By Segment 3
        • 9.4.1. Sub-Segment 1
        • 9.4.2. Sub-Segment 2
        • 9.4.3. Sub-Segment 3
        • 9.4.4. Others
      • 9.5. Market Analysis, Insights and Forecast – By Country
        • 9.5.1. China
        • 9.5.2. India
        • 9.5.3. Japan
        • 9.5.4. Australia
        • 9.5.5. South East Asia
        • 9.5.6. Rest of Asia Pacific

      10. Middle East & Africa Flexible Screen Crystal Encapsulation Market Analysis (USD Billion), Insights and Forecast, 2018-2029

      • 10.1. Key Findings / Summary
      • 10.2. Market Analysis, Insights and Forecast – By Segment 1
        • 10.2.1. Sub-Segment 1
        • 10.2.2. Sub-Segment 2
      • 10.3. Market Analysis, Insights and Forecast – By Segment 2
        • 10.3.1. Sub-Segment 1
        • 10.3.2. Sub-Segment 2
        • 10.3.3. Sub-Segment 3
        • 10.3.4. Others
      • 10.4. Market Analysis, Insights and Forecast – By Segment 3
        • 10.4.1. Sub-Segment 1
        • 10.4.2. Sub-Segment 2
        • 10.4.3. Sub-Segment 3
        • 10.4.4. Others
      • 10.5. Market Analysis, Insights and Forecast – By Country
        • 10.5.1. GCC
        • 10.5.2. South Africa
        • 10.5.3. Rest of Middle East & Africa

      11. Competitive Analysis

      • 11.1. Company Market Share Analysis, 2018
      • 11.2. Key Industry Developments
      • 11.3. Company Profile
        • 11.3.1. Company 1
          • 11.3.1.1. Business Overview
          • 11.3.1.2. Segment 1 & Service Offering
          • 11.3.1.3. Overall Revenue
          • 11.3.1.4. Geographic Presence
          • 11.3.1.5. Recent Development
        *Similar details will be provided for the following companies
        • 11.3.2. Company 2
        • 11.3.3. Company 3
        • 11.3.4. Company 4
        • 11.3.5. Company 5
        • 11.3.6. Company 6
        • 11.3.7. Company 7
        • 11.3.8. Company 8
        • 11.3.9. Company 9
        • 11.3.10. Company 10
        • 11.3.11. Company 11
        • 11.3.12. Company 12
      List of Figures

      Figure 1: Global Flexible Screen Crystal Encapsulation Market Revenue Breakdown (USD Billion, %) by Region, 2023 & 2029
      Figure 2: Global Flexible Screen Crystal Encapsulation Market Value Share (%), By Segment 1, 2023 & 2029
      Figure 3: Global Flexible Screen Crystal Encapsulation Market Forecast (USD Billion), by Sub-Segment 1, 2018-2029
      Figure 4: Global Flexible Screen Crystal Encapsulation Market Forecast (USD Billion), by Sub-Segment 2, 2018-2029
      Figure 5: Global Flexible Screen Crystal Encapsulation Market Value Share (%), By Segment 2, 2023 & 2029
      Figure 6: Global Flexible Screen Crystal Encapsulation Market Forecast (USD Billion), by Sub-Segment 1, 2018-2029
      Figure 7: Global Flexible Screen Crystal Encapsulation Market Forecast (USD Billion), by Sub-Segment 2, 2018-2029
      Figure 8: Global Flexible Screen Crystal Encapsulation Market Forecast (USD Billion), by Sub-Segment 3, 2018-2029
      Figure 9: Global Flexible Screen Crystal Encapsulation Market Forecast (USD Billion), by Others, 2018-2029
      Figure 10: Global Flexible Screen Crystal Encapsulation Market Value Share (%), By Segment 3, 2023 & 2029
      Figure 11: Global Flexible Screen Crystal Encapsulation Market Forecast (USD Billion), by Sub-Segment 1, 2018-2029
      Figure 12: Global Flexible Screen Crystal Encapsulation Market Forecast (USD Billion), by Sub-Segment 2, 2018-2029
      Figure 13: Global Flexible Screen Crystal Encapsulation Market Forecast (USD Billion), by Sub-Segment 3, 2018-2029
      Figure 14: Global Flexible Screen Crystal Encapsulation Market Forecast (USD Billion), by Others, 2018-2029
      Figure 15: Global Flexible Screen Crystal Encapsulation Market Value (USD Billion), by Region, 2023 & 2029
      Figure 16: North America Flexible Screen Crystal Encapsulation Market Value Share (%), By Segment 1, 2023 & 2029
      Figure 17: North America Flexible Screen Crystal Encapsulation Market Forecast (USD Billion), by Sub-Segment 1, 2018-2029
      Figure 18: North America Flexible Screen Crystal Encapsulation Market Forecast (USD Billion), by Sub-Segment 2, 2018-2029
      Figure 19: North America Flexible Screen Crystal Encapsulation Market Value Share (%), By Segment 2, 2023 & 2029
      Figure 20: North America Flexible Screen Crystal Encapsulation Market Forecast (USD Billion), by Sub-Segment 1, 2018-2029
      Figure 21: North America Flexible Screen Crystal Encapsulation Market Forecast (USD Billion), by Sub-Segment 2, 2018-2029
      Figure 22: North America Flexible Screen Crystal Encapsulation Market Forecast (USD Billion), by Sub-Segment 3, 2018-2029
      Figure 23: North America Flexible Screen Crystal Encapsulation Market Forecast (USD Billion), by Others, 2018-2029
      Figure 24: North America Flexible Screen Crystal Encapsulation Market Value Share (%), By Segment 3, 2023 & 2029
      Figure 25: North America Flexible Screen Crystal Encapsulation Market Forecast (USD Billion), by Sub-Segment 1, 2018-2029
      Figure 26: North America Flexible Screen Crystal Encapsulation Market Forecast (USD Billion), by Sub-Segment 2, 2018-2029
      Figure 27: North America Flexible Screen Crystal Encapsulation Market Forecast (USD Billion), by Sub-Segment 3, 2018-2029
      Figure 28: North America Flexible Screen Crystal Encapsulation Market Forecast (USD Billion), by Others, 2018-2029
      Figure 29: North America Flexible Screen Crystal Encapsulation Market Forecast (USD Billion), by U.S., 2018-2029
      Figure 30: North America Flexible Screen Crystal Encapsulation Market Forecast (USD Billion), by Canada, 2018-2029
      Figure 31: Latin America Flexible Screen Crystal Encapsulation Market Value Share (%), By Segment 1, 2023 & 2029
      Figure 32: Latin America Flexible Screen Crystal Encapsulation Market Forecast (USD Billion), by Sub-Segment 1, 2018-2029
      Figure 33: Latin America Flexible Screen Crystal Encapsulation Market Forecast (USD Billion), by Sub-Segment 2, 2018-2029
      Figure 34: Latin America Flexible Screen Crystal Encapsulation Market Value Share (%), By Segment 2, 2023 & 2029
      Figure 35: Latin America Flexible Screen Crystal Encapsulation Market Forecast (USD Billion), by Sub-Segment 1, 2018-2029
      Figure 36: Latin America Flexible Screen Crystal Encapsulation Market Forecast (USD Billion), by Sub-Segment 2, 2018-2029
      Figure 37: Latin America Flexible Screen Crystal Encapsulation Market Forecast (USD Billion), by Sub-Segment 3, 2018-2029
      Figure 38: Latin America Flexible Screen Crystal Encapsulation Market Forecast (USD Billion), by Others, 2018-2029
      Figure 39: Latin America Flexible Screen Crystal Encapsulation Market Value Share (%), By Segment 3, 2023 & 2029
      Figure 40: Latin America Flexible Screen Crystal Encapsulation Market Forecast (USD Billion), by Sub-Segment 1, 2018-2029
      Figure 41: Latin America Flexible Screen Crystal Encapsulation Market Forecast (USD Billion), by Sub-Segment 2, 2018-2029
      Figure 42: Latin America Flexible Screen Crystal Encapsulation Market Forecast (USD Billion), by Sub-Segment 3, 2018-2029
      Figure 43: Latin America Flexible Screen Crystal Encapsulation Market Forecast (USD Billion), by Others, 2018-2029
      Figure 44: Latin America Flexible Screen Crystal Encapsulation Market Forecast (USD Billion), by Brazil, 2018-2029
      Figure 45: Latin America Flexible Screen Crystal Encapsulation Market Forecast (USD Billion), by Mexico, 2018-2029
      Figure 46: Latin America Flexible Screen Crystal Encapsulation Market Forecast (USD Billion), by Rest of Latin America, 2018-2029
      Figure 47: Europe Flexible Screen Crystal Encapsulation Market Value Share (%), By Segment 1, 2023 & 2029
      Figure 48: Europe Flexible Screen Crystal Encapsulation Market Forecast (USD Billion), by Sub-Segment 1, 2018-2029
      Figure 49: Europe Flexible Screen Crystal Encapsulation Market Forecast (USD Billion), by Sub-Segment 2, 2018-2029
      Figure 50: Europe Flexible Screen Crystal Encapsulation Market Value Share (%), By Segment 2, 2023 & 2029
      Figure 51: Europe Flexible Screen Crystal Encapsulation Market Forecast (USD Billion), by Sub-Segment 1, 2018-2029
      Figure 52: Europe Flexible Screen Crystal Encapsulation Market Forecast (USD Billion), by Sub-Segment 2, 2018-2029
      Figure 53: Europe Flexible Screen Crystal Encapsulation Market Forecast (USD Billion), by Sub-Segment 3, 2018-2029
      Figure 54: Europe Flexible Screen Crystal Encapsulation Market Forecast (USD Billion), by Others, 2018-2029
      Figure 55: Europe Flexible Screen Crystal Encapsulation Market Value Share (%), By Segment 3, 2023 & 2029
      Figure 56: Europe Flexible Screen Crystal Encapsulation Market Forecast (USD Billion), by Sub-Segment 1, 2018-2029
      Figure 57: Europe Flexible Screen Crystal Encapsulation Market Forecast (USD Billion), by Sub-Segment 2, 2018-2029
      Figure 58: Europe Flexible Screen Crystal Encapsulation Market Forecast (USD Billion), by Sub-Segment 3, 2018-2029
      Figure 59: Europe Flexible Screen Crystal Encapsulation Market Forecast (USD Billion), by Others, 2018-2029
      Figure 60: Europe Flexible Screen Crystal Encapsulation Market Forecast (USD Billion), by U.K., 2018-2029
      Figure 61: Europe Flexible Screen Crystal Encapsulation Market Forecast (USD Billion), by Germany, 2018-2029
      Figure 62: Europe Flexible Screen Crystal Encapsulation Market Forecast (USD Billion), by France, 2018-2029
      Figure 63: Europe Flexible Screen Crystal Encapsulation Market Forecast (USD Billion), by Italy, 2018-2029
      Figure 64: Europe Flexible Screen Crystal Encapsulation Market Forecast (USD Billion), by Spain, 2018-2029
      Figure 65: Europe Flexible Screen Crystal Encapsulation Market Forecast (USD Billion), by Russia, 2018-2029
      Figure 66: Europe Flexible Screen Crystal Encapsulation Market Forecast (USD Billion), by Rest of Europe, 2018-2029
      Figure 67: Asia Pacific Flexible Screen Crystal Encapsulation Market Value Share (%), By Segment 1, 2023 & 2029
      Figure 68: Asia Pacific Flexible Screen Crystal Encapsulation Market Forecast (USD Billion), by Sub-Segment 1, 2018-2029
      Figure 69: Asia Pacific Flexible Screen Crystal Encapsulation Market Forecast (USD Billion), by Sub-Segment 2, 2018-2029
      Figure 70: Asia Pacific Flexible Screen Crystal Encapsulation Market Value Share (%), By Segment 2, 2023 & 2029
      Figure 71: Asia Pacific Flexible Screen Crystal Encapsulation Market Forecast (USD Billion), by Sub-Segment 1, 2018-2029
      Figure 72: Asia Pacific Flexible Screen Crystal Encapsulation Market Forecast (USD Billion), by Sub-Segment 2, 2018-2029
      Figure 73: Asia Pacific Flexible Screen Crystal Encapsulation Market Forecast (USD Billion), by Sub-Segment 3, 2018-2029
      Figure 74: Asia Pacific Flexible Screen Crystal Encapsulation Market Forecast (USD Billion), by Others, 2018-2029
      Figure 75: Asia Pacific Flexible Screen Crystal Encapsulation Market Value Share (%), By Segment 3, 2023 & 2029
      Figure 76: Asia Pacific Flexible Screen Crystal Encapsulation Market Forecast (USD Billion), by Sub-Segment 1, 2018-2029
      Figure 77: Asia Pacific Flexible Screen Crystal Encapsulation Market Forecast (USD Billion), by Sub-Segment 2, 2018-2029
      Figure 78: Asia Pacific Flexible Screen Crystal Encapsulation Market Forecast (USD Billion), by Sub-Segment 3, 2018-2029
      Figure 79: Asia Pacific Flexible Screen Crystal Encapsulation Market Forecast (USD Billion), by Others, 2018-2029
      Figure 80: Asia Pacific Flexible Screen Crystal Encapsulation Market Forecast (USD Billion), by China, 2018-2029
      Figure 81: Asia Pacific Flexible Screen Crystal Encapsulation Market Forecast (USD Billion), by India, 2018-2029
      Figure 82: Asia Pacific Flexible Screen Crystal Encapsulation Market Forecast (USD Billion), by Japan, 2018-2029
      Figure 83: Asia Pacific Flexible Screen Crystal Encapsulation Market Forecast (USD Billion), by Australia, 2018-2029
      Figure 84: Asia Pacific Flexible Screen Crystal Encapsulation Market Forecast (USD Billion), by Southeast Asia, 2018-2029
      Figure 85: Asia Pacific Flexible Screen Crystal Encapsulation Market Forecast (USD Billion), by Rest of Asia Pacific, 2018-2029
      Figure 86: Middle East & Africa Flexible Screen Crystal Encapsulation Market Value Share (%), By Segment 1, 2023 & 2029
      Figure 87: Middle East & Africa Flexible Screen Crystal Encapsulation Market Forecast (USD Billion), by Sub-Segment 1, 2018-2029
      Figure 88: Middle East & Africa Flexible Screen Crystal Encapsulation Market Forecast (USD Billion), by Sub-Segment 2, 2018-2029
      Figure 89: Middle East & Africa Flexible Screen Crystal Encapsulation Market Value Share (%), By Segment 2, 2023 & 2029
      Figure 90: Middle East & Africa Flexible Screen Crystal Encapsulation Market Forecast (USD Billion), by Sub-Segment 1, 2018-2029
      Figure 91: Middle East & Africa Flexible Screen Crystal Encapsulation Market Forecast (USD Billion), by Sub-Segment 2, 2018-2029
      Figure 92: Middle East & Africa Flexible Screen Crystal Encapsulation Market Forecast (USD Billion), by Sub-Segment 3, 2018-2029
      Figure 93: Middle East & Africa Flexible Screen Crystal Encapsulation Market Forecast (USD Billion), by Others, 2018-2029
      Figure 94: Middle East & Africa Flexible Screen Crystal Encapsulation Market Value Share (%), By Segment 3, 2023 & 2029
      Figure 95: Middle East & Africa Flexible Screen Crystal Encapsulation Market Forecast (USD Billion), by Sub-Segment 1, 2018-2029
      Figure 96: Middle East & Africa Flexible Screen Crystal Encapsulation Market Forecast (USD Billion), by Sub-Segment 2, 2018-2029
      Figure 97: Middle East & Africa Flexible Screen Crystal Encapsulation Market Forecast (USD Billion), by Sub-Segment 3, 2018-2029
      Figure 98: Middle East & Africa Flexible Screen Crystal Encapsulation Market Forecast (USD Billion), by Others, 2018-2029
      Figure 99: Middle East & Africa Flexible Screen Crystal Encapsulation Market Forecast (USD Billion), by GCC, 2018-2029
      Figure 100: Middle East & Africa Flexible Screen Crystal Encapsulation Market Forecast (USD Billion), by South Africa, 2018-2029
      Figure 101: Middle East & Africa Flexible Screen Crystal Encapsulation Market Forecast (USD Billion), by Rest of Middle East & Africa, 2018-2029 
      List of Tables
      Table 1: Global Flexible Screen Crystal Encapsulation Market Revenue (USD Billion) Forecast, by Segment 1, 2018-2029
      Table 2: Global Flexible Screen Crystal Encapsulation Market Revenue (USD Billion) Forecast, by Segment 2, 2018-2029
      Table 3: Global Flexible Screen Crystal Encapsulation Market Revenue (USD Billion) Forecast, by Segment 3, 2018-2029
      Table 4: Global Flexible Screen Crystal Encapsulation Market Revenue (USD Billion) Forecast, by Region, 2018-2029
      Table 5: North America Flexible Screen Crystal Encapsulation Market Revenue (USD Billion) Forecast, by Segment 1, 2018-2029
      Table 6: North America Flexible Screen Crystal Encapsulation Market Revenue (USD Billion) Forecast, by Segment 2, 2018-2029
      Table 7: North America Flexible Screen Crystal Encapsulation Market Revenue (USD Billion) Forecast, by Segment 3, 2018-2029
      Table 8: North America Flexible Screen Crystal Encapsulation Market Revenue (USD Billion) Forecast, by Country, 2018-2029
      Table 9: Europe Flexible Screen Crystal Encapsulation Market Revenue (USD Billion) Forecast, by Segment 1, 2018-2029
      Table 10: Europe Flexible Screen Crystal Encapsulation Market Revenue (USD Billion) Forecast, by Segment 2, 2018-2029
      Table 11: Europe Flexible Screen Crystal Encapsulation Market Revenue (USD Billion) Forecast, by Segment 3, 2018-2029
      Table 12: Europe Flexible Screen Crystal Encapsulation Market Revenue (USD Billion) Forecast, by Country, 2018-2029
      Table 13: Latin America Flexible Screen Crystal Encapsulation Market Revenue (USD Billion) Forecast, by Segment 1, 2018-2029
      Table 14: Latin America Flexible Screen Crystal Encapsulation Market Revenue (USD Billion) Forecast, by Segment 2, 2018-2029
      Table 15: Latin America Flexible Screen Crystal Encapsulation Market Revenue (USD Billion) Forecast, by Segment 3, 2018-2029
      Table 16: Latin America Flexible Screen Crystal Encapsulation Market Revenue (USD Billion) Forecast, by Country, 2018-2029
      Table 17: Asia Pacific Flexible Screen Crystal Encapsulation Market Revenue (USD Billion) Forecast, by Segment 1, 2018-2029
      Table 18: Asia Pacific Flexible Screen Crystal Encapsulation Market Revenue (USD Billion) Forecast, by Segment 2, 2018-2029
      Table 19: Asia Pacific Flexible Screen Crystal Encapsulation Market Revenue (USD Billion) Forecast, by Segment 3, 2018-2029
      Table 20: Asia Pacific Flexible Screen Crystal Encapsulation Market Revenue (USD Billion) Forecast, by Country, 2018-2029
      Table 21: Middle East & Africa Flexible Screen Crystal Encapsulation Market Revenue (USD Billion) Forecast, by Segment 1, 2018-2029
      Table 22: Middle East & Africa Flexible Screen Crystal Encapsulation Market Revenue (USD Billion) Forecast, by Segment 2, 2018-2029
      Table 23: Middle East & Africa Flexible Screen Crystal Encapsulation Market Revenue (USD Billion) Forecast, by Segment 3, 2018-2029
      Table 24: Middle East & Africa Flexible Screen Crystal Encapsulation Market Revenue (USD Billion) Forecast, by Country, 2018-2029
      Research Process

      Data Library Research are conducted by industry experts who offer insight on industry structure, market segmentations technology assessment and competitive landscape (CL), and penetration, as well as on emerging trends. Their analysis is based on primary interviews (~ 80%) and secondary research (~ 20%) as well as years of professional expertise in their respective industries. Adding to this, by analysing historical trends and current market positions, our analysts predict where the market will be headed for the next five years. Furthermore, the varying trends of segment & categories geographically presented are also studied and the estimated based on the primary & secondary research.

      In this particular report from the supply side Data Library Research has conducted primary surveys (interviews) with the key level executives (VP, CEO’s, Marketing Director, Business Development Manager and SOFT) of the companies that active & prominent as well as the midsized organization

      FIGURE 1: DLR RESEARH PROCESS

      research-methodology1

      Primary Research

      Extensive primary research was conducted to gain a deeper insight of the market and industry performance. The analysis is based on both primary and secondary research as well as years of professional expertise in the respective industries.

      In addition to analysing current and historical trends, our analysts predict where the market is headed over the next five years.

      It varies by segment for these categories geographically presented in the list of market tables. Speaking about this particular report we have conducted primary surveys (interviews) with the key level executives (VP, CEO’s, Marketing Director, Business Development Manager and many more) of the major players active in the market.

      Secondary Research

      Secondary research was mainly used to collect and identify information useful for the extensive, technical, market-oriented, and Friend’s study of the Global Extra Neutral Alcohol. It was also used to obtain key information about major players, market classification and segmentation according to the industry trends, geographical markets, and developments related to the market and technology perspectives. For this study, analysts have gathered information from various credible sources, such as annual reports, sec filings, journals, white papers, SOFT presentations, and company web sites.

      Market Size Estimation

      Both, top-down and bottom-up approaches were used to estimate and validate the size of the Global market and to estimate the size of various other dependent submarkets in the overall Extra Neutral Alcohol. The key players in the market were identified through secondary research and their market contributions in the respective geographies were determined through primary and secondary research.

      Forecast Model

      research-methodology2

      Happy to Assist You

      If you have a question?

      info@datalibraryresearch.com

      IND : +91 955 279 0357

      Browse Related Reports