Food Nutrition Scanning Technology Market Overview and Analysis
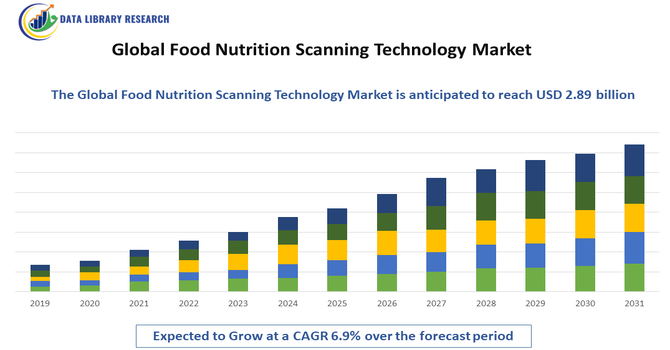
The Global market for Food Scanning Technology was estimated to be worth USD 1.8 billion in 2025 and is forecast to a readjusted size of USD 2.89 billion by 2032, growing with a CAGR of 6.9% from 2025 to 2032.
Get Complete Analysis Of The Report - Download Updated Free Sample PDF
The Global Food Nutrition Scanning Technology Market refers to the industry focused on developing and providing technologies that analyze and monitor the nutritional content of food products. These solutions use advanced methods like spectroscopy, AI, and sensors to measure vitamins, minerals, proteins, fats, and contaminants in real-time. Driven by growing health awareness, regulatory requirements, and demand for transparent labeling, the market serves food manufacturers, retailers, and consumers. It emphasizes accuracy, efficiency, and innovation in nutritional assessment globally.
Food Nutrition Scanning Technology Market Latest Trends
The Global Food Nutrition Scanning Technology Market is driven by increasing consumer demand for transparency in food labeling and healthier choices. Adoption of non-destructive scanning technologies such as NIR, hyperspectral imaging, and AI-powered analysis is rising, enabling rapid, accurate nutrient profiling. Integration with IoT and cloud platforms allows real-time monitoring and traceability across supply chains. Regulatory emphasis on nutrition disclosure and food safety standards fuels market growth. Additionally, portable handheld scanners for both industry and consumer use are gaining popularity.
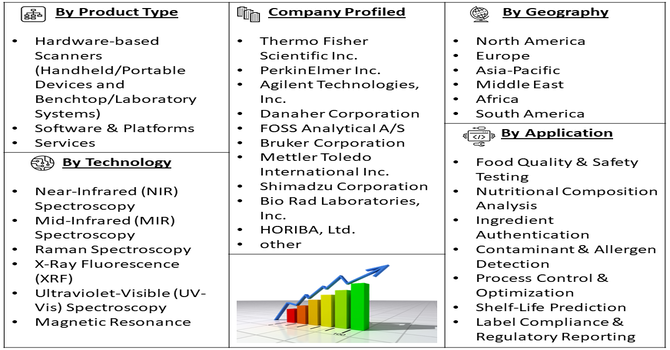
Segmentation: The Global Food Nutrition Scanning Technology Market is segmented by Technology Type (Near-Infrared (NIR) Spectroscopy, Mid-Infrared (MIR) Spectroscopy, Raman Spectroscopy, X-Ray Fluorescence (XRF), Ultraviolet-Visible (UV-Vis) Spectroscopy, Magnetic Resonance, Hyperspectral & Multispectral Imaging, Terahertz Scanning and Other Emerging Technologies), Product Type (Hardware-based Scanners (Handheld/Portable Devices and Benchtop/Laboratory Systems), Software & Platforms, and Services), Application (Food Quality & Safety Testing, Nutritional Composition Analysis, Ingredient Authentication, Contaminant & Allergen Detection, Process Control & Optimization, Shelf-Life Prediction, and Label Compliance & Regulatory Reporting), End User (Food & Beverage Manufacturers, Food Testing Laboratories, Retail & Grocery Chains, Restaurants & Food Service, Packaging Companies and Others), and Geography (North America, Europe, Asia-Pacific, Middle East and Africa, and South America). The report provides the value (in USD million) for the above segments.
For Detailed Market Segmentation - Get a Free Sample PDF
Market Drivers:
- Rising Consumer Demand for Transparency and Nutritional Awareness
Growing health consciousness among consumers is a major driver for the Global Food Nutrition Scanning Technology Market. Consumers are increasingly demanding transparency regarding nutritional content, ingredient sourcing, allergens, and food quality. The rise in lifestyle-related diseases such as obesity, diabetes, and cardiovascular disorders has accelerated the need for accurate, real-time nutritional information. Food nutrition scanning technologies enable rapid analysis of macronutrients, micronutrients, and harmful contaminants, supporting informed purchasing decisions. This demand is further amplified by clean-label trends, personalized nutrition, and digital health integration, pushing food manufacturers, retailers, and food service providers to adopt advanced nutrition scanning solutions.
- Stringent Food Safety Regulations and Quality Compliance Requirements
Strict global food safety regulations are significantly driving the adoption of food nutrition scanning technologies. Regulatory bodies such as the FDA, EFSA, and FSSAI mandate accurate nutritional labeling, allergen disclosure, and quality assurance across the food supply chain. Non-compliance can lead to product recalls, financial penalties, and reputational damage. Nutrition scanning technologies offer fast, non-destructive, and reliable testing methods that help food manufacturers and testing laboratories meet regulatory standards efficiently. Additionally, increasing cross-border food trade has intensified the need for standardized testing and verification, further supporting market growth and technological innovation in nutrition scanning solutions.
Market Restraints:
- High Cost of Advanced Scanning Technologies and Limited Accessibility
Despite strong growth potential, the market faces challenges due to the high cost of advanced food nutrition scanning technologies. Sophisticated hardware such as hyperspectral imaging systems and spectroscopy-based scanners requires significant capital investment, along with ongoing calibration, maintenance, and skilled personnel. This limits adoption among small and medium-sized food producers, especially in developing regions. Additionally, integration with existing systems and data interpretation complexities can increase operational costs. Limited awareness and lack of technical expertise further restrain market penetration, particularly in price-sensitive markets, slowing widespread adoption despite growing demand for nutritional transparency.
Socioeconomic Impact on Food Nutrition Scanning Technology Market
The proliferation of food nutrition scanning technology has significant positive socioeconomic effects. By improving nutritional transparency, it empowers consumers to make healthier dietary choices, potentially reducing lifestyle-related diseases and lowering public healthcare costs. In developing regions, affordable scanning solutions can support food quality monitoring, enhancing food security and trust. These technologies also create job opportunities in tech development, data analysis, and food quality assurance sectors. Small and medium food enterprises benefit from better compliance with nutrition standards, improving market access. However, disparities in technology adoption could widen gaps between large and smaller producers unless supported by inclusive policies and training programs.
Segmental Analysis:
- Ultraviolet-Visible (UV-Vis) Spectroscopy segment is expected to witness the highest growth over the forecast period
The Ultraviolet-Visible (UV-Vis) Spectroscopy segment is expected to witness the highest growth over the forecast period due to its cost-effectiveness, simplicity, and wide applicability in food nutrition analysis. UV-Vis spectroscopy is extensively used for rapid detection of vitamins, proteins, antioxidants, and food additives, making it highly suitable for routine quality and nutritional assessments. Its non-destructive nature, fast processing time, and compatibility with automated and portable systems further enhance adoption. Additionally, increasing regulatory emphasis on accurate nutrient quantification and rising demand from small and mid-sized food manufacturers are driving the uptake of UV-Vis-based scanning solutions globally.
- Handheld/Portable Devices segment is expected to witness the highest growth over the forecast period
The Handheld/Portable Devices segment is expected to witness the highest growth over the forecast period, driven by the increasing demand for on-site, real-time food nutrition analysis. Portable scanners enable rapid testing across farms, manufacturing facilities, retail stores, and food service environments, reducing dependency on centralized laboratories. Technological advancements in miniaturization, battery efficiency, and wireless connectivity have significantly improved device accuracy and usability. Furthermore, growing adoption among quality inspectors, supply chain operators, and health-conscious consumers supports market expansion. The rising need for mobility, convenience, and immediate decision-making continues to accelerate growth in this segment.
- Ingredient Authentication segment is expected to witness the highest growth over the forecast period
The Ingredient Authentication segment is expected to witness the highest growth over the forecast period due to increasing concerns over food fraud, adulteration, and mislabeling. Food manufacturers and regulatory authorities are prioritizing verification of ingredient origin, purity, and composition to ensure consumer safety and brand integrity. Nutrition scanning technologies enable rapid identification of counterfeit ingredients, substitution, and dilution across complex supply chains. The rising demand for premium, organic, and specialty food products further drives authentication requirements. Additionally, globalization of food trade and stringent compliance standards are encouraging companies to adopt advanced scanning solutions for reliable ingredient verification.
- Shelf-Life Prediction segment is expected to witness the highest growth over the forecast period
The Shelf-Life Prediction segment is expected to witness the highest growth over the forecast period as food producers increasingly focus on reducing food waste and improving supply chain efficiency. Advanced nutrition scanning technologies, combined with predictive analytics and AI, enable real-time monitoring of chemical and nutritional changes that impact product freshness. Accurate shelf-life estimation supports better inventory management, optimized distribution, and enhanced consumer safety. Growing regulatory scrutiny, sustainability initiatives, and cost pressures on food manufacturers are further accelerating adoption. As retailers and producers seek data-driven tools to extend product usability and minimize spoilage, demand for shelf-life prediction solutions continues to rise.
- North America Region is expected to witness the highest growth over the forecast period
North America is expected to witness the highest growth over the forecast period, driven by advanced food safety infrastructure, high consumer awareness, and early adoption of innovative technologies. The region benefits from stringent regulatory frameworks enforced by agencies such as the FDA and USDA, promoting the use of nutrition scanning solutions for compliance and quality assurance. Strong presence of key market players, increased R&D investments, and integration of AI-driven food analytics further support growth. Additionally, rising demand for clean-label, functional, and personalized nutrition products across the United States and Canada continues to fuel market expansion.
| Report Matrics |
Details |
| Market Size Value |
USD 2.89 billion |
| Growth Rate |
CAGR of 6.9 % |
| Forecast |
2026-2033 |
| Historical data |
2021-2024 |
| Base Year |
2025 |
| Report Coverage |
Forecasted revenue, company rating, competitive environment, growth drivers, and trends |
| Segment Coverage |
Type, Application, End-User, Geography |
| Regional Scope |
North America, Europe, Asia Pacific, Middle East |
| Customized scope |
Free customization of reports (With 3 months' analysis support) |
| To Learn More About This Report |
Request a Free Sample Copy |
Food Nutrition Scanning Technology Market Competitive Landscape
The competitive landscape of the Global Food Nutrition Scanning Technology Market features a mix of established instrument manufacturers and innovative tech startups. Key players focus on R&D to enhance accuracy, portability, and AI integration. Strategic collaborations with food companies and research institutions bolster product offerings and market reach. Differentiation often hinges on proprietary algorithms, sensor precision, and ease of use. Mergers and acquisitions are common as larger firms absorb niche innovators to expand capabilities. Regional players in North America, Europe, and Asia Pacific compete on price, customization, and local regulatory compliance. Continuous innovation and customer-centric solutions define competitive advantage in this dynamic market.
The major players for above market are:
- Thermo Fisher Scientific Inc.
- PerkinElmer Inc.
- Agilent Technologies, Inc.
- Danaher Corporation
- FOSS Analytical A/S
- Bruker Corporation
- Mettler Toledo International Inc.
- Shimadzu Corporation
- Bio Rad Laboratories, Inc.
- HORIBA, Ltd.
- Eagle Product Inspection
- Neogen Corporation
- Eurofins Scientific
- Nestlé S.A.
- 3M Company
- Tellspec Inc.
- Spectral Engines Oy
- Yuka (barcode & nutrient scanning app)
- DietSensor (nutritional scanner solutions)
- Nima Labs, Inc.
Recent Development
- In June 2025, NielsenIQ’s collaboration with FoodHealth Co. to integrate the FoodHealth Score into its global data ecosystem significantly strengthens the Global Food Nutrition Scanning Technology Market. By enabling standardized, data-driven nutrient scoring at scale, this partnership enhances nutrition transparency, supports advanced food analysis, and accelerates adoption of digital nutrition scanning solutions across manufacturers, retailers, and regulatory stakeholders worldwide.
- In December 2024, FSSAI’s rigorous surveillance, inspection, and enforcement activities under the Food Safety and Standards Act, 2006, are driving demand for advanced food nutrition scanning technologies globally. Regular sampling and strict penal actions for non-compliance encourage food business operators to adopt rapid, accurate nutrition and quality scanning solutions to ensure regulatory compliance, enhance food safety, and minimize operational and legal risks.
Frequently Asked Questions (FAQ) :
Q1. What are the main growth-driving factors for this market?
The market is growing because of a massive surge in health consciousness and the rising prevalence of food allergies and chronic diseases like diabetes. Consumers want instant, transparent data about the ingredients, calories, and chemical residues in their meals. Additionally, the miniaturization of "near-infrared" sensors is making these tools more accessible.
Q2. What are the main restraining factors for this market?
Growth is limited by the high price of precision sensors and the technical difficulty of accurately scanning "mixed" foods, like a complex stew or a multi-layered sandwich. There are also concerns about data accuracy and the risk of consumers making medical decisions based on faulty scans without consulting a doctor.
Q3. Which segment is expected to witness high growth?
The Handheld and Portable Scanners segment is expected to see the highest growth. These pocket-sized devices connect to smartphone apps, allowing users to scan grocery items or restaurant meals on the go. As the technology becomes cheaper and easier to use, it is becoming a popular gadget for fitness enthusiasts.
Q4. Who are the top major players for this market?
The market is led by innovative tech startups and scientific instrument manufacturers. Key players include SCD (Sustaining Competitive Development), Consumer Physics (SCiO), TellSpec, DietSensor, and Thermo Fisher Scientific. These companies dominate by developing advanced molecular sensors and huge databases that identify nutritional content in real-time.
Q5. Which country is the largest player?
The United States is the largest player in this market. This is driven by a strong culture of self-tracking and fitness technology, as well as high consumer spending on health-related gadgets. The presence of leading Silicon Valley tech firms and a high demand for food transparency further solidify its top position.
List of Figures
Figure 1: Global Food Nutrition Scanning Technology Market Revenue Breakdown (USD Billion, %) by Region, 2022 & 2029
Figure 2: Global Food Nutrition Scanning Technology Market Value Share (%), By Segment 1, 2022 & 2029
Figure 3: Global Food Nutrition Scanning Technology Market Forecast (USD Billion), by Sub-Segment 1, 2018-2029
Figure 4: Global Food Nutrition Scanning Technology Market Forecast (USD Billion), by Sub-Segment 2, 2018-2029
Figure 5: Global Food Nutrition Scanning Technology Market Value Share (%), By Segment 2, 2022 & 2029
Figure 6: Global Food Nutrition Scanning Technology Market Forecast (USD Billion), by Sub-Segment 1, 2018-2029
Figure 7: Global Food Nutrition Scanning Technology Market Forecast (USD Billion), by Sub-Segment 2, 2018-2029
Figure 8: Global Food Nutrition Scanning Technology Market Forecast (USD Billion), by Sub-Segment 3, 2018-2029
Figure 9: Global Food Nutrition Scanning Technology Market Forecast (USD Billion), by Others, 2018-2029
Figure 10: Global Food Nutrition Scanning Technology Market Value Share (%), By Segment 3, 2022 & 2029
Figure 11: Global Food Nutrition Scanning Technology Market Forecast (USD Billion), by Sub-Segment 1, 2018-2029
Figure 12: Global Food Nutrition Scanning Technology Market Forecast (USD Billion), by Sub-Segment 2, 2018-2029
Figure 13: Global Food Nutrition Scanning Technology Market Forecast (USD Billion), by Sub-Segment 3, 2018-2029
Figure 14: Global Food Nutrition Scanning Technology Market Forecast (USD Billion), by Others, 2018-2029
Figure 15: Global Food Nutrition Scanning Technology Market Value (USD Billion), by Region, 2022 & 2029
Figure 16: North America Food Nutrition Scanning Technology Market Value Share (%), By Segment 1, 2022 & 2029
Figure 17: North America Food Nutrition Scanning Technology Market Forecast (USD Billion), by Sub-Segment 1, 2018-2029
Figure 18: North America Food Nutrition Scanning Technology Market Forecast (USD Billion), by Sub-Segment 2, 2018-2029
Figure 19: North America Food Nutrition Scanning Technology Market Value Share (%), By Segment 2, 2022 & 2029
Figure 20: North America Food Nutrition Scanning Technology Market Forecast (USD Billion), by Sub-Segment 1, 2018-2029
Figure 21: North America Food Nutrition Scanning Technology Market Forecast (USD Billion), by Sub-Segment 2, 2018-2029
Figure 22: North America Food Nutrition Scanning Technology Market Forecast (USD Billion), by Sub-Segment 3, 2018-2029
Figure 23: North America Food Nutrition Scanning Technology Market Forecast (USD Billion), by Others, 2018-2029
Figure 24: North America Food Nutrition Scanning Technology Market Value Share (%), By Segment 3, 2022 & 2029
Figure 25: North America Food Nutrition Scanning Technology Market Forecast (USD Billion), by Sub-Segment 1, 2018-2029
Figure 26: North America Food Nutrition Scanning Technology Market Forecast (USD Billion), by Sub-Segment 2, 2018-2029
Figure 27: North America Food Nutrition Scanning Technology Market Forecast (USD Billion), by Sub-Segment 3, 2018-2029
Figure 28: North America Food Nutrition Scanning Technology Market Forecast (USD Billion), by Others, 2018-2029
Figure 29: North America Food Nutrition Scanning Technology Market Forecast (USD Billion), by U.S., 2018-2029
Figure 30: North America Food Nutrition Scanning Technology Market Forecast (USD Billion), by Canada, 2018-2029
Figure 31: Latin America Food Nutrition Scanning Technology Market Value Share (%), By Segment 1, 2022 & 2029
Figure 32: Latin America Food Nutrition Scanning Technology Market Forecast (USD Billion), by Sub-Segment 1, 2018-2029
Figure 33: Latin America Food Nutrition Scanning Technology Market Forecast (USD Billion), by Sub-Segment 2, 2018-2029
Figure 34: Latin America Food Nutrition Scanning Technology Market Value Share (%), By Segment 2, 2022 & 2029
Figure 35: Latin America Food Nutrition Scanning Technology Market Forecast (USD Billion), by Sub-Segment 1, 2018-2029
Figure 36: Latin America Food Nutrition Scanning Technology Market Forecast (USD Billion), by Sub-Segment 2, 2018-2029
Figure 37: Latin America Food Nutrition Scanning Technology Market Forecast (USD Billion), by Sub-Segment 3, 2018-2029
Figure 38: Latin America Food Nutrition Scanning Technology Market Forecast (USD Billion), by Others, 2018-2029
Figure 39: Latin America Food Nutrition Scanning Technology Market Value Share (%), By Segment 3, 2022 & 2029
Figure 40: Latin America Food Nutrition Scanning Technology Market Forecast (USD Billion), by Sub-Segment 1, 2018-2029
Figure 41: Latin America Food Nutrition Scanning Technology Market Forecast (USD Billion), by Sub-Segment 2, 2018-2029
Figure 42: Latin America Food Nutrition Scanning Technology Market Forecast (USD Billion), by Sub-Segment 3, 2018-2029
Figure 43: Latin America Food Nutrition Scanning Technology Market Forecast (USD Billion), by Others, 2018-2029
Figure 44: Latin America Food Nutrition Scanning Technology Market Forecast (USD Billion), by Brazil, 2018-2029
Figure 45: Latin America Food Nutrition Scanning Technology Market Forecast (USD Billion), by Mexico, 2018-2029
Figure 46: Latin America Food Nutrition Scanning Technology Market Forecast (USD Billion), by Rest of Latin America, 2018-2029
Figure 47: Europe Food Nutrition Scanning Technology Market Value Share (%), By Segment 1, 2022 & 2029
Figure 48: Europe Food Nutrition Scanning Technology Market Forecast (USD Billion), by Sub-Segment 1, 2018-2029
Figure 49: Europe Food Nutrition Scanning Technology Market Forecast (USD Billion), by Sub-Segment 2, 2018-2029
Figure 50: Europe Food Nutrition Scanning Technology Market Value Share (%), By Segment 2, 2022 & 2029
Figure 51: Europe Food Nutrition Scanning Technology Market Forecast (USD Billion), by Sub-Segment 1, 2018-2029
Figure 52: Europe Food Nutrition Scanning Technology Market Forecast (USD Billion), by Sub-Segment 2, 2018-2029
Figure 53: Europe Food Nutrition Scanning Technology Market Forecast (USD Billion), by Sub-Segment 3, 2018-2029
Figure 54: Europe Food Nutrition Scanning Technology Market Forecast (USD Billion), by Others, 2018-2029
Figure 55: Europe Food Nutrition Scanning Technology Market Value Share (%), By Segment 3, 2022 & 2029
Figure 56: Europe Food Nutrition Scanning Technology Market Forecast (USD Billion), by Sub-Segment 1, 2018-2029
Figure 57: Europe Food Nutrition Scanning Technology Market Forecast (USD Billion), by Sub-Segment 2, 2018-2029
Figure 58: Europe Food Nutrition Scanning Technology Market Forecast (USD Billion), by Sub-Segment 3, 2018-2029
Figure 59: Europe Food Nutrition Scanning Technology Market Forecast (USD Billion), by Others, 2018-2029
Figure 60: Europe Food Nutrition Scanning Technology Market Forecast (USD Billion), by U.K., 2018-2029
Figure 61: Europe Food Nutrition Scanning Technology Market Forecast (USD Billion), by Germany, 2018-2029
Figure 62: Europe Food Nutrition Scanning Technology Market Forecast (USD Billion), by France, 2018-2029
Figure 63: Europe Food Nutrition Scanning Technology Market Forecast (USD Billion), by Italy, 2018-2029
Figure 64: Europe Food Nutrition Scanning Technology Market Forecast (USD Billion), by Spain, 2018-2029
Figure 65: Europe Food Nutrition Scanning Technology Market Forecast (USD Billion), by Russia, 2018-2029
Figure 66: Europe Food Nutrition Scanning Technology Market Forecast (USD Billion), by Rest of Europe, 2018-2029
Figure 67: Asia Pacific Food Nutrition Scanning Technology Market Value Share (%), By Segment 1, 2022 & 2029
Figure 68: Asia Pacific Food Nutrition Scanning Technology Market Forecast (USD Billion), by Sub-Segment 1, 2018-2029
Figure 69: Asia Pacific Food Nutrition Scanning Technology Market Forecast (USD Billion), by Sub-Segment 2, 2018-2029
Figure 70: Asia Pacific Food Nutrition Scanning Technology Market Value Share (%), By Segment 2, 2022 & 2029
Figure 71: Asia Pacific Food Nutrition Scanning Technology Market Forecast (USD Billion), by Sub-Segment 1, 2018-2029
Figure 72: Asia Pacific Food Nutrition Scanning Technology Market Forecast (USD Billion), by Sub-Segment 2, 2018-2029
Figure 73: Asia Pacific Food Nutrition Scanning Technology Market Forecast (USD Billion), by Sub-Segment 3, 2018-2029
Figure 74: Asia Pacific Food Nutrition Scanning Technology Market Forecast (USD Billion), by Others, 2018-2029
Figure 75: Asia Pacific Food Nutrition Scanning Technology Market Value Share (%), By Segment 3, 2022 & 2029
Figure 76: Asia Pacific Food Nutrition Scanning Technology Market Forecast (USD Billion), by Sub-Segment 1, 2018-2029
Figure 77: Asia Pacific Food Nutrition Scanning Technology Market Forecast (USD Billion), by Sub-Segment 2, 2018-2029
Figure 78: Asia Pacific Food Nutrition Scanning Technology Market Forecast (USD Billion), by Sub-Segment 3, 2018-2029
Figure 79: Asia Pacific Food Nutrition Scanning Technology Market Forecast (USD Billion), by Others, 2018-2029
Figure 80: Asia Pacific Food Nutrition Scanning Technology Market Forecast (USD Billion), by China, 2018-2029
Figure 81: Asia Pacific Food Nutrition Scanning Technology Market Forecast (USD Billion), by India, 2018-2029
Figure 82: Asia Pacific Food Nutrition Scanning Technology Market Forecast (USD Billion), by Japan, 2018-2029
Figure 83: Asia Pacific Food Nutrition Scanning Technology Market Forecast (USD Billion), by Australia, 2018-2029
Figure 84: Asia Pacific Food Nutrition Scanning Technology Market Forecast (USD Billion), by Southeast Asia, 2018-2029
Figure 85: Asia Pacific Food Nutrition Scanning Technology Market Forecast (USD Billion), by Rest of Asia Pacific, 2018-2029
Figure 86: Middle East & Africa Food Nutrition Scanning Technology Market Value Share (%), By Segment 1, 2022 & 2029
Figure 87: Middle East & Africa Food Nutrition Scanning Technology Market Forecast (USD Billion), by Sub-Segment 1, 2018-2029
Figure 88: Middle East & Africa Food Nutrition Scanning Technology Market Forecast (USD Billion), by Sub-Segment 2, 2018-2029
Figure 89: Middle East & Africa Food Nutrition Scanning Technology Market Value Share (%), By Segment 2, 2022 & 2029
Figure 90: Middle East & Africa Food Nutrition Scanning Technology Market Forecast (USD Billion), by Sub-Segment 1, 2018-2029
Figure 91: Middle East & Africa Food Nutrition Scanning Technology Market Forecast (USD Billion), by Sub-Segment 2, 2018-2029
Figure 92: Middle East & Africa Food Nutrition Scanning Technology Market Forecast (USD Billion), by Sub-Segment 3, 2018-2029
Figure 93: Middle East & Africa Food Nutrition Scanning Technology Market Forecast (USD Billion), by Others, 2018-2029
Figure 94: Middle East & Africa Food Nutrition Scanning Technology Market Value Share (%), By Segment 3, 2022 & 2029
Figure 95: Middle East & Africa Food Nutrition Scanning Technology Market Forecast (USD Billion), by Sub-Segment 1, 2018-2029
Figure 96: Middle East & Africa Food Nutrition Scanning Technology Market Forecast (USD Billion), by Sub-Segment 2, 2018-2029
Figure 97: Middle East & Africa Food Nutrition Scanning Technology Market Forecast (USD Billion), by Sub-Segment 3, 2018-2029
Figure 98: Middle East & Africa Food Nutrition Scanning Technology Market Forecast (USD Billion), by Others, 2018-2029
Figure 99: Middle East & Africa Food Nutrition Scanning Technology Market Forecast (USD Billion), by GCC, 2018-2029
Figure 100: Middle East & Africa Food Nutrition Scanning Technology Market Forecast (USD Billion), by South Africa, 2018-2029
Figure 101: Middle East & Africa Food Nutrition Scanning Technology Market Forecast (USD Billion), by Rest of Middle East & Africa, 2018-2029
List of Tables
Table 1: Global Food Nutrition Scanning Technology Market Revenue (USD Billion) Forecast, by Segment 1, 2018-2029
Table 2: Global Food Nutrition Scanning Technology Market Revenue (USD Billion) Forecast, by Segment 2, 2018-2029
Table 3: Global Food Nutrition Scanning Technology Market Revenue (USD Billion) Forecast, by Segment 3, 2018-2029
Table 4: Global Food Nutrition Scanning Technology Market Revenue (USD Billion) Forecast, by Region, 2018-2029
Table 5: North America Food Nutrition Scanning Technology Market Revenue (USD Billion) Forecast, by Segment 1, 2018-2029
Table 6: North America Food Nutrition Scanning Technology Market Revenue (USD Billion) Forecast, by Segment 2, 2018-2029
Table 7: North America Food Nutrition Scanning Technology Market Revenue (USD Billion) Forecast, by Segment 3, 2018-2029
Table 8: North America Food Nutrition Scanning Technology Market Revenue (USD Billion) Forecast, by Country, 2018-2029
Table 9: Europe Food Nutrition Scanning Technology Market Revenue (USD Billion) Forecast, by Segment 1, 2018-2029
Table 10: Europe Food Nutrition Scanning Technology Market Revenue (USD Billion) Forecast, by Segment 2, 2018-2029
Table 11: Europe Food Nutrition Scanning Technology Market Revenue (USD Billion) Forecast, by Segment 3, 2018-2029
Table 12: Europe Food Nutrition Scanning Technology Market Revenue (USD Billion) Forecast, by Country, 2018-2029
Table 13: Latin America Food Nutrition Scanning Technology Market Revenue (USD Billion) Forecast, by Segment 1, 2018-2029
Table 14: Latin America Food Nutrition Scanning Technology Market Revenue (USD Billion) Forecast, by Segment 2, 2018-2029
Table 15: Latin America Food Nutrition Scanning Technology Market Revenue (USD Billion) Forecast, by Segment 3, 2018-2029
Table 16: Latin America Food Nutrition Scanning Technology Market Revenue (USD Billion) Forecast, by Country, 2018-2029
Table 17: Asia Pacific Food Nutrition Scanning Technology Market Revenue (USD Billion) Forecast, by Segment 1, 2018-2029
Table 18: Asia Pacific Food Nutrition Scanning Technology Market Revenue (USD Billion) Forecast, by Segment 2, 2018-2029
Table 19: Asia Pacific Food Nutrition Scanning Technology Market Revenue (USD Billion) Forecast, by Segment 3, 2018-2029
Table 20: Asia Pacific Food Nutrition Scanning Technology Market Revenue (USD Billion) Forecast, by Country, 2018-2029
Table 21: Middle East & Africa Food Nutrition Scanning Technology Market Revenue (USD Billion) Forecast, by Segment 1, 2018-2029
Table 22: Middle East & Africa Food Nutrition Scanning Technology Market Revenue (USD Billion) Forecast, by Segment 2, 2018-2029
Table 23: Middle East & Africa Food Nutrition Scanning Technology Market Revenue (USD Billion) Forecast, by Segment 3, 2018-2029
Table 24: Middle East & Africa Food Nutrition Scanning Technology Market Revenue (USD Billion) Forecast, by Country, 2018-2029
Research Process
Data Library Research are conducted by industry experts who offer insight on
industry structure, market segmentations technology assessment and competitive landscape (CL), and penetration, as well as on emerging trends. Their analysis is based on primary interviews (~ 80%) and secondary research (~ 20%) as well as years of professional expertise in their respective industries. Adding to this, by analysing historical trends and current market positions, our analysts predict where the market will be headed for the next five years. Furthermore, the varying trends of segment & categories geographically presented are also studied and the estimated based on the primary & secondary research.
In this particular report from the supply side Data Library Research has conducted primary surveys (interviews) with the key level executives (VP, CEO’s, Marketing Director, Business Development Manager
and SOFT) of the companies that active & prominent as well as the midsized organization
FIGURE 1: DLR RESEARH PROCESS
![research-methodology1]()
Primary Research
Extensive primary research was conducted to gain a deeper insight of the market and industry performance. The analysis is based on both primary and secondary research as well as years of professional expertise in the respective industries.
In addition to analysing current and historical trends, our analysts predict where the market is headed over the next five years.
It varies by segment for these categories geographically presented in the list of market tables. Speaking about this particular report we have conducted primary surveys (interviews) with the key level executives (VP, CEO’s, Marketing Director, Business Development Manager and many more) of the major players active in the market.
Secondary Research
Secondary research was mainly used to collect and identify information useful for the extensive, technical, market-oriented, and Friend’s study of the Global Extra Neutral Alcohol. It was also used to obtain key information about major players, market classification and segmentation according to the industry trends, geographical markets, and developments related to the market and technology perspectives. For this study, analysts have gathered information from various credible sources, such as annual reports, sec filings, journals, white papers, SOFT presentations, and company web sites.
Market Size Estimation
Both, top-down and bottom-up approaches were used to estimate and validate the size of the Global market and to estimate the size of various other dependent submarkets in the overall Extra Neutral Alcohol. The key players in the market were identified through secondary research and their market contributions in the respective geographies were determined through primary and secondary research.
Forecast Model
![research-methodology2]()