Functional Chewing Gums Market Overview
The global Functional Chewing Gums market is expected to rise at a significant rate in the forthcoming years. A significant driver driving the market is projected to be the increased popularity of functional chewing gums for treating health concerns. Consumers have responded well to products such as tooth whitening gums, energy gums, weight-loss gums, sleep gums, and focus gums, opening up new opportunities for the manufacturer.
Organizations are constantly coming up with new ideas for how to make functional chewing gums. These functional chewing gum makers have been attempting to address mental well-being and stress alleviation as important issues. Various other aspects of health have also caught the eye of manufacturers and encouraged product innovation. To attract a large number of young people, the product has focused on its marketing, packaging, cheeky innuendos, and active presence on social media. All these aspects are majorly contributing to the growth of the global Functional Chewing Gums Market.
| Report Metric |
Details |
| Market size available for years |
2023–2030 |
| Base year considered |
2023 |
| Forecast period |
2024–2030 |
| Forecast unit |
Value (USD Million) |
| Segments covered |
Product, Distribution Channel, and Region. |
| Regions covered |
North America (the U.S. and Canada), Europe (UK, Germany, France, Italy, Spain, Russia, Rest of Europe), Asia-Pacific (China, India, Japan, Australia, South East Asia, Rest of Asia Pacific), Latin America and the Middle East and Africa (Brazil, Saudi Arabia, UAE, Rest of LAMEA) |
| Companies covered |
ABOAFSITE SA CV, CAFOSA, GSK group, Gumlink Confectionery Company A/S, LOTTE CONFECTIONERY CO. LTD., Med CBDX, Miradent, Mondelēz International, Peppersmith, Think Products LLC, Rev Gum. |
Covid-19 Impact on Functional Chewing Gums Market
A pandemic such as COVID-19 has not only affected the smooth operations of food supply chains but also resulted in food insecurity conditions in several nations. Manufacturers working in the sector are facing challenges in regards to operations, supply chain, training, safety, emergency responses, awareness, incident management, recreating business models, digitalization, and other unanticipated impacts. Alcohol, a major component in the beverage industry is facing a devastating effect of a pandemic. Around 13% to 15% of the craft beer sector in the world is in the process of shutting up shop, and the wine industry is in severe distress. Besides, shortage of raw materials caused to shut down of many small to medium food processing companies around the world.
Functional Chewing Gums Market Segment Overview
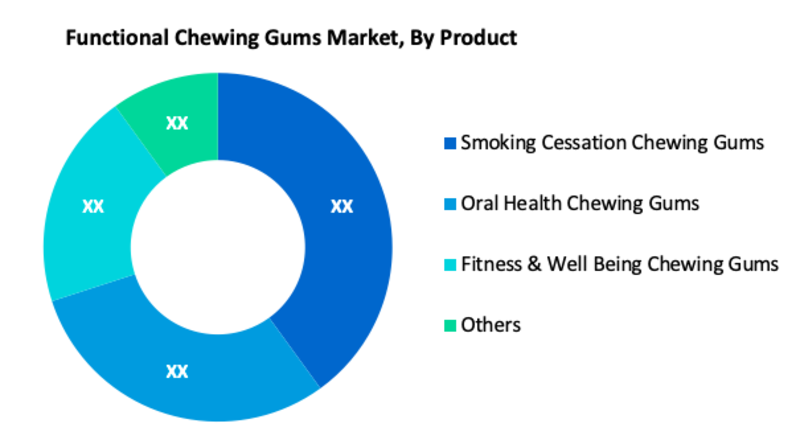
According to Product, Smoking Cessation Chewing Gums is one of the largest segments in the global Functional Chewing Gums market. The increased number of smokers who are trying to quit smoking is anticipated to enlarge the scope of such products in the forthcoming years. Moreover, Oral Health Chewing Gums is another important segment in the market. These sugar-free chewing gums are recommended to be used after a meal since they aid in rinsing and neutralizing the acids generated by plaque bacteria. These products protect the tooth enamel against deterioration in the long run.
Functional Chewing Gums Market, By Product
· Smoking Cessation Chewing Gums
· Oral Health Chewing Gums
· Fitness & Well Being Chewing Gums
· Others
Functional Chewing Gums Market, By Distribution Channel
· Hypermarkets & Supermarkets
· Convenience Stores
· Online
· Others
Functional Chewing Gums Market Regional Overview
The global Functional Chewing Gums market is divided into North America, Europe, Asia Pacific, Latin America, and the Middle East & Africa. North America dominated the global market for Functional Chewing Gums in terms of revenue. Manufacturers of functional chewing gums have made many strategic moves in the region to capitalize on the market's expansion. In the forecast period, Asia Pacific is predicted to be the fastest-growing regional market, with a higher CAGR. In the Asia Pacific, a similar situation may be observed, as firms have gone to tremendous efforts to gain customer loyalty.
Functional Chewing Gums Market, By Geography
· North America (US & Canada)
· Europe (UK, Germany, France, Italy, Spain, Russia & Rest of Europe)
· Asia-Pacific (Japan, China, India, Australia, & South Korea, & Rest of Asia-Pacific)
· LAMEA (Brazil, Saudi Arabia, UAE & Rest of LAMEA)
Functional Chewing Gums Market, Key Players
· ABOAFSITE SA CV
· CAFOSA
· GSK group
· Gumlink Confectionery Company A/S
· LOTTE CONFECTIONERY CO. LTD.
· Med CBDX
· Miradent
· Mondelēz International
· Peppersmith
· Think Products LLC
· Rev Gum
Frequently Asked Questions (FAQ) :
Q1. What are the driving factors for the global Functional Chewing Gums market?
A significant driver driving the market is projected to be the increased popularity of functional chewing gums for treating health concerns
Q2. Which Segments are covered in the global Functional Chewing Gums market report?
Product, Distribution Channel, and Region. these segments are covered in the global Functional Chewing Gums market report.
Q3. Which segment is projected to hold the largest share in the global Functional Chewing Gums market?
Smoking Cessation Chewing Gums segment is projected to hold the largest share in the global Functional Chewing Gums market.
Q4. Which region holds the largest share in the global Functional Chewing Gums market?
North America holds the largest share in the global Functional Chewing Gums market.
Q5. Which are the prominent players in the global Functional Chewing Gums market?
ABOAFSITE SA CV, CAFOSA, GSK group, Gumlink Confectionery Company A/S, LOTTE CONFECTIONERY CO. LTD., Med CBDX, Miradent, Mondelēz International, Peppersmith, Think Products LLC, Rev Gum. are some key players in the global Functional Chewing Gums market
List of Figures
Figure 1: Global Functional Gum Market Revenue Breakdown (USD Billion, %) by Region, 2019 & 2027
Figure 2: Global Functional Gum Market Value Share (%), By Segment 1, 2019 & 2027
Figure 3: Global Functional Gum Market Forecast (USD Billion), by Sub-Segment 1, 2016-2027
Figure 4: Global Functional Gum Market Forecast (USD Billion), by Sub-Segment 2, 2016-2027
Figure 5: Global Functional Gum Market Value Share (%), By Segment 2, 2019 & 2027
Figure 6: Global Functional Gum Market Forecast (USD Billion), by Sub-Segment 1, 2016-2027
Figure 7: Global Functional Gum Market Forecast (USD Billion), by Sub-Segment 2, 2016-2027
Figure 8: Global Functional Gum Market Forecast (USD Billion), by Sub-Segment 3, 2016-2027
Figure 9: Global Functional Gum Market Forecast (USD Billion), by Others, 2016-2027
Figure 10: Global Functional Gum Market Value Share (%), By Segment 3, 2019 & 2027
Figure 11: Global Functional Gum Market Forecast (USD Billion), by Sub-Segment 1, 2016-2027
Figure 12: Global Functional Gum Market Forecast (USD Billion), by Sub-Segment 2, 2016-2027
Figure 13: Global Functional Gum Market Forecast (USD Billion), by Sub-Segment 3, 2016-2027
Figure 14: Global Functional Gum Market Forecast (USD Billion), by Others, 2016-2027
Figure 15: Global Functional Gum Market Value (USD Billion), by Region, 2019 & 2027
Figure 16: North America Functional Gum Market Value Share (%), By Segment 1, 2019 & 2027
Figure 17: North America Functional Gum Market Forecast (USD Billion), by Sub-Segment 1, 2016-2027
Figure 18: North America Functional Gum Market Forecast (USD Billion), by Sub-Segment 2, 2016-2027
Figure 19: North America Functional Gum Market Value Share (%), By Segment 2, 2019 & 2027
Figure 20: North America Functional Gum Market Forecast (USD Billion), by Sub-Segment 1, 2016-2027
Figure 21: North America Functional Gum Market Forecast (USD Billion), by Sub-Segment 2, 2016-2027
Figure 22: North America Functional Gum Market Forecast (USD Billion), by Sub-Segment 3, 2016-2027
Figure 23: North America Functional Gum Market Forecast (USD Billion), by Others, 2016-2027
Figure 24: North America Functional Gum Market Value Share (%), By Segment 3, 2019 & 2027
Figure 25: North America Functional Gum Market Forecast (USD Billion), by Sub-Segment 1, 2016-2027
Figure 26: North America Functional Gum Market Forecast (USD Billion), by Sub-Segment 2, 2016-2027
Figure 27: North America Functional Gum Market Forecast (USD Billion), by Sub-Segment 3, 2016-2027
Figure 28: North America Functional Gum Market Forecast (USD Billion), by Others, 2016-2027
Figure 29: North America Functional Gum Market Forecast (USD Billion), by U.S., 2016-2027
Figure 30: North America Functional Gum Market Forecast (USD Billion), by Canada, 2016-2027
Figure 31: Latin America Functional Gum Market Value Share (%), By Segment 1, 2019 & 2027
Figure 32: Latin America Functional Gum Market Forecast (USD Billion), by Sub-Segment 1, 2016-2027
Figure 33: Latin America Functional Gum Market Forecast (USD Billion), by Sub-Segment 2, 2016-2027
Figure 34: Latin America Functional Gum Market Value Share (%), By Segment 2, 2019 & 2027
Figure 35: Latin America Functional Gum Market Forecast (USD Billion), by Sub-Segment 1, 2016-2027
Figure 36: Latin America Functional Gum Market Forecast (USD Billion), by Sub-Segment 2, 2016-2027
Figure 37: Latin America Functional Gum Market Forecast (USD Billion), by Sub-Segment 3, 2016-2027
Figure 38: Latin America Functional Gum Market Forecast (USD Billion), by Others, 2016-2027
Figure 39: Latin America Functional Gum Market Value Share (%), By Segment 3, 2019 & 2027
Figure 40: Latin America Functional Gum Market Forecast (USD Billion), by Sub-Segment 1, 2016-2027
Figure 41: Latin America Functional Gum Market Forecast (USD Billion), by Sub-Segment 2, 2016-2027
Figure 42: Latin America Functional Gum Market Forecast (USD Billion), by Sub-Segment 3, 2016-2027
Figure 43: Latin America Functional Gum Market Forecast (USD Billion), by Others, 2016-2027
Figure 44: Latin America Functional Gum Market Forecast (USD Billion), by Brazil, 2016-2027
Figure 45: Latin America Functional Gum Market Forecast (USD Billion), by Mexico, 2016-2027
Figure 46: Latin America Functional Gum Market Forecast (USD Billion), by Rest of Latin America, 2016-2027
Figure 47: Europe Functional Gum Market Value Share (%), By Segment 1, 2019 & 2027
Figure 48: Europe Functional Gum Market Forecast (USD Billion), by Sub-Segment 1, 2016-2027
Figure 49: Europe Functional Gum Market Forecast (USD Billion), by Sub-Segment 2, 2016-2027
Figure 50: Europe Functional Gum Market Value Share (%), By Segment 2, 2019 & 2027
Figure 51: Europe Functional Gum Market Forecast (USD Billion), by Sub-Segment 1, 2016-2027
Figure 52: Europe Functional Gum Market Forecast (USD Billion), by Sub-Segment 2, 2016-2027
Figure 53: Europe Functional Gum Market Forecast (USD Billion), by Sub-Segment 3, 2016-2027
Figure 54: Europe Functional Gum Market Forecast (USD Billion), by Others, 2016-2027
Figure 55: Europe Functional Gum Market Value Share (%), By Segment 3, 2019 & 2027
Figure 56: Europe Functional Gum Market Forecast (USD Billion), by Sub-Segment 1, 2016-2027
Figure 57: Europe Functional Gum Market Forecast (USD Billion), by Sub-Segment 2, 2016-2027
Figure 58: Europe Functional Gum Market Forecast (USD Billion), by Sub-Segment 3, 2016-2027
Figure 59: Europe Functional Gum Market Forecast (USD Billion), by Others, 2016-2027
Figure 60: Europe Functional Gum Market Forecast (USD Billion), by U.K., 2016-2027
Figure 61: Europe Functional Gum Market Forecast (USD Billion), by Germany, 2016-2027
Figure 62: Europe Functional Gum Market Forecast (USD Billion), by France, 2016-2027
Figure 63: Europe Functional Gum Market Forecast (USD Billion), by Italy, 2016-2027
Figure 64: Europe Functional Gum Market Forecast (USD Billion), by Spain, 2016-2027
Figure 65: Europe Functional Gum Market Forecast (USD Billion), by Russia, 2016-2027
Figure 66: Europe Functional Gum Market Forecast (USD Billion), by Rest of Europe, 2016-2027
Figure 67: Asia Pacific Functional Gum Market Value Share (%), By Segment 1, 2019 & 2027
Figure 68: Asia Pacific Functional Gum Market Forecast (USD Billion), by Sub-Segment 1, 2016-2027
Figure 69: Asia Pacific Functional Gum Market Forecast (USD Billion), by Sub-Segment 2, 2016-2027
Figure 70: Asia Pacific Functional Gum Market Value Share (%), By Segment 2, 2019 & 2027
Figure 71: Asia Pacific Functional Gum Market Forecast (USD Billion), by Sub-Segment 1, 2016-2027
Figure 72: Asia Pacific Functional Gum Market Forecast (USD Billion), by Sub-Segment 2, 2016-2027
Figure 73: Asia Pacific Functional Gum Market Forecast (USD Billion), by Sub-Segment 3, 2016-2027
Figure 74: Asia Pacific Functional Gum Market Forecast (USD Billion), by Others, 2016-2027
Figure 75: Asia Pacific Functional Gum Market Value Share (%), By Segment 3, 2019 & 2027
Figure 76: Asia Pacific Functional Gum Market Forecast (USD Billion), by Sub-Segment 1, 2016-2027
Figure 77: Asia Pacific Functional Gum Market Forecast (USD Billion), by Sub-Segment 2, 2016-2027
Figure 78: Asia Pacific Functional Gum Market Forecast (USD Billion), by Sub-Segment 3, 2016-2027
Figure 79: Asia Pacific Functional Gum Market Forecast (USD Billion), by Others, 2016-2027
Figure 80: Asia Pacific Functional Gum Market Forecast (USD Billion), by China, 2016-2027
Figure 81: Asia Pacific Functional Gum Market Forecast (USD Billion), by India, 2016-2027
Figure 82: Asia Pacific Functional Gum Market Forecast (USD Billion), by Japan, 2016-2027
Figure 83: Asia Pacific Functional Gum Market Forecast (USD Billion), by Australia, 2016-2027
Figure 84: Asia Pacific Functional Gum Market Forecast (USD Billion), by Southeast Asia, 2016-2027
Figure 85: Asia Pacific Functional Gum Market Forecast (USD Billion), by Rest of Asia Pacific, 2016-2027
Figure 86: Middle East & Africa Functional Gum Market Value Share (%), By Segment 1, 2019 & 2027
Figure 87: Middle East & Africa Functional Gum Market Forecast (USD Billion), by Sub-Segment 1, 2016-2027
Figure 88: Middle East & Africa Functional Gum Market Forecast (USD Billion), by Sub-Segment 2, 2016-2027
Figure 89: Middle East & Africa Functional Gum Market Value Share (%), By Segment 2, 2019 & 2027
Figure 90: Middle East & Africa Functional Gum Market Forecast (USD Billion), by Sub-Segment 1, 2016-2027
Figure 91: Middle East & Africa Functional Gum Market Forecast (USD Billion), by Sub-Segment 2, 2016-2027
Figure 92: Middle East & Africa Functional Gum Market Forecast (USD Billion), by Sub-Segment 3, 2016-2027
Figure 93: Middle East & Africa Functional Gum Market Forecast (USD Billion), by Others, 2016-2027
Figure 94: Middle East & Africa Functional Gum Market Value Share (%), By Segment 3, 2019 & 2027
Figure 95: Middle East & Africa Functional Gum Market Forecast (USD Billion), by Sub-Segment 1, 2016-2027
Figure 96: Middle East & Africa Functional Gum Market Forecast (USD Billion), by Sub-Segment 2, 2016-2027
Figure 97: Middle East & Africa Functional Gum Market Forecast (USD Billion), by Sub-Segment 3, 2016-2027
Figure 98: Middle East & Africa Functional Gum Market Forecast (USD Billion), by Others, 2016-2027
Figure 99: Middle East & Africa Functional Gum Market Forecast (USD Billion), by GCC, 2016-2027
Figure 100: Middle East & Africa Functional Gum Market Forecast (USD Billion), by South Africa, 2016-2027
Figure 101: Middle East & Africa Functional Gum Market Forecast (USD Billion), by Rest of Middle East & Africa, 2016-2027
List of Tables
Table 1: Global Functional Gum Market Revenue (USD Billion) Forecast, by Segment 1, 2016-2027
Table 2: Global Functional Gum Market Revenue (USD Billion) Forecast, by Segment 2, 2016-2027
Table 3: Global Functional Gum Market Revenue (USD Billion) Forecast, by Segment 3, 2016-2027
Table 4: Global Functional Gum Market Revenue (USD Billion) Forecast, by Region, 2016-2027
Table 5: North America Functional Gum Market Revenue (USD Billion) Forecast, by Segment 1, 2016-2027
Table 6: North America Functional Gum Market Revenue (USD Billion) Forecast, by Segment 2, 2016-2027
Table 7: North America Functional Gum Market Revenue (USD Billion) Forecast, by Segment 3, 2016-2027
Table 8: North America Functional Gum Market Revenue (USD Billion) Forecast, by Country, 2016-2027
Table 9: Europe Functional Gum Market Revenue (USD Billion) Forecast, by Segment 1, 2016-2027
Table 10: Europe Functional Gum Market Revenue (USD Billion) Forecast, by Segment 2, 2016-2027
Table 11: Europe Functional Gum Market Revenue (USD Billion) Forecast, by Segment 3, 2016-2027
Table 12: Europe Functional Gum Market Revenue (USD Billion) Forecast, by Country, 2016-2027
Table 13: Latin America Functional Gum Market Revenue (USD Billion) Forecast, by Segment 1, 2016-2027
Table 14: Latin America Functional Gum Market Revenue (USD Billion) Forecast, by Segment 2, 2016-2027
Table 15: Latin America Functional Gum Market Revenue (USD Billion) Forecast, by Segment 3, 2016-2027
Table 16: Latin America Functional Gum Market Revenue (USD Billion) Forecast, by Country, 2016-2027
Table 17: Asia Pacific Functional Gum Market Revenue (USD Billion) Forecast, by Segment 1, 2016-2027
Table 18: Asia Pacific Functional Gum Market Revenue (USD Billion) Forecast, by Segment 2, 2016-2027
Table 19: Asia Pacific Functional Gum Market Revenue (USD Billion) Forecast, by Segment 3, 2016-2027
Table 20: Asia Pacific Functional Gum Market Revenue (USD Billion) Forecast, by Country, 2016-2027
Table 21: Middle East & Africa Functional Gum Market Revenue (USD Billion) Forecast, by Segment 1, 2016-2027
Table 22: Middle East & Africa Functional Gum Market Revenue (USD Billion) Forecast, by Segment 2, 2016-2027
Table 23: Middle East & Africa Functional Gum Market Revenue (USD Billion) Forecast, by Segment 3, 2016-2027
Table 24: Middle East & Africa Functional Gum Market Revenue (USD Billion) Forecast, by Country, 2016-2027
Research Process
Data Library Research are conducted by industry experts who offer insight on
industry structure, market segmentations technology assessment and competitive landscape (CL), and penetration, as well as on emerging trends. Their analysis is based on primary interviews (~ 80%) and secondary research (~ 20%) as well as years of professional expertise in their respective industries. Adding to this, by analysing historical trends and current market positions, our analysts predict where the market will be headed for the next five years. Furthermore, the varying trends of segment & categories geographically presented are also studied and the estimated based on the primary & secondary research.
In this particular report from the supply side Data Library Research has conducted primary surveys (interviews) with the key level executives (VP, CEO’s, Marketing Director, Business Development Manager
and SOFT) of the companies that active & prominent as well as the midsized organization
FIGURE 1: DLR RESEARH PROCESS
![research-methodology1]()
Primary Research
Extensive primary research was conducted to gain a deeper insight of the market and industry performance. The analysis is based on both primary and secondary research as well as years of professional expertise in the respective industries.
In addition to analysing current and historical trends, our analysts predict where the market is headed over the next five years.
It varies by segment for these categories geographically presented in the list of market tables. Speaking about this particular report we have conducted primary surveys (interviews) with the key level executives (VP, CEO’s, Marketing Director, Business Development Manager and many more) of the major players active in the market.
Secondary Research
Secondary research was mainly used to collect and identify information useful for the extensive, technical, market-oriented, and Friend’s study of the Global Extra Neutral Alcohol. It was also used to obtain key information about major players, market classification and segmentation according to the industry trends, geographical markets, and developments related to the market and technology perspectives. For this study, analysts have gathered information from various credible sources, such as annual reports, sec filings, journals, white papers, SOFT presentations, and company web sites.
Market Size Estimation
Both, top-down and bottom-up approaches were used to estimate and validate the size of the Global market and to estimate the size of various other dependent submarkets in the overall Extra Neutral Alcohol. The key players in the market were identified through secondary research and their market contributions in the respective geographies were determined through primary and secondary research.
Forecast Model
![research-methodology2]()