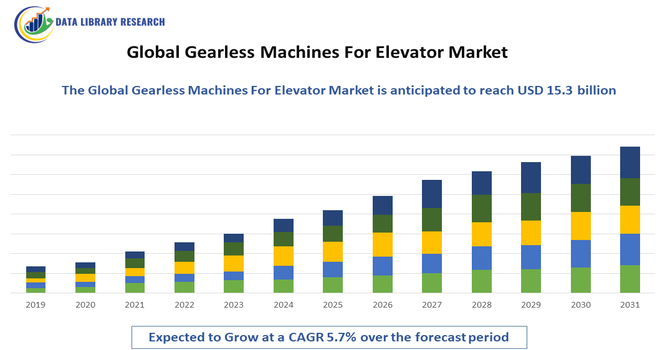
Gearless Machines For Elevators Market Overview and Analysis:
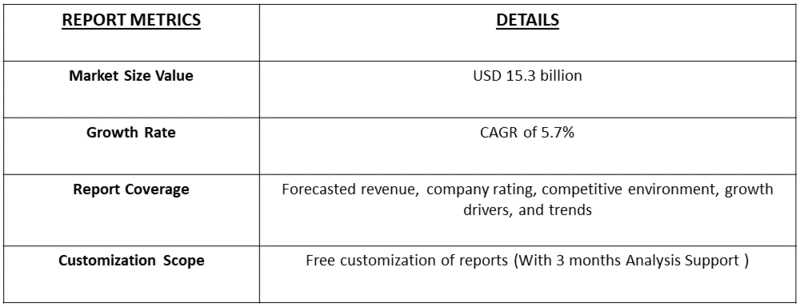
- The market is forecast to reach approximately USD 15.3 billion by 2035, from USD 3.2 billion in 2025, exhibiting a stable Compound Annual Growth Rate (CAGR) of about 5.7% from 2025-2032.
Get Complete Analysis Of The Report - Download Updated Free Sample PDF
The growth of the global gearless machines for elevators market is being driven by rising urbanization and the concomitant surge in demand for high rise residential and commercial buildings — which require efficient, high performance vertical transportation systems. Another major driver is the increasing emphasis on energy efficiency and sustainability: gearless elevator machines, particularly those using permanent magnet synchronous motors or direct drive systems, offer significantly lower energy consumption, smoother operation, reduced maintenance needs, and quieter rides compared to traditional geared systems.
Gearless Machines For Elevators Market Latest Trends
The market is increasingly shaped by growing demand for energy efficient and sustainable elevator solutions: gearless machines — especially those using permanent magnet synchronous (PMS) motors consume significantly less energy than conventional geared systems, making them attractive for developers aiming at green buildings and reduced operational costs. There is a rapid rise in adoption of smart building and IoT enabled elevators: gearless traction machines are now being integrated with sensors, cloud based monitoring, and predictive maintenance systems for better real time diagnostics, reduced downtime, and enhanced safety.
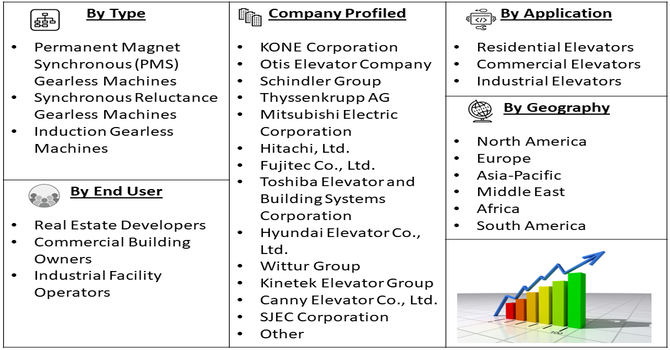
Segmentation: Global Gearless Machines For Elevators Market is segmented By Type (Permanent Magnet Synchronous (PMS) Gearless Machines, Synchronous Reluctance Gearless Machines, Induction Gearless Machines), Application (Residential Elevators, Commercial Elevators, Industrial Elevators), End-User (Real Estate Developers, Commercial Building Owners, Industrial Facility Operators), and Geography (North America, Europe, Asia-Pacific, Middle East and Africa, and South America). The report provides the value (in USD million) for the above segments.
For Detailed Market Segmentation - Get a Free Sample PDF
Market Drivers:
- Rising Urbanization and Expansion of High-Rise Buildings
One of the primary drivers of the gearless elevator machine market is the rapid urbanization and the associated surge in demand for high-rise residential, commercial, and mixed-use buildings. As urban populations grow, cities are increasingly developing vertically to optimize space, resulting in a higher need for elevators that are energy-efficient, reliable, and capable of handling high traffic. Gearless machines are particularly suitable for high-rise applications because they provide smoother rides, faster speeds, and higher load capacities compared to traditional geared machines. This makes them the preferred choice for developers and building owners seeking efficient vertical transportation solutions that improve occupant comfort while meeting modern construction standards.
- Increasing Focus on Energy Efficiency and Sustainability
Another major driver is the growing emphasis on energy efficiency and environmentally sustainable building solutions. Gearless machines, especially those equipped with permanent-magnet synchronous (PMS) motors, consume significantly less energy than conventional geared elevators. They also reduce maintenance requirements, operational noise, and wear on components, contributing to lower lifecycle costs. With global building codes and green building certifications increasingly emphasizing energy-efficient systems, gearless elevator machines are becoming a preferred solution for architects, builders, and facility managers aiming to reduce carbon footprints while ensuring smooth and reliable elevator performance.
Market Restraints:
Despite their advantages, gearless elevator machines carry a substantially higher initial cost compared with traditional geared or hydraulic systems — the advanced motors, drives and components required for gearless traction raise procurement and installation expenses, which discourages adoption in budget sensitive projects or smaller residential developments. Further, gearless systems demand specialized installation, commissioning, and maintenance expertise. The shortage of skilled technicians especially in many emerging markets — increases difficulty, cost and delays of installation or retrofitting, limiting market penetration. Retrofitting older buildings or existing elevator shafts with gearless systems can also be technically challenging. Many older structures may not have adequate shaft space or structural compatibility, making upgrades expensive or even unfeasible.
Socio-Economic Impact on Gearless Machines For Elevators Market
The global gearless machines for elevators market was significantly influenced by socioeconomic factors, as rapid urbanization, increasing high-rise construction, and growing commercial and residential infrastructure drove demand. Rising disposable incomes and a focus on modern, energy-efficient building solutions encouraged adoption in both developed and emerging economies. Government initiatives promoting smart cities and sustainable urban development further supported market growth. However, high initial investment costs and limited technical expertise in some regions constrained penetration. Thus, the market’s expansion reflected the interplay of economic development, urban lifestyle changes, and technological awareness, highlighting how social and economic trends shaped demand for advanced elevator solutions worldwide.
Segmental Analysis
- Permanent Magnet Synchronous (PMS) Gearless Machines segment is expected to witness the highest growth over the forecast period
Permanent Magnet Synchronous (PMS) gearless machines are widely adopted due to their high energy efficiency, compact design, and superior performance in high-rise buildings. These machines provide smooth and quiet operation with lower maintenance requirements compared to traditional geared systems. Their ability to handle high-speed and high-capacity operations makes them ideal for modern residential, commercial, and skyscraper applications. PMS gearless machines are also compatible with machine-room-less (MRL) elevators, which is a growing trend in urban construction.
- Commercial Elevators segment is expected to witness the highest growth over the forecast period
Commercial elevators are a major application segment for gearless machines, particularly in office buildings, shopping malls, and hotels. These elevators require reliable, high-speed, and energy-efficient vertical transport solutions to accommodate heavy traffic and frequent stops. Gearless machines ensure smooth ride quality and lower operational costs, which are essential for maintaining user satisfaction and reducing energy expenses in commercial facilities.
- Real Estate Developers segment is expected to witness highest growth over the forecast period
Real estate developers are key end-users driving demand for gearless elevator machines. They prioritize modern, efficient, and aesthetically integrated elevator solutions to enhance property value and appeal to tenants or buyers. The demand from high-rise residential and commercial projects is particularly strong, where space optimization, energy efficiency, and compliance with green building standards are critical.
- Asia Pacific segment is expected to witness the highest growth over the forecast period
The Asia Pacific region was expected to witness the highest growth in the global gearless machines for elevators market over the forecast period due to rapid urbanization, increasing high-rise residential and commercial construction, and growing investments in smart city infrastructure.
Countries such as China, India, Japan, and South Korea led demand, driven by expanding real estate, industrial, and commercial sectors. Rising disposable incomes and a preference for energy-efficient, low-maintenance elevator solutions further fueled adoption. Government initiatives promoting modern infrastructure development, high-speed transportation, and green building technologies also contributed. Additionally, the region’s focus on technological advancements and modernization of existing buildings created strong opportunities, positioning the Asia Pacific as a key growth driver in the market.
To Learn More About This Report - Request a Free Sample Copy
Gearless Machines For Elevators Market Competitive Landscape:
The competitive landscape of the global gearless machines for elevators market is highly dynamic, marked by a mix of large, established elevator manufacturers and specialized traction machine suppliers. Major players compete based on technology innovation (e.g. permanent magnet gearless drives, machine room-less (MRL) designs), energy efficiency, ride comfort, reliability, global distribution and service networks, and ability to deliver full elevator systems rather than just motors. Strategic partnerships, acquisitions, global expansions, and continuous R&D efforts — especially in smart building integration and energy efficient solutions — further intensify competition.
Key Players:
- KONE Corporation
- Otis Elevator Company
- Schindler Group
- Thyssenkrupp AG
- Mitsubishi Electric Corporation
- Hitachi, Ltd.
- Fujitec Co., Ltd.
- Toshiba Elevator and Building Systems Corporation
- Hyundai Elevator Co., Ltd.
- Wittur Group
- Kinetek Elevator Group
- Canny Elevator Co., Ltd.
- SJEC Corporation
- Sigma Elevator Company
- Kinetek De Sheng (Shanghai) Elevator Co., Ltd.
- Ningbo Xinda Group Co., Ltd.
- Sicher Elevator Co., Ltd.
- Express Lift Company
- Zhejiang Meilun Elevator Co., Ltd.
- Kleemann Hellas SA
Recent Development
- In November 2025, Otis Worldwide Corporation expanded its Gen3 Core elevator to cater to the U.S. market, where 80% of buildings are eight stories or less. This development boosted demand for gearless elevator technology, supporting energy-efficient, space-saving solutions and driving growth in the global gearless machines for elevators market.
- In April 2025, Schindler Elevator Corporation launched the Schindler 5000, a machine-room-less (MRL) elevator designed for low- to mid-rise offices, hotels, hospitals, and residential buildings. This innovation enhanced the adoption of gearless elevator technology, promoting energy-efficient, space-saving solutions and contributing to growth in the global gearless machines for elevators market.
Frequently Asked Questions (FAQ) :
Q1. What are the main growth-driving factors for this market?
The primary driver is the global push for energy efficiency and sustainability in modern buildings. Gearless machines consume significantly less power and are smaller, making them ideal for high-rise buildings where speed and space efficiency are critical. Additionally, the rapid rate of urbanization and new construction, particularly in developing nations, consistently fuels demand for new installations.
Q2. What are the main restraining factors for this market?
A major challenge is the higher initial investment cost compared to older, geared traction machines. The technology is more advanced and requires specialized manufacturing, which drives up the price. Also, the complexity of these high-tech systems demands highly skilled technicians for installation and maintenance, adding to the operational expense and limiting adoption in regions with insufficient technical expertise.
Q3. Which segment is expected to witness high growth?
The modernization segment is expected to experience exceptionally high growth. Many older buildings globally still use less efficient geared elevators. Property owners are now frequently replacing these aging systems with smooth, quiet, and energy-saving gearless machines during renovations, aiming to reduce long-term operating costs and enhance the overall building value.
Q4. Who are the top major players for this market?
The market is heavily concentrated and dominated by the world’s biggest elevator manufacturers. The top major players include Kone, Otis Elevator Company, Schindler Group, and TK Elevator (formerly ThyssenKrupp). These companies leverage their global reach, long-standing reputations, and continuous technological investments to maintain their leadership in providing gearless elevator solutions.
Q5. Which country is the largest player?
China, located within the Asia Pacific region, is the single largest country player in this market. Its market dominance is due to the unprecedented pace of new high-rise commercial and residential construction. The enormous volume of building projects and vast government support for advanced infrastructure create an unmatched demand for high-capacity, energy-efficient gearless elevator systems.
List of Figures
Figure 1: Global Gearless Machines For Elevators Market Revenue Breakdown (USD Billion, %) by Region, 2022 & 2029
Figure 2: Global Gearless Machines For Elevators Market Value Share (%), By Segment 1, 2022 & 2029
Figure 3: Global Gearless Machines For Elevators Market Forecast (USD Billion), by Sub-Segment 1, 2018-2029
Figure 4: Global Gearless Machines For Elevators Market Forecast (USD Billion), by Sub-Segment 2, 2018-2029
Figure 5: Global Gearless Machines For Elevators Market Value Share (%), By Segment 2, 2022 & 2029
Figure 6: Global Gearless Machines For Elevators Market Forecast (USD Billion), by Sub-Segment 1, 2018-2029
Figure 7: Global Gearless Machines For Elevators Market Forecast (USD Billion), by Sub-Segment 2, 2018-2029
Figure 8: Global Gearless Machines For Elevators Market Forecast (USD Billion), by Sub-Segment 3, 2018-2029
Figure 9: Global Gearless Machines For Elevators Market Forecast (USD Billion), by Others, 2018-2029
Figure 10: Global Gearless Machines For Elevators Market Value Share (%), By Segment 3, 2022 & 2029
Figure 11: Global Gearless Machines For Elevators Market Forecast (USD Billion), by Sub-Segment 1, 2018-2029
Figure 12: Global Gearless Machines For Elevators Market Forecast (USD Billion), by Sub-Segment 2, 2018-2029
Figure 13: Global Gearless Machines For Elevators Market Forecast (USD Billion), by Sub-Segment 3, 2018-2029
Figure 14: Global Gearless Machines For Elevators Market Forecast (USD Billion), by Others, 2018-2029
Figure 15: Global Gearless Machines For Elevators Market Value (USD Billion), by Region, 2022 & 2029
Figure 16: North America Gearless Machines For Elevators Market Value Share (%), By Segment 1, 2022 & 2029
Figure 17: North America Gearless Machines For Elevators Market Forecast (USD Billion), by Sub-Segment 1, 2018-2029
Figure 18: North America Gearless Machines For Elevators Market Forecast (USD Billion), by Sub-Segment 2, 2018-2029
Figure 19: North America Gearless Machines For Elevators Market Value Share (%), By Segment 2, 2022 & 2029
Figure 20: North America Gearless Machines For Elevators Market Forecast (USD Billion), by Sub-Segment 1, 2018-2029
Figure 21: North America Gearless Machines For Elevators Market Forecast (USD Billion), by Sub-Segment 2, 2018-2029
Figure 22: North America Gearless Machines For Elevators Market Forecast (USD Billion), by Sub-Segment 3, 2018-2029
Figure 23: North America Gearless Machines For Elevators Market Forecast (USD Billion), by Others, 2018-2029
Figure 24: North America Gearless Machines For Elevators Market Value Share (%), By Segment 3, 2022 & 2029
Figure 25: North America Gearless Machines For Elevators Market Forecast (USD Billion), by Sub-Segment 1, 2018-2029
Figure 26: North America Gearless Machines For Elevators Market Forecast (USD Billion), by Sub-Segment 2, 2018-2029
Figure 27: North America Gearless Machines For Elevators Market Forecast (USD Billion), by Sub-Segment 3, 2018-2029
Figure 28: North America Gearless Machines For Elevators Market Forecast (USD Billion), by Others, 2018-2029
Figure 29: North America Gearless Machines For Elevators Market Forecast (USD Billion), by U.S., 2018-2029
Figure 30: North America Gearless Machines For Elevators Market Forecast (USD Billion), by Canada, 2018-2029
Figure 31: Latin America Gearless Machines For Elevators Market Value Share (%), By Segment 1, 2022 & 2029
Figure 32: Latin America Gearless Machines For Elevators Market Forecast (USD Billion), by Sub-Segment 1, 2018-2029
Figure 33: Latin America Gearless Machines For Elevators Market Forecast (USD Billion), by Sub-Segment 2, 2018-2029
Figure 34: Latin America Gearless Machines For Elevators Market Value Share (%), By Segment 2, 2022 & 2029
Figure 35: Latin America Gearless Machines For Elevators Market Forecast (USD Billion), by Sub-Segment 1, 2018-2029
Figure 36: Latin America Gearless Machines For Elevators Market Forecast (USD Billion), by Sub-Segment 2, 2018-2029
Figure 37: Latin America Gearless Machines For Elevators Market Forecast (USD Billion), by Sub-Segment 3, 2018-2029
Figure 38: Latin America Gearless Machines For Elevators Market Forecast (USD Billion), by Others, 2018-2029
Figure 39: Latin America Gearless Machines For Elevators Market Value Share (%), By Segment 3, 2022 & 2029
Figure 40: Latin America Gearless Machines For Elevators Market Forecast (USD Billion), by Sub-Segment 1, 2018-2029
Figure 41: Latin America Gearless Machines For Elevators Market Forecast (USD Billion), by Sub-Segment 2, 2018-2029
Figure 42: Latin America Gearless Machines For Elevators Market Forecast (USD Billion), by Sub-Segment 3, 2018-2029
Figure 43: Latin America Gearless Machines For Elevators Market Forecast (USD Billion), by Others, 2018-2029
Figure 44: Latin America Gearless Machines For Elevators Market Forecast (USD Billion), by Brazil, 2018-2029
Figure 45: Latin America Gearless Machines For Elevators Market Forecast (USD Billion), by Mexico, 2018-2029
Figure 46: Latin America Gearless Machines For Elevators Market Forecast (USD Billion), by Rest of Latin America, 2018-2029
Figure 47: Europe Gearless Machines For Elevators Market Value Share (%), By Segment 1, 2022 & 2029
Figure 48: Europe Gearless Machines For Elevators Market Forecast (USD Billion), by Sub-Segment 1, 2018-2029
Figure 49: Europe Gearless Machines For Elevators Market Forecast (USD Billion), by Sub-Segment 2, 2018-2029
Figure 50: Europe Gearless Machines For Elevators Market Value Share (%), By Segment 2, 2022 & 2029
Figure 51: Europe Gearless Machines For Elevators Market Forecast (USD Billion), by Sub-Segment 1, 2018-2029
Figure 52: Europe Gearless Machines For Elevators Market Forecast (USD Billion), by Sub-Segment 2, 2018-2029
Figure 53: Europe Gearless Machines For Elevators Market Forecast (USD Billion), by Sub-Segment 3, 2018-2029
Figure 54: Europe Gearless Machines For Elevators Market Forecast (USD Billion), by Others, 2018-2029
Figure 55: Europe Gearless Machines For Elevators Market Value Share (%), By Segment 3, 2022 & 2029
Figure 56: Europe Gearless Machines For Elevators Market Forecast (USD Billion), by Sub-Segment 1, 2018-2029
Figure 57: Europe Gearless Machines For Elevators Market Forecast (USD Billion), by Sub-Segment 2, 2018-2029
Figure 58: Europe Gearless Machines For Elevators Market Forecast (USD Billion), by Sub-Segment 3, 2018-2029
Figure 59: Europe Gearless Machines For Elevators Market Forecast (USD Billion), by Others, 2018-2029
Figure 60: Europe Gearless Machines For Elevators Market Forecast (USD Billion), by U.K., 2018-2029
Figure 61: Europe Gearless Machines For Elevators Market Forecast (USD Billion), by Germany, 2018-2029
Figure 62: Europe Gearless Machines For Elevators Market Forecast (USD Billion), by France, 2018-2029
Figure 63: Europe Gearless Machines For Elevators Market Forecast (USD Billion), by Italy, 2018-2029
Figure 64: Europe Gearless Machines For Elevators Market Forecast (USD Billion), by Spain, 2018-2029
Figure 65: Europe Gearless Machines For Elevators Market Forecast (USD Billion), by Russia, 2018-2029
Figure 66: Europe Gearless Machines For Elevators Market Forecast (USD Billion), by Rest of Europe, 2018-2029
Figure 67: Asia Pacific Gearless Machines For Elevators Market Value Share (%), By Segment 1, 2022 & 2029
Figure 68: Asia Pacific Gearless Machines For Elevators Market Forecast (USD Billion), by Sub-Segment 1, 2018-2029
Figure 69: Asia Pacific Gearless Machines For Elevators Market Forecast (USD Billion), by Sub-Segment 2, 2018-2029
Figure 70: Asia Pacific Gearless Machines For Elevators Market Value Share (%), By Segment 2, 2022 & 2029
Figure 71: Asia Pacific Gearless Machines For Elevators Market Forecast (USD Billion), by Sub-Segment 1, 2018-2029
Figure 72: Asia Pacific Gearless Machines For Elevators Market Forecast (USD Billion), by Sub-Segment 2, 2018-2029
Figure 73: Asia Pacific Gearless Machines For Elevators Market Forecast (USD Billion), by Sub-Segment 3, 2018-2029
Figure 74: Asia Pacific Gearless Machines For Elevators Market Forecast (USD Billion), by Others, 2018-2029
Figure 75: Asia Pacific Gearless Machines For Elevators Market Value Share (%), By Segment 3, 2022 & 2029
Figure 76: Asia Pacific Gearless Machines For Elevators Market Forecast (USD Billion), by Sub-Segment 1, 2018-2029
Figure 77: Asia Pacific Gearless Machines For Elevators Market Forecast (USD Billion), by Sub-Segment 2, 2018-2029
Figure 78: Asia Pacific Gearless Machines For Elevators Market Forecast (USD Billion), by Sub-Segment 3, 2018-2029
Figure 79: Asia Pacific Gearless Machines For Elevators Market Forecast (USD Billion), by Others, 2018-2029
Figure 80: Asia Pacific Gearless Machines For Elevators Market Forecast (USD Billion), by China, 2018-2029
Figure 81: Asia Pacific Gearless Machines For Elevators Market Forecast (USD Billion), by India, 2018-2029
Figure 82: Asia Pacific Gearless Machines For Elevators Market Forecast (USD Billion), by Japan, 2018-2029
Figure 83: Asia Pacific Gearless Machines For Elevators Market Forecast (USD Billion), by Australia, 2018-2029
Figure 84: Asia Pacific Gearless Machines For Elevators Market Forecast (USD Billion), by Southeast Asia, 2018-2029
Figure 85: Asia Pacific Gearless Machines For Elevators Market Forecast (USD Billion), by Rest of Asia Pacific, 2018-2029
Figure 86: Middle East & Africa Gearless Machines For Elevators Market Value Share (%), By Segment 1, 2022 & 2029
Figure 87: Middle East & Africa Gearless Machines For Elevators Market Forecast (USD Billion), by Sub-Segment 1, 2018-2029
Figure 88: Middle East & Africa Gearless Machines For Elevators Market Forecast (USD Billion), by Sub-Segment 2, 2018-2029
Figure 89: Middle East & Africa Gearless Machines For Elevators Market Value Share (%), By Segment 2, 2022 & 2029
Figure 90: Middle East & Africa Gearless Machines For Elevators Market Forecast (USD Billion), by Sub-Segment 1, 2018-2029
Figure 91: Middle East & Africa Gearless Machines For Elevators Market Forecast (USD Billion), by Sub-Segment 2, 2018-2029
Figure 92: Middle East & Africa Gearless Machines For Elevators Market Forecast (USD Billion), by Sub-Segment 3, 2018-2029
Figure 93: Middle East & Africa Gearless Machines For Elevators Market Forecast (USD Billion), by Others, 2018-2029
Figure 94: Middle East & Africa Gearless Machines For Elevators Market Value Share (%), By Segment 3, 2022 & 2029
Figure 95: Middle East & Africa Gearless Machines For Elevators Market Forecast (USD Billion), by Sub-Segment 1, 2018-2029
Figure 96: Middle East & Africa Gearless Machines For Elevators Market Forecast (USD Billion), by Sub-Segment 2, 2018-2029
Figure 97: Middle East & Africa Gearless Machines For Elevators Market Forecast (USD Billion), by Sub-Segment 3, 2018-2029
Figure 98: Middle East & Africa Gearless Machines For Elevators Market Forecast (USD Billion), by Others, 2018-2029
Figure 99: Middle East & Africa Gearless Machines For Elevators Market Forecast (USD Billion), by GCC, 2018-2029
Figure 100: Middle East & Africa Gearless Machines For Elevators Market Forecast (USD Billion), by South Africa, 2018-2029
Figure 101: Middle East & Africa Gearless Machines For Elevators Market Forecast (USD Billion), by Rest of Middle East & Africa, 2018-2029
List of Tables
Table 1: Global Gearless Machines For Elevators Market Revenue (USD Billion) Forecast, by Segment 1, 2018-2029
Table 2: Global Gearless Machines For Elevators Market Revenue (USD Billion) Forecast, by Segment 2, 2018-2029
Table 3: Global Gearless Machines For Elevators Market Revenue (USD Billion) Forecast, by Segment 3, 2018-2029
Table 4: Global Gearless Machines For Elevators Market Revenue (USD Billion) Forecast, by Region, 2018-2029
Table 5: North America Gearless Machines For Elevators Market Revenue (USD Billion) Forecast, by Segment 1, 2018-2029
Table 6: North America Gearless Machines For Elevators Market Revenue (USD Billion) Forecast, by Segment 2, 2018-2029
Table 7: North America Gearless Machines For Elevators Market Revenue (USD Billion) Forecast, by Segment 3, 2018-2029
Table 8: North America Gearless Machines For Elevators Market Revenue (USD Billion) Forecast, by Country, 2018-2029
Table 9: Europe Gearless Machines For Elevators Market Revenue (USD Billion) Forecast, by Segment 1, 2018-2029
Table 10: Europe Gearless Machines For Elevators Market Revenue (USD Billion) Forecast, by Segment 2, 2018-2029
Table 11: Europe Gearless Machines For Elevators Market Revenue (USD Billion) Forecast, by Segment 3, 2018-2029
Table 12: Europe Gearless Machines For Elevators Market Revenue (USD Billion) Forecast, by Country, 2018-2029
Table 13: Latin America Gearless Machines For Elevators Market Revenue (USD Billion) Forecast, by Segment 1, 2018-2029
Table 14: Latin America Gearless Machines For Elevators Market Revenue (USD Billion) Forecast, by Segment 2, 2018-2029
Table 15: Latin America Gearless Machines For Elevators Market Revenue (USD Billion) Forecast, by Segment 3, 2018-2029
Table 16: Latin America Gearless Machines For Elevators Market Revenue (USD Billion) Forecast, by Country, 2018-2029
Table 17: Asia Pacific Gearless Machines For Elevators Market Revenue (USD Billion) Forecast, by Segment 1, 2018-2029
Table 18: Asia Pacific Gearless Machines For Elevators Market Revenue (USD Billion) Forecast, by Segment 2, 2018-2029
Table 19: Asia Pacific Gearless Machines For Elevators Market Revenue (USD Billion) Forecast, by Segment 3, 2018-2029
Table 20: Asia Pacific Gearless Machines For Elevators Market Revenue (USD Billion) Forecast, by Country, 2018-2029
Table 21: Middle East & Africa Gearless Machines For Elevators Market Revenue (USD Billion) Forecast, by Segment 1, 2018-2029
Table 22: Middle East & Africa Gearless Machines For Elevators Market Revenue (USD Billion) Forecast, by Segment 2, 2018-2029
Table 23: Middle East & Africa Gearless Machines For Elevators Market Revenue (USD Billion) Forecast, by Segment 3, 2018-2029
Table 24: Middle East & Africa Gearless Machines For Elevators Market Revenue (USD Billion) Forecast, by Country, 2018-2029
Research Process
Data Library Research are conducted by industry experts who offer insight on
industry structure, market segmentations technology assessment and competitive landscape (CL), and penetration, as well as on emerging trends. Their analysis is based on primary interviews (~ 80%) and secondary research (~ 20%) as well as years of professional expertise in their respective industries. Adding to this, by analysing historical trends and current market positions, our analysts predict where the market will be headed for the next five years. Furthermore, the varying trends of segment & categories geographically presented are also studied and the estimated based on the primary & secondary research.
In this particular report from the supply side Data Library Research has conducted primary surveys (interviews) with the key level executives (VP, CEO’s, Marketing Director, Business Development Manager
and SOFT) of the companies that active & prominent as well as the midsized organization
FIGURE 1: DLR RESEARH PROCESS
![research-methodology1]()
Primary Research
Extensive primary research was conducted to gain a deeper insight of the market and industry performance. The analysis is based on both primary and secondary research as well as years of professional expertise in the respective industries.
In addition to analysing current and historical trends, our analysts predict where the market is headed over the next five years.
It varies by segment for these categories geographically presented in the list of market tables. Speaking about this particular report we have conducted primary surveys (interviews) with the key level executives (VP, CEO’s, Marketing Director, Business Development Manager and many more) of the major players active in the market.
Secondary Research
Secondary research was mainly used to collect and identify information useful for the extensive, technical, market-oriented, and Friend’s study of the Global Extra Neutral Alcohol. It was also used to obtain key information about major players, market classification and segmentation according to the industry trends, geographical markets, and developments related to the market and technology perspectives. For this study, analysts have gathered information from various credible sources, such as annual reports, sec filings, journals, white papers, SOFT presentations, and company web sites.
Market Size Estimation
Both, top-down and bottom-up approaches were used to estimate and validate the size of the Global market and to estimate the size of various other dependent submarkets in the overall Extra Neutral Alcohol. The key players in the market were identified through secondary research and their market contributions in the respective geographies were determined through primary and secondary research.
Forecast Model
![research-methodology2]()