Generic Anti-cancer Injectables Market Overview and Analysis
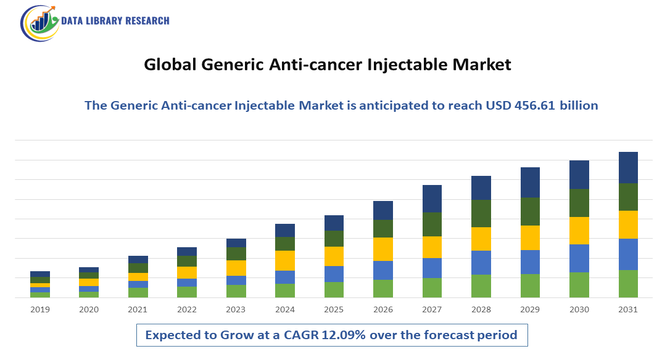
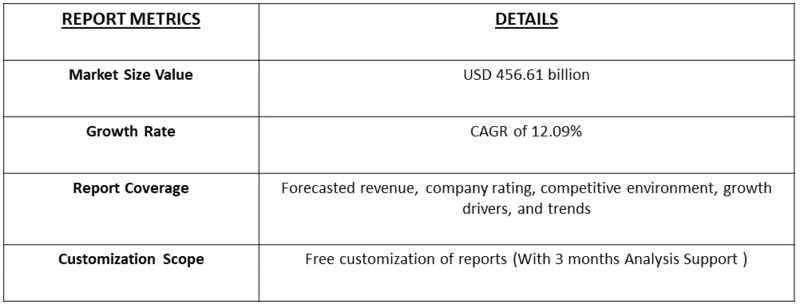
- The Global Generic Anti-cancer Injectables Market size was estimated at USD 106.60 billion in 2025 and is expected to attain around USD 456.61 billion by 2032, growing at a CAGR of 12.09% from 2025-2032.
Get Complete Analysis Of The Report - Download Updated Free Sample PDF
The Global Generic Anti-cancer Injectables Market is projected to experience steady growth over the forecast period from 2025 to 2032, primarily driven by the rising global burden of cancer and the increasing demand for affordable and effective oncology treatments. The growing adoption of generic formulations, driven by patent expirations of major branded drugs and supportive government initiatives to promote low-cost cancer therapies, is further fueling market expansion. Overall, the market is expected to register a CAGR of approximately 7% during the forecast period.
Generic Anti-cancer Injectables Market Latest Trends
The Global Generic Anti-cancer Injectables Market is witnessing several emerging trends, including the rapid expansion of biosimilars and generic oncology injectables as cost-effective alternatives to branded drugs. Pharmaceutical companies are increasingly focusing on developing high-quality generics with advanced formulations and improved delivery mechanisms to enhance patient outcomes and treatment compliance. Additionally, the rising number of patent expirations of blockbuster cancer drugs has opened lucrative opportunities for generic manufacturers. There is also a growing trend toward strategic collaborations, mergers, and acquisitions among key players to strengthen production capacity and expand global distribution networks.
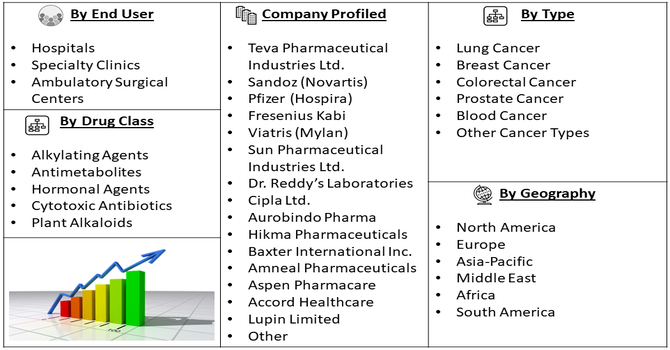
Segmentation: Global Generic Anti-cancer Injectables Market is segmented By Drug Class (The market is categorized into Alkylating Agents, Antimetabolites, Hormonal Agents, Cytotoxic Antibiotics, Plant Alkaloids), Cancer Type (Lung Cancer, Breast Cancer, Colorectal Cancer, Prostate Cancer, Blood Cancer, and Other Cancer Types), End User (Hospitals, Specialty Clinics, and Ambulatory Surgical Centers), and Geography (North America, Europe, Asia-Pacific, Middle East and Africa, and South America). The report provides the value (in USD million) for the above segments.
For Detailed Market Segmentation - Get a Free Sample PDF
Generic Anti-cancer Injectables Market Drivers
- Rising Global Cancer Prevalence and Increasing Demand for Affordable Therapies
The major drivers fueling the growth of the global generic anti-cancer injectables market is the rising incidence of various cancers, including lung, breast, colorectal, and prostate cancers, worldwide. For instance, in February 2025, Towards a Cancer-Free India, an initiative by Government of India, reported that in 2022, approximately 20 million new cancer cases were reported globally, while India saw around 100 cases per 1 lakh people and over 1.4 million incidences in 2023. This rising cancer prevalence drove demand for affordable therapies worldwide, highlighting the need for accessible, cost-effective treatments to address the growing patient population. Governments and healthcare organizations are increasingly supporting the use of generics through favorable reimbursement policies, regulatory approvals, and public health initiatives, further accelerating market adoption.
- Patent Expirations of Major Branded Oncology Drugs and Increasing Biosimilar Approvals
The expiration of patents for several blockbuster cancer drugs has opened significant opportunities for generic manufacturers to enter the market with low-cost injectable alternatives. As pharmaceutical giants lose exclusivity on their key oncology products, generic drug producers are rapidly launching equivalent formulations to capture market share.
Additionally, the regulatory landscape has become more supportive of biosimilar and generic drug approvals, with agencies such as the U.S. FDA and EMA streamlining approval processes to encourage competition and reduce treatment costs. For instance, in Febraury 2025, Pfizer announced that the FDA approved a supplemental BLA for ADCETRIS® in combination with lenalidomide and rituximab for relapsed or refractory large B-cell lymphoma patients ineligible for auto-HSCT or CAR T-cell therapy. This approval highlighted the ongoing shift in oncology, where patent expirations of major branded drugs and rising biosimilar approvals are expanding treatment options and market competition.
Market Restraints:
- Stringent Regulatory Requirements and Complex Manufacturing Processes
The growth of the Global Generic Anti-cancer Injectables Market is hindered by several key challenges, primarily the stringent regulatory requirements and complex manufacturing processes associated with injectable oncology drugs. Producing high-quality generic injectables demands advanced technology, sterile facilities, and strict adherence to regulatory standards, leading to high production costs and longer approval timelines. Additionally, price erosion due to intense market competition among generic manufacturers significantly impacts profit margins, discouraging smaller companies from entering the market. Another major restraint is the shortage of raw materials and active pharmaceutical ingredients (APIs), which disrupts production and supply chains, especially in developing regions.
Socio Economic Impact onGeneric Anti-cancer Injectables Market
The Global Generic Anti-Cancer Injectables Market plays a crucial role in improving access to affordable cancer treatments, especially in low- and middle-income countries. By offering cost-effective alternatives to branded therapies, it reduces the financial burden on patients, families, and healthcare systems. This market also supports healthcare infrastructure by enabling hospitals and clinics to provide more consistent and widespread cancer care. Economically, it drives growth in the pharmaceutical manufacturing sector, creates jobs, and encourages competition that can lower overall treatment costs. Additionally, by making life-saving therapies more accessible, it contributes to better patient outcomes and productivity, ultimately supporting broader social and economic stability in communities affected by cancer.
Segmental Analysis:
- Antimetabolites segment is expected to witness highest growth over the forecast period
Antimetabolites hold a significant share of the global generic anti-cancer injectables market, primarily due to their broad therapeutic applications in treating multiple cancer types, including breast, lung, and colorectal cancers. These drugs interfere with DNA and RNA synthesis, effectively inhibiting cancer cell growth and proliferation. Widely used antimetabolite generics such as Methotrexate, Fluorouracil, and Gemcitabine have established strong clinical efficacy and cost-effectiveness, making them preferred options in chemotherapy regimens. Continuous efforts to enhance formulation stability and reduce toxicity are further strengthening the adoption of antimetabolite-based injectables across oncology treatment centers.
- Lung Cancer segment is expected to witness highest growth over the forecast period
The lung cancer segment dominates the market and is expected to maintain its leading position over the forecast period, driven by the rising global incidence of both non-small cell and small cell lung cancers. Factors such as high smoking rates, environmental pollution, and aging populations have contributed to increasing lung cancer cases. Generic anti-cancer injectables play a crucial role in improving accessibility to treatment, particularly in developing countries where affordability remains a concern. The availability of a wide range of generic chemotherapeutic agents for lung cancer has further boosted this segment’s growth.
- Hospitals segment is expected to witness highest growth over the forecast period
The hospital segment accounts for the largest market share owing to the high volume of cancer treatments and the availability of advanced oncology care infrastructure. Hospitals serve as the primary centers for administering injectable cancer therapies due to the need for trained medical personnel, infusion facilities, and continuous patient monitoring. Growing investments in hospital-based oncology departments and the expansion of public healthcare systems are contributing to the increased adoption of generic anti-cancer injectables within this segment.
- North America region is expected to witness highest growth over the forecast period
North America is expected to witness the highest growth over the forecast period, supported by a well-established healthcare infrastructure, strong presence of leading pharmaceutical manufacturers, and favorable regulatory frameworks for generic drug approvals. For instance, in 2025, The FDA approved Poherdy (pertuzumab-dpzb) injection as the first interchangeable biosimilar to Perjeta (pertuzumab). Poherdy was authorized for use in adults in the same indications as Perjeta, including combination with trastuzumab and docetaxel for HER2-positive metastatic breast cancer, neoadjuvant therapy with trastuzumab and chemotherapy for locally advanced or early-stage breast cancer, and adjuvant treatment for high-risk HER2-positive early breast cancer. The U.S., in particular, has been at the forefront of adopting generic oncology injectables due to patent expirations of major branded drugs and initiatives by healthcare authorities to reduce treatment costs.
Moreover, the rising cancer incidence and increasing patient preference for cost-effective therapies are further driving market growth across the region. For instance, in 2025, American Cancer Society reported that, in 2022, around 20 million new cancer cases were diagnosed. By 2050, cases are projected to reach 35 million due to population growth. This rising cancer prevalence in the U.S. heightened demand for affordable therapies, emphasizing the need for cost-effective treatment options to manage the expanding patient population. Similarly, Canadian Cancer Society reported that, Researchers projected that Canada would see approximately 254,800 new cancer cases and 87,400 cancer-related deaths in 2025, excluding non-melanoma skin cancers from the case count.
Thus, together all such factors are driving the growth of this market in above region.
To Learn More About This Report - Request a Free Sample Copy
Generic Anti-cancer Injectables Market Competitive Landscape
The Global Generic Anti-cancer Injectables Market is highly competitive, featuring large multinational generic drug manufacturers, specialist injectable producers, and regionally strong pharma firms. Companies compete on manufacturing scale, sterile-fill capabilities, price competitiveness, regulatory approvals, and supply-chain reliability, while strategic partnerships and capacity expansions drive market share in oncology injectables.
Key Players:
- Teva Pharmaceutical Industries Ltd.
- Sandoz (Novartis)
- Pfizer (Hospira)
- Fresenius Kabi
- Viatris (Mylan)
- Sun Pharmaceutical Industries Ltd.
- Dr. Reddy’s Laboratories
- Cipla Ltd.
- Aurobindo Pharma
- Hikma Pharmaceuticals
- Baxter International Inc.
- Amneal Pharmaceuticals
- Aspen Pharmacare
- Accord Healthcare
- Lupin Limited
- Intas Pharmaceuticals
- Zydus Cadila
- Sagent Pharmaceuticals
- Alembic Pharmaceuticals
- Piramal Pharma Solutions
Recent Development
- In September 2025, Glenmark Pharmaceuticals announced that it launched a generic cancer treatment in the U.S. market. Its U.S. subsidiary introduced Eribulin Mesylate Injection (1 mg/2 mL, 0.5 mg/mL) in single-dose vials, marking a key step in expanding affordable oncology therapies in the region. The move strengthened Glenmark’s presence in the U.S. generic anti-cancer injectables market.
- In May 2025, Meitheal Pharmaceuticals, a Chicago-based biopharmaceutical company, launched a generic version of Abraxane in the U.S. through an exclusive license and supply agreement with its parent, Hong Kong King-Friend Industry Co. The 100 mg/vial single-dose paclitaxel protein-bound injectable was indicated for treating metastatic breast cancer, pancreatic adenocarcinoma, and locally advanced or metastatic non-small cell lung cancer.
Frequently Asked Questions (FAQ) :
Q1. What are the main growth-driving factors for this market?
The primary driver is the rising global incidence of various cancers, coupled with increasing demand for affordable treatment options, particularly in developing nations. Growth is also fueled by the expiration of patents on blockbuster chemotherapy drugs, allowing generic manufacturers to enter the market at lower prices. Furthermore, government policies promoting cost containment in healthcare systems strongly favor the use of generics.
Q2. What are the main restraining factors for this market?
A key constraint is the intense price erosion caused by fierce competition among numerous generic manufacturers, which compresses profit margins. The market also struggles with strict and complex regulatory pathways required for biosimilars and injectables, necessitating significant investment in clinical trials. Concerns over product quality and manufacturing consistency among smaller producers also restrain market growth in highly regulated areas.
Q3. Which segment is expected to witness high growth?
The Hospital and Institutional Pharmacy Segment is projected to witness the highest growth. This is where the majority of injectable chemotherapy is prepared and administered to patients. Driven by the need for cost-effective cancer care and the large-scale purchasing power of central procurement bodies, hospitals consistently favor high-volume, affordable generic injectables over expensive branded versions to treat a wide range of common cancers.
Q4. Who are the top major players for this market?
The market is dominated by large, established generic and specialty pharmaceutical companies. Top major players include Teva Pharmaceutical Industries Ltd., Sun Pharmaceutical Industries Ltd., Mylan N.V. (Viatris), and Dr. Reddy's Laboratories. Competition focuses on achieving first-to-file status for new generic versions, maintaining a robust supply chain to prevent drug shortages, and ensuring consistent manufacturing quality across their diverse portfolio of cancer treatments.
Q5. Which country is the largest player?
The United States is the largest country player by value, due to the highest total healthcare expenditure and significant demand for chemotherapy drugs. However, India is the largest player by volume and production, as it is a global manufacturing hub that exports generic injectables worldwide. The US market provides the highest revenue per unit, while India dominates the world's supply chain capacity.
List of Figures
Figure 1: Global Generic Anti-cancer Injectables Market Revenue Breakdown (USD Billion, %) by Region, 2022 & 2029
Figure 2: Global Generic Anti-cancer Injectables Market Value Share (%), By Segment 1, 2022 & 2029
Figure 3: Global Generic Anti-cancer Injectables Market Forecast (USD Billion), by Sub-Segment 1, 2018-2029
Figure 4: Global Generic Anti-cancer Injectables Market Forecast (USD Billion), by Sub-Segment 2, 2018-2029
Figure 5: Global Generic Anti-cancer Injectables Market Value Share (%), By Segment 2, 2022 & 2029
Figure 6: Global Generic Anti-cancer Injectables Market Forecast (USD Billion), by Sub-Segment 1, 2018-2029
Figure 7: Global Generic Anti-cancer Injectables Market Forecast (USD Billion), by Sub-Segment 2, 2018-2029
Figure 8: Global Generic Anti-cancer Injectables Market Forecast (USD Billion), by Sub-Segment 3, 2018-2029
Figure 9: Global Generic Anti-cancer Injectables Market Forecast (USD Billion), by Others, 2018-2029
Figure 10: Global Generic Anti-cancer Injectables Market Value Share (%), By Segment 3, 2022 & 2029
Figure 11: Global Generic Anti-cancer Injectables Market Forecast (USD Billion), by Sub-Segment 1, 2018-2029
Figure 12: Global Generic Anti-cancer Injectables Market Forecast (USD Billion), by Sub-Segment 2, 2018-2029
Figure 13: Global Generic Anti-cancer Injectables Market Forecast (USD Billion), by Sub-Segment 3, 2018-2029
Figure 14: Global Generic Anti-cancer Injectables Market Forecast (USD Billion), by Others, 2018-2029
Figure 15: Global Generic Anti-cancer Injectables Market Value (USD Billion), by Region, 2022 & 2029
Figure 16: North America Generic Anti-cancer Injectables Market Value Share (%), By Segment 1, 2022 & 2029
Figure 17: North America Generic Anti-cancer Injectables Market Forecast (USD Billion), by Sub-Segment 1, 2018-2029
Figure 18: North America Generic Anti-cancer Injectables Market Forecast (USD Billion), by Sub-Segment 2, 2018-2029
Figure 19: North America Generic Anti-cancer Injectables Market Value Share (%), By Segment 2, 2022 & 2029
Figure 20: North America Generic Anti-cancer Injectables Market Forecast (USD Billion), by Sub-Segment 1, 2018-2029
Figure 21: North America Generic Anti-cancer Injectables Market Forecast (USD Billion), by Sub-Segment 2, 2018-2029
Figure 22: North America Generic Anti-cancer Injectables Market Forecast (USD Billion), by Sub-Segment 3, 2018-2029
Figure 23: North America Generic Anti-cancer Injectables Market Forecast (USD Billion), by Others, 2018-2029
Figure 24: North America Generic Anti-cancer Injectables Market Value Share (%), By Segment 3, 2022 & 2029
Figure 25: North America Generic Anti-cancer Injectables Market Forecast (USD Billion), by Sub-Segment 1, 2018-2029
Figure 26: North America Generic Anti-cancer Injectables Market Forecast (USD Billion), by Sub-Segment 2, 2018-2029
Figure 27: North America Generic Anti-cancer Injectables Market Forecast (USD Billion), by Sub-Segment 3, 2018-2029
Figure 28: North America Generic Anti-cancer Injectables Market Forecast (USD Billion), by Others, 2018-2029
Figure 29: North America Generic Anti-cancer Injectables Market Forecast (USD Billion), by U.S., 2018-2029
Figure 30: North America Generic Anti-cancer Injectables Market Forecast (USD Billion), by Canada, 2018-2029
Figure 31: Latin America Generic Anti-cancer Injectables Market Value Share (%), By Segment 1, 2022 & 2029
Figure 32: Latin America Generic Anti-cancer Injectables Market Forecast (USD Billion), by Sub-Segment 1, 2018-2029
Figure 33: Latin America Generic Anti-cancer Injectables Market Forecast (USD Billion), by Sub-Segment 2, 2018-2029
Figure 34: Latin America Generic Anti-cancer Injectables Market Value Share (%), By Segment 2, 2022 & 2029
Figure 35: Latin America Generic Anti-cancer Injectables Market Forecast (USD Billion), by Sub-Segment 1, 2018-2029
Figure 36: Latin America Generic Anti-cancer Injectables Market Forecast (USD Billion), by Sub-Segment 2, 2018-2029
Figure 37: Latin America Generic Anti-cancer Injectables Market Forecast (USD Billion), by Sub-Segment 3, 2018-2029
Figure 38: Latin America Generic Anti-cancer Injectables Market Forecast (USD Billion), by Others, 2018-2029
Figure 39: Latin America Generic Anti-cancer Injectables Market Value Share (%), By Segment 3, 2022 & 2029
Figure 40: Latin America Generic Anti-cancer Injectables Market Forecast (USD Billion), by Sub-Segment 1, 2018-2029
Figure 41: Latin America Generic Anti-cancer Injectables Market Forecast (USD Billion), by Sub-Segment 2, 2018-2029
Figure 42: Latin America Generic Anti-cancer Injectables Market Forecast (USD Billion), by Sub-Segment 3, 2018-2029
Figure 43: Latin America Generic Anti-cancer Injectables Market Forecast (USD Billion), by Others, 2018-2029
Figure 44: Latin America Generic Anti-cancer Injectables Market Forecast (USD Billion), by Brazil, 2018-2029
Figure 45: Latin America Generic Anti-cancer Injectables Market Forecast (USD Billion), by Mexico, 2018-2029
Figure 46: Latin America Generic Anti-cancer Injectables Market Forecast (USD Billion), by Rest of Latin America, 2018-2029
Figure 47: Europe Generic Anti-cancer Injectables Market Value Share (%), By Segment 1, 2022 & 2029
Figure 48: Europe Generic Anti-cancer Injectables Market Forecast (USD Billion), by Sub-Segment 1, 2018-2029
Figure 49: Europe Generic Anti-cancer Injectables Market Forecast (USD Billion), by Sub-Segment 2, 2018-2029
Figure 50: Europe Generic Anti-cancer Injectables Market Value Share (%), By Segment 2, 2022 & 2029
Figure 51: Europe Generic Anti-cancer Injectables Market Forecast (USD Billion), by Sub-Segment 1, 2018-2029
Figure 52: Europe Generic Anti-cancer Injectables Market Forecast (USD Billion), by Sub-Segment 2, 2018-2029
Figure 53: Europe Generic Anti-cancer Injectables Market Forecast (USD Billion), by Sub-Segment 3, 2018-2029
Figure 54: Europe Generic Anti-cancer Injectables Market Forecast (USD Billion), by Others, 2018-2029
Figure 55: Europe Generic Anti-cancer Injectables Market Value Share (%), By Segment 3, 2022 & 2029
Figure 56: Europe Generic Anti-cancer Injectables Market Forecast (USD Billion), by Sub-Segment 1, 2018-2029
Figure 57: Europe Generic Anti-cancer Injectables Market Forecast (USD Billion), by Sub-Segment 2, 2018-2029
Figure 58: Europe Generic Anti-cancer Injectables Market Forecast (USD Billion), by Sub-Segment 3, 2018-2029
Figure 59: Europe Generic Anti-cancer Injectables Market Forecast (USD Billion), by Others, 2018-2029
Figure 60: Europe Generic Anti-cancer Injectables Market Forecast (USD Billion), by U.K., 2018-2029
Figure 61: Europe Generic Anti-cancer Injectables Market Forecast (USD Billion), by Germany, 2018-2029
Figure 62: Europe Generic Anti-cancer Injectables Market Forecast (USD Billion), by France, 2018-2029
Figure 63: Europe Generic Anti-cancer Injectables Market Forecast (USD Billion), by Italy, 2018-2029
Figure 64: Europe Generic Anti-cancer Injectables Market Forecast (USD Billion), by Spain, 2018-2029
Figure 65: Europe Generic Anti-cancer Injectables Market Forecast (USD Billion), by Russia, 2018-2029
Figure 66: Europe Generic Anti-cancer Injectables Market Forecast (USD Billion), by Rest of Europe, 2018-2029
Figure 67: Asia Pacific Generic Anti-cancer Injectables Market Value Share (%), By Segment 1, 2022 & 2029
Figure 68: Asia Pacific Generic Anti-cancer Injectables Market Forecast (USD Billion), by Sub-Segment 1, 2018-2029
Figure 69: Asia Pacific Generic Anti-cancer Injectables Market Forecast (USD Billion), by Sub-Segment 2, 2018-2029
Figure 70: Asia Pacific Generic Anti-cancer Injectables Market Value Share (%), By Segment 2, 2022 & 2029
Figure 71: Asia Pacific Generic Anti-cancer Injectables Market Forecast (USD Billion), by Sub-Segment 1, 2018-2029
Figure 72: Asia Pacific Generic Anti-cancer Injectables Market Forecast (USD Billion), by Sub-Segment 2, 2018-2029
Figure 73: Asia Pacific Generic Anti-cancer Injectables Market Forecast (USD Billion), by Sub-Segment 3, 2018-2029
Figure 74: Asia Pacific Generic Anti-cancer Injectables Market Forecast (USD Billion), by Others, 2018-2029
Figure 75: Asia Pacific Generic Anti-cancer Injectables Market Value Share (%), By Segment 3, 2022 & 2029
Figure 76: Asia Pacific Generic Anti-cancer Injectables Market Forecast (USD Billion), by Sub-Segment 1, 2018-2029
Figure 77: Asia Pacific Generic Anti-cancer Injectables Market Forecast (USD Billion), by Sub-Segment 2, 2018-2029
Figure 78: Asia Pacific Generic Anti-cancer Injectables Market Forecast (USD Billion), by Sub-Segment 3, 2018-2029
Figure 79: Asia Pacific Generic Anti-cancer Injectables Market Forecast (USD Billion), by Others, 2018-2029
Figure 80: Asia Pacific Generic Anti-cancer Injectables Market Forecast (USD Billion), by China, 2018-2029
Figure 81: Asia Pacific Generic Anti-cancer Injectables Market Forecast (USD Billion), by India, 2018-2029
Figure 82: Asia Pacific Generic Anti-cancer Injectables Market Forecast (USD Billion), by Japan, 2018-2029
Figure 83: Asia Pacific Generic Anti-cancer Injectables Market Forecast (USD Billion), by Australia, 2018-2029
Figure 84: Asia Pacific Generic Anti-cancer Injectables Market Forecast (USD Billion), by Southeast Asia, 2018-2029
Figure 85: Asia Pacific Generic Anti-cancer Injectables Market Forecast (USD Billion), by Rest of Asia Pacific, 2018-2029
Figure 86: Middle East & Africa Generic Anti-cancer Injectables Market Value Share (%), By Segment 1, 2022 & 2029
Figure 87: Middle East & Africa Generic Anti-cancer Injectables Market Forecast (USD Billion), by Sub-Segment 1, 2018-2029
Figure 88: Middle East & Africa Generic Anti-cancer Injectables Market Forecast (USD Billion), by Sub-Segment 2, 2018-2029
Figure 89: Middle East & Africa Generic Anti-cancer Injectables Market Value Share (%), By Segment 2, 2022 & 2029
Figure 90: Middle East & Africa Generic Anti-cancer Injectables Market Forecast (USD Billion), by Sub-Segment 1, 2018-2029
Figure 91: Middle East & Africa Generic Anti-cancer Injectables Market Forecast (USD Billion), by Sub-Segment 2, 2018-2029
Figure 92: Middle East & Africa Generic Anti-cancer Injectables Market Forecast (USD Billion), by Sub-Segment 3, 2018-2029
Figure 93: Middle East & Africa Generic Anti-cancer Injectables Market Forecast (USD Billion), by Others, 2018-2029
Figure 94: Middle East & Africa Generic Anti-cancer Injectables Market Value Share (%), By Segment 3, 2022 & 2029
Figure 95: Middle East & Africa Generic Anti-cancer Injectables Market Forecast (USD Billion), by Sub-Segment 1, 2018-2029
Figure 96: Middle East & Africa Generic Anti-cancer Injectables Market Forecast (USD Billion), by Sub-Segment 2, 2018-2029
Figure 97: Middle East & Africa Generic Anti-cancer Injectables Market Forecast (USD Billion), by Sub-Segment 3, 2018-2029
Figure 98: Middle East & Africa Generic Anti-cancer Injectables Market Forecast (USD Billion), by Others, 2018-2029
Figure 99: Middle East & Africa Generic Anti-cancer Injectables Market Forecast (USD Billion), by GCC, 2018-2029
Figure 100: Middle East & Africa Generic Anti-cancer Injectables Market Forecast (USD Billion), by South Africa, 2018-2029
Figure 101: Middle East & Africa Generic Anti-cancer Injectables Market Forecast (USD Billion), by Rest of Middle East & Africa, 2018-2029
List of Tables
Table 1: Global Generic Anti-cancer Injectables Market Revenue (USD Billion) Forecast, by Segment 1, 2018-2029
Table 2: Global Generic Anti-cancer Injectables Market Revenue (USD Billion) Forecast, by Segment 2, 2018-2029
Table 3: Global Generic Anti-cancer Injectables Market Revenue (USD Billion) Forecast, by Segment 3, 2018-2029
Table 4: Global Generic Anti-cancer Injectables Market Revenue (USD Billion) Forecast, by Region, 2018-2029
Table 5: North America Generic Anti-cancer Injectables Market Revenue (USD Billion) Forecast, by Segment 1, 2018-2029
Table 6: North America Generic Anti-cancer Injectables Market Revenue (USD Billion) Forecast, by Segment 2, 2018-2029
Table 7: North America Generic Anti-cancer Injectables Market Revenue (USD Billion) Forecast, by Segment 3, 2018-2029
Table 8: North America Generic Anti-cancer Injectables Market Revenue (USD Billion) Forecast, by Country, 2018-2029
Table 9: Europe Generic Anti-cancer Injectables Market Revenue (USD Billion) Forecast, by Segment 1, 2018-2029
Table 10: Europe Generic Anti-cancer Injectables Market Revenue (USD Billion) Forecast, by Segment 2, 2018-2029
Table 11: Europe Generic Anti-cancer Injectables Market Revenue (USD Billion) Forecast, by Segment 3, 2018-2029
Table 12: Europe Generic Anti-cancer Injectables Market Revenue (USD Billion) Forecast, by Country, 2018-2029
Table 13: Latin America Generic Anti-cancer Injectables Market Revenue (USD Billion) Forecast, by Segment 1, 2018-2029
Table 14: Latin America Generic Anti-cancer Injectables Market Revenue (USD Billion) Forecast, by Segment 2, 2018-2029
Table 15: Latin America Generic Anti-cancer Injectables Market Revenue (USD Billion) Forecast, by Segment 3, 2018-2029
Table 16: Latin America Generic Anti-cancer Injectables Market Revenue (USD Billion) Forecast, by Country, 2018-2029
Table 17: Asia Pacific Generic Anti-cancer Injectables Market Revenue (USD Billion) Forecast, by Segment 1, 2018-2029
Table 18: Asia Pacific Generic Anti-cancer Injectables Market Revenue (USD Billion) Forecast, by Segment 2, 2018-2029
Table 19: Asia Pacific Generic Anti-cancer Injectables Market Revenue (USD Billion) Forecast, by Segment 3, 2018-2029
Table 20: Asia Pacific Generic Anti-cancer Injectables Market Revenue (USD Billion) Forecast, by Country, 2018-2029
Table 21: Middle East & Africa Generic Anti-cancer Injectables Market Revenue (USD Billion) Forecast, by Segment 1, 2018-2029
Table 22: Middle East & Africa Generic Anti-cancer Injectables Market Revenue (USD Billion) Forecast, by Segment 2, 2018-2029
Table 23: Middle East & Africa Generic Anti-cancer Injectables Market Revenue (USD Billion) Forecast, by Segment 3, 2018-2029
Table 24: Middle East & Africa Generic Anti-cancer Injectables Market Revenue (USD Billion) Forecast, by Country, 2018-2029
Research Process
Data Library Research are conducted by industry experts who offer insight on
industry structure, market segmentations technology assessment and competitive landscape (CL), and penetration, as well as on emerging trends. Their analysis is based on primary interviews (~ 80%) and secondary research (~ 20%) as well as years of professional expertise in their respective industries. Adding to this, by analysing historical trends and current market positions, our analysts predict where the market will be headed for the next five years. Furthermore, the varying trends of segment & categories geographically presented are also studied and the estimated based on the primary & secondary research.
In this particular report from the supply side Data Library Research has conducted primary surveys (interviews) with the key level executives (VP, CEO’s, Marketing Director, Business Development Manager
and SOFT) of the companies that active & prominent as well as the midsized organization
FIGURE 1: DLR RESEARH PROCESS
![research-methodology1]()
Primary Research
Extensive primary research was conducted to gain a deeper insight of the market and industry performance. The analysis is based on both primary and secondary research as well as years of professional expertise in the respective industries.
In addition to analysing current and historical trends, our analysts predict where the market is headed over the next five years.
It varies by segment for these categories geographically presented in the list of market tables. Speaking about this particular report we have conducted primary surveys (interviews) with the key level executives (VP, CEO’s, Marketing Director, Business Development Manager and many more) of the major players active in the market.
Secondary Research
Secondary research was mainly used to collect and identify information useful for the extensive, technical, market-oriented, and Friend’s study of the Global Extra Neutral Alcohol. It was also used to obtain key information about major players, market classification and segmentation according to the industry trends, geographical markets, and developments related to the market and technology perspectives. For this study, analysts have gathered information from various credible sources, such as annual reports, sec filings, journals, white papers, SOFT presentations, and company web sites.
Market Size Estimation
Both, top-down and bottom-up approaches were used to estimate and validate the size of the Global market and to estimate the size of various other dependent submarkets in the overall Extra Neutral Alcohol. The key players in the market were identified through secondary research and their market contributions in the respective geographies were determined through primary and secondary research.
Forecast Model
![research-methodology2]()