Geotechnical Engineering And Design Software Market Overview and Analysis
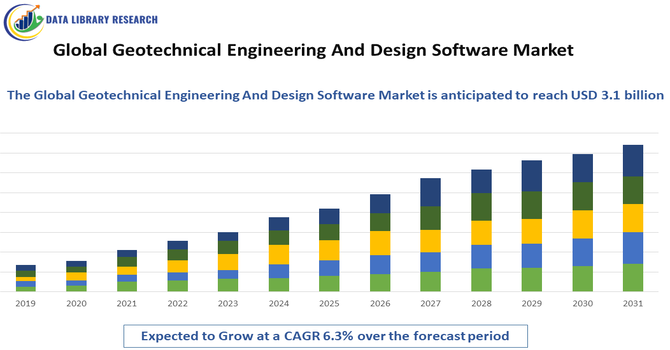
The Global Geotechnical Engineering and Design Software Market size was estimated at USD 2.57 billion in 2023 and is estimated to grow at a CAGR of 6.3% from 2024 to 2030.
Get Complete Analysis Of The Report - Download Updated Free Sample PDF
The Global Geotechnical Engineering and Design Software Market includes specialized software solutions used to analyze soil, rock, groundwater, and foundation conditions for infrastructure projects such as buildings, roads, tunnels, dams, and retaining walls. These tools support geotechnical modeling, slope stability, settlement analysis, foundation design, and seismic evaluation, enabling engineers to simulate complex subsurface behavior and optimize design decisions. Market growth is driven by expanding construction activities, urbanization, and rising demand for safer, cost-effective, and sustainable infrastructure.
Geotechnical Engineering And Design Software Market Latest Trends
The geotechnical engineering and design software market is evolving rapidly with increasing adoption of BIM integration, cloud-based platforms, and AI-driven analytics. Engineers are shifting from traditional manual calculations to advanced 3D modeling and simulation tools that provide more accurate subsurface analysis, slope stability assessment, and foundation design. Demand is growing for software that supports real-time collaboration, project data management, and automated reporting. Additionally, the rise of smart city projects and infrastructure modernization programs is driving investment in geotechnical solutions.
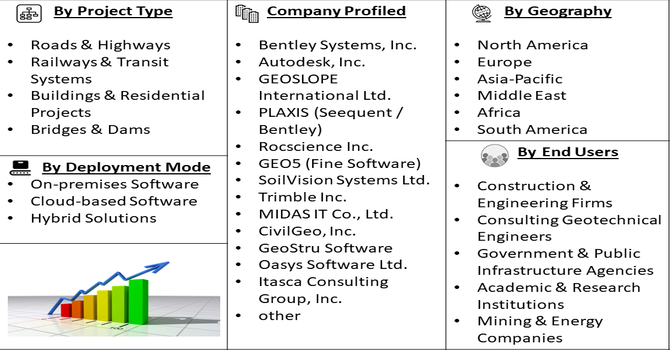
Segmentation: The Global Geotechnical Engineering and Design Software Market is segmented by Software Type (Slope Stability & Landslide Analysis Software, Foundation Design Software, Soil & Rock Mechanics Software, Seepage & Groundwater Modeling Software, Retaining Wall Design Software, Tunnel & Underground Design Software, Pile & Deep Foundation Analysis Software and Earthquake & Seismic Analysis Software), Deployment Mode (On-premises Software, Cloud-based Software and Hybrid Solutions), Project Type (Roads & Highways, Railways & Transit Systems, Buildings & Residential Projects, Bridges & Dams, Tunnels & Underground Structures, Ports & Marine Infrastructure and Mining & Energy Infrastructure), End Users (Construction & Engineering Firms, Consulting Geotechnical Engineers, Government & Public Infrastructure Agencies, Academic & Research Institutions, and Mining & Energy Companies), and Geography (North America, Europe, Asia-Pacific, Middle East and Africa, and South America). The report provides the value (in USD million) for the above segments.
For Detailed Market Segmentation - Get a Free Sample PDF
Market Drivers:
- Rapid Infrastructure Development and Urbanization
Global infrastructure expansion and rapid urbanization have significantly increased demand for geotechnical engineering software. As governments and private sectors invest in roads, bridges, tunnels, railways, and urban development projects, accurate subsurface analysis becomes essential to ensure safety, cost efficiency, and long-term stability.
In 2025, Topcon Positioning Systems and Amberg Technologies’ collaboration to launch integrated rail and tunnel solutions enhanced interoperability between hardware and software platforms. Announced at INTERGEO 2025, this development strengthened the global geotechnical engineering and design software market by improving data accuracy, workflow efficiency, and digital integration for complex underground infrastructure projects, increasing reliance on advanced geotechnical modeling and design solutions worldwide. The need to complete projects faster with minimal risk has driven widespread adoption of advanced simulation tools, especially in developing economies where infrastructure growth is fastest.
- Adoption of BIM, Digital Twins, and Advanced Analytics
The integration of Building Information Modeling (BIM), digital twin technology, and AI-based analytics has transformed geotechnical design processes. Modern software platforms now support 3D modeling, real-time collaboration, and predictive analytics, enabling engineers to visualize complex underground conditions and optimize design decisions. Digital twins allow continuous monitoring and simulation of infrastructure performance under varying conditions, improving safety and reducing maintenance costs. As construction projects become more complex and data-driven, the demand for advanced geotechnical software with seamless BIM integration and cloud-based collaboration has surged, driving market growth globally.
Market Restraints:
- High Implementation Costs and Limited Technical Expertise
Despite growing demand, the market faces challenges due to high software costs and limited technical expertise among engineering teams. Advanced geotechnical software often requires significant investment in licenses, training, and computational resources, which can be prohibitive for small firms and projects in developing regions. Additionally, effective use of these tools demands skilled geotechnical engineers with specialized training in numerical modeling and interpretation of complex results. This skill gap leads to underutilization of software capabilities and slower adoption. As a result, cost barriers and shortage of qualified professionals constrain market growth, especially in cost-sensitive markets.
Socioeconomic Impact on Geotechnical Engineering And Design Software Market
Geotechnical engineering software has a significant socioeconomic impact by improving infrastructure safety, reducing construction risks, and lowering project costs. Accurate subsurface modeling helps prevent structural failures, landslides, and foundation issues, protecting communities and reducing long-term maintenance expenses. As urbanization accelerates, reliable geotechnical analysis supports sustainable land use and resilient infrastructure development. The software also boosts productivity in engineering firms, enabling faster project delivery and better resource allocation. Furthermore, it contributes to workforce skill development, as engineers adopt digital tools and advanced simulation techniques, enhancing employment opportunities and supporting growth in construction and civil engineering sectors worldwide.
Segmental Analysis:
- Seepage & Groundwater Modeling Software segment is expected to witness highest growth over the forecast period
The seepage and groundwater modeling software segment was projected to grow fastest due to increasing concerns about water management, climate change, and sustainable infrastructure. As urbanization expands, accurate modeling of groundwater flow, seepage through embankments, and groundwater-induced instability becomes critical for safe construction. Infrastructure projects such as tunnels, dams, landfills, and underground structures require advanced seepage analysis to prevent waterlogging, erosion, and structural failure. Rising regulatory emphasis on environmental impact assessments and water resource protection also increased demand for specialized modeling tools. Consequently, the need for precise groundwater simulation and risk mitigation drove strong growth in this segment.
- Cloud-based Software segment is expected to witness highest growth over the forecast period
The cloud-based software segment was expected to witness the highest growth due to increasing demand for remote collaboration, data accessibility, and scalable computing resources. Cloud deployment enables engineering teams to access geotechnical models, share project data, and perform simulations from any location, supporting global and multi-disciplinary projects. It also reduces upfront IT investment and simplifies software updates, making advanced tools more affordable for small and medium firms. As construction projects increasingly rely on real-time data sharing and integrated workflows, cloud-based platforms provided enhanced flexibility and efficiency, driving faster adoption and growth compared to traditional on-premises solutions.
- Buildings & Residential Projects segment is expected to witness highest growth over the forecast period
The buildings and residential projects segment was projected to experience the fastest growth due to rapid urban population expansion and rising housing demand worldwide. Residential and commercial building developments require detailed geotechnical assessments to ensure safe foundation design, soil settlement prediction, and slope stability in urban settings. As cities expand vertically and in dense environments, accurate subsurface analysis becomes essential to avoid structural issues and costly rework. Additionally, the trend toward high-rise constructions in emerging economies further increased the need for advanced geotechnical software. This surge in building projects drove strong demand for software solutions tailored to foundation and soil analysis.
- Construction & Engineering Firms segment is expected to witness highest growth over the forecast period
The construction and engineering firms segment was expected to grow fastest as these organizations increasingly adopted geotechnical software to improve project efficiency and reduce risks. Firms engaged in large-scale infrastructure and building projects rely on advanced modeling tools for soil analysis, foundation design, and slope stability assessment. The need to deliver projects faster, comply with regulations, and minimize cost overruns led to higher investments in digital design and simulation platforms. Additionally, engineering firms increasingly collaborated with multidisciplinary teams and required integrated workflows, boosting demand for software that supports data sharing, BIM integration, and automated reporting. This drove robust growth in this end-user segment.
- North American Region is expected to witness highest growth over the forecast period
North America was expected to lead growth due to strong infrastructure investment, stringent regulatory standards, and high adoption of advanced engineering technologies. The U.S. and Canada have large construction and civil engineering markets, with significant spending on roads, bridges, tunnels, and urban redevelopment projects.
In 2023, The expansion of U.S. offshore wind energy testing capabilities by researchers at Lehigh University, Clemson University, and Oregon State University supported the advancement of next-generation wind systems. This development increased demand for geotechnical engineering and design software in North America, as hybrid physical and virtual testing required advanced soil modeling, foundation analysis, and simulation tools for offshore and coastal infrastructure projects.
Adoption of BIM, digital twins, and cloud-based geotechnical software is high, driven by demand for improved project efficiency and risk management. Furthermore, the region’s established engineering consultancies and technology providers accelerated software innovation and adoption. These factors combined to position North America as the fastest-growing region in the geotechnical engineering and design software market during the forecast period.
| Report Matrics |
Details |
| Market Size Value |
USD 3.1 billion |
| Growth Rate |
CAGR of 6.3% |
| Forecast |
2026-2033 |
| Historical data |
2021-2024 |
| Base Year |
2025 |
| Report Coverage |
Forecasted revenue, company rating, competitive environment, growth drivers, and trends |
| Segment Coverage |
Type, Application, End-User, Geography |
| Regional Scope |
North America, Europe, Asia Pacific, Middle East |
| Customized scope |
Free customization of reports (With 3 months Analysis Support ) |
| To Learn More About This Report |
Request a Free Sample Copy |
Geotechnical Engineering And Design Software Market Competitive Landscape
The competitive landscape is dominated by established software providers and engineering technology firms offering comprehensive geotechnical solutions, often bundled with structural, civil, and BIM platforms. Key players compete through continuous innovation, integration capabilities, and customer support services. Partnerships and acquisitions are common as companies expand product portfolios and geographic reach. Differentiation focuses on usability, simulation accuracy, cloud deployment, and advanced analytics, with vendors investing in AI and machine learning to improve predictive modeling. Subscription-based pricing and modular software suites are becoming more popular, enabling scalable adoption by small firms and large enterprises alike. This competitive environment drives ongoing product enhancements and market expansion.
The major players for above market are:
- Bentley Systems, Inc.
- Autodesk, Inc.
- GEOSLOPE International Ltd.
- PLAXIS (Seequent / Bentley)
- Rocscience Inc.
- GEO5 (Fine Software)
- SoilVision Systems Ltd.
- Trimble Inc.
- MIDAS IT Co., Ltd.
- CivilGeo, Inc.
- GeoStru Software
- Oasys Software Ltd.
- Itasca Consulting Group, Inc.
- Fugro N.V.
- Carlson Software Inc.
- GRAITEC Group
- RISA Technologies
- GEOSTRU S.r.l.
- GeoStudio (Seequent)
Recent Development
- In September 2025, NEC Corporation’s announcement to conduct a proof of concept for an Earthquake Early Warning System in Colombia highlighted growing global emphasis on seismic risk mitigation. This initiative reinforced demand for advanced geotechnical engineering and design software, as engineers increasingly relied on seismic modeling, ground analysis, and integrated digital tools to support earthquake preparedness, infrastructure resilience, and data-driven design decisions across international construction and infrastructure projects.
- In September 2025, Jacobs’ selection to support the design and management of Denmark’s Marselis Tunnel under Infrastructure Plan 2035 highlighted rising demand for advanced geotechnical engineering and design software. The complex, high-density urban tunnel project required precise subsurface modeling, risk assessment, and integrated digital design tools, reinforcing the market’s role in enabling optimized tunnel design, construction management, and long-term infrastructure resilience globally.
Frequently Asked Questions (FAQ) :
Q1. What are the main growth-driving factors for this market?
The market is driven by increasing global infrastructure development and the adoption of Building Information Modeling (BIM). Rising demand for sophisticated site investigation and disaster mitigation, such as landslide and earthquake analysis, fuels growth. Additionally, the shift from traditional 2D drafting to advanced 3D numerical modeling enhances accuracy in complex projects.
Q2. What are the main restraining factors for this market?
High initial licensing costs and the steep learning curve for specialized software remain significant barriers. Many small engineering firms struggle with the investment required for advanced simulation tools. Furthermore, data interoperability issues between different software platforms and a shortage of skilled professionals trained in high-end geotechnical modeling can hinder market expansion.
Q3. Which segment is expected to witness high growth?
The cloud-based software segment is expected to witness the highest growth. Cloud solutions offer superior collaboration capabilities, allowing real-time data sharing between site engineers and office-based designers. The scalability and subscription-based "SaaS" models make advanced geotechnical analysis more accessible and cost-effective for firms of all sizes compared to on-premise installations.
Q4. Who are the top major players for this market?
The market features several dominant technical software providers, including Bentley Systems (with its Seequent and Plaxis brands), Dassault Systèmes, and Autodesk. Other influential players include Rocscience, Itasca International, and Ensoft. These companies lead through continuous innovation in soil-structure interaction, slope stability analysis, and deep foundation design simulation technologies.
Q5. Which country is the largest player?
The United States is the largest player in this market. Its dominance is underpinned by a massive focus on upgrading aging infrastructure and strict building safety regulations. The presence of leading software developers and a high concentration of large-scale civil engineering projects involving complex underground construction further solidify its market position.
List of Figures
Figure 1: Global Geotechnical Engineering And Design Software Market Revenue Breakdown (USD Billion, %) by Region, 2022 & 2029
Figure 2: Global Geotechnical Engineering And Design Software Market Value Share (%), By Segment 1, 2022 & 2029
Figure 3: Global Geotechnical Engineering And Design Software Market Forecast (USD Billion), by Sub-Segment 1, 2018-2029
Figure 4: Global Geotechnical Engineering And Design Software Market Forecast (USD Billion), by Sub-Segment 2, 2018-2029
Figure 5: Global Geotechnical Engineering And Design Software Market Value Share (%), By Segment 2, 2022 & 2029
Figure 6: Global Geotechnical Engineering And Design Software Market Forecast (USD Billion), by Sub-Segment 1, 2018-2029
Figure 7: Global Geotechnical Engineering And Design Software Market Forecast (USD Billion), by Sub-Segment 2, 2018-2029
Figure 8: Global Geotechnical Engineering And Design Software Market Forecast (USD Billion), by Sub-Segment 3, 2018-2029
Figure 9: Global Geotechnical Engineering And Design Software Market Forecast (USD Billion), by Others, 2018-2029
Figure 10: Global Geotechnical Engineering And Design Software Market Value Share (%), By Segment 3, 2022 & 2029
Figure 11: Global Geotechnical Engineering And Design Software Market Forecast (USD Billion), by Sub-Segment 1, 2018-2029
Figure 12: Global Geotechnical Engineering And Design Software Market Forecast (USD Billion), by Sub-Segment 2, 2018-2029
Figure 13: Global Geotechnical Engineering And Design Software Market Forecast (USD Billion), by Sub-Segment 3, 2018-2029
Figure 14: Global Geotechnical Engineering And Design Software Market Forecast (USD Billion), by Others, 2018-2029
Figure 15: Global Geotechnical Engineering And Design Software Market Value (USD Billion), by Region, 2022 & 2029
Figure 16: North America Geotechnical Engineering And Design Software Market Value Share (%), By Segment 1, 2022 & 2029
Figure 17: North America Geotechnical Engineering And Design Software Market Forecast (USD Billion), by Sub-Segment 1, 2018-2029
Figure 18: North America Geotechnical Engineering And Design Software Market Forecast (USD Billion), by Sub-Segment 2, 2018-2029
Figure 19: North America Geotechnical Engineering And Design Software Market Value Share (%), By Segment 2, 2022 & 2029
Figure 20: North America Geotechnical Engineering And Design Software Market Forecast (USD Billion), by Sub-Segment 1, 2018-2029
Figure 21: North America Geotechnical Engineering And Design Software Market Forecast (USD Billion), by Sub-Segment 2, 2018-2029
Figure 22: North America Geotechnical Engineering And Design Software Market Forecast (USD Billion), by Sub-Segment 3, 2018-2029
Figure 23: North America Geotechnical Engineering And Design Software Market Forecast (USD Billion), by Others, 2018-2029
Figure 24: North America Geotechnical Engineering And Design Software Market Value Share (%), By Segment 3, 2022 & 2029
Figure 25: North America Geotechnical Engineering And Design Software Market Forecast (USD Billion), by Sub-Segment 1, 2018-2029
Figure 26: North America Geotechnical Engineering And Design Software Market Forecast (USD Billion), by Sub-Segment 2, 2018-2029
Figure 27: North America Geotechnical Engineering And Design Software Market Forecast (USD Billion), by Sub-Segment 3, 2018-2029
Figure 28: North America Geotechnical Engineering And Design Software Market Forecast (USD Billion), by Others, 2018-2029
Figure 29: North America Geotechnical Engineering And Design Software Market Forecast (USD Billion), by U.S., 2018-2029
Figure 30: North America Geotechnical Engineering And Design Software Market Forecast (USD Billion), by Canada, 2018-2029
Figure 31: Latin America Geotechnical Engineering And Design Software Market Value Share (%), By Segment 1, 2022 & 2029
Figure 32: Latin America Geotechnical Engineering And Design Software Market Forecast (USD Billion), by Sub-Segment 1, 2018-2029
Figure 33: Latin America Geotechnical Engineering And Design Software Market Forecast (USD Billion), by Sub-Segment 2, 2018-2029
Figure 34: Latin America Geotechnical Engineering And Design Software Market Value Share (%), By Segment 2, 2022 & 2029
Figure 35: Latin America Geotechnical Engineering And Design Software Market Forecast (USD Billion), by Sub-Segment 1, 2018-2029
Figure 36: Latin America Geotechnical Engineering And Design Software Market Forecast (USD Billion), by Sub-Segment 2, 2018-2029
Figure 37: Latin America Geotechnical Engineering And Design Software Market Forecast (USD Billion), by Sub-Segment 3, 2018-2029
Figure 38: Latin America Geotechnical Engineering And Design Software Market Forecast (USD Billion), by Others, 2018-2029
Figure 39: Latin America Geotechnical Engineering And Design Software Market Value Share (%), By Segment 3, 2022 & 2029
Figure 40: Latin America Geotechnical Engineering And Design Software Market Forecast (USD Billion), by Sub-Segment 1, 2018-2029
Figure 41: Latin America Geotechnical Engineering And Design Software Market Forecast (USD Billion), by Sub-Segment 2, 2018-2029
Figure 42: Latin America Geotechnical Engineering And Design Software Market Forecast (USD Billion), by Sub-Segment 3, 2018-2029
Figure 43: Latin America Geotechnical Engineering And Design Software Market Forecast (USD Billion), by Others, 2018-2029
Figure 44: Latin America Geotechnical Engineering And Design Software Market Forecast (USD Billion), by Brazil, 2018-2029
Figure 45: Latin America Geotechnical Engineering And Design Software Market Forecast (USD Billion), by Mexico, 2018-2029
Figure 46: Latin America Geotechnical Engineering And Design Software Market Forecast (USD Billion), by Rest of Latin America, 2018-2029
Figure 47: Europe Geotechnical Engineering And Design Software Market Value Share (%), By Segment 1, 2022 & 2029
Figure 48: Europe Geotechnical Engineering And Design Software Market Forecast (USD Billion), by Sub-Segment 1, 2018-2029
Figure 49: Europe Geotechnical Engineering And Design Software Market Forecast (USD Billion), by Sub-Segment 2, 2018-2029
Figure 50: Europe Geotechnical Engineering And Design Software Market Value Share (%), By Segment 2, 2022 & 2029
Figure 51: Europe Geotechnical Engineering And Design Software Market Forecast (USD Billion), by Sub-Segment 1, 2018-2029
Figure 52: Europe Geotechnical Engineering And Design Software Market Forecast (USD Billion), by Sub-Segment 2, 2018-2029
Figure 53: Europe Geotechnical Engineering And Design Software Market Forecast (USD Billion), by Sub-Segment 3, 2018-2029
Figure 54: Europe Geotechnical Engineering And Design Software Market Forecast (USD Billion), by Others, 2018-2029
Figure 55: Europe Geotechnical Engineering And Design Software Market Value Share (%), By Segment 3, 2022 & 2029
Figure 56: Europe Geotechnical Engineering And Design Software Market Forecast (USD Billion), by Sub-Segment 1, 2018-2029
Figure 57: Europe Geotechnical Engineering And Design Software Market Forecast (USD Billion), by Sub-Segment 2, 2018-2029
Figure 58: Europe Geotechnical Engineering And Design Software Market Forecast (USD Billion), by Sub-Segment 3, 2018-2029
Figure 59: Europe Geotechnical Engineering And Design Software Market Forecast (USD Billion), by Others, 2018-2029
Figure 60: Europe Geotechnical Engineering And Design Software Market Forecast (USD Billion), by U.K., 2018-2029
Figure 61: Europe Geotechnical Engineering And Design Software Market Forecast (USD Billion), by Germany, 2018-2029
Figure 62: Europe Geotechnical Engineering And Design Software Market Forecast (USD Billion), by France, 2018-2029
Figure 63: Europe Geotechnical Engineering And Design Software Market Forecast (USD Billion), by Italy, 2018-2029
Figure 64: Europe Geotechnical Engineering And Design Software Market Forecast (USD Billion), by Spain, 2018-2029
Figure 65: Europe Geotechnical Engineering And Design Software Market Forecast (USD Billion), by Russia, 2018-2029
Figure 66: Europe Geotechnical Engineering And Design Software Market Forecast (USD Billion), by Rest of Europe, 2018-2029
Figure 67: Asia Pacific Geotechnical Engineering And Design Software Market Value Share (%), By Segment 1, 2022 & 2029
Figure 68: Asia Pacific Geotechnical Engineering And Design Software Market Forecast (USD Billion), by Sub-Segment 1, 2018-2029
Figure 69: Asia Pacific Geotechnical Engineering And Design Software Market Forecast (USD Billion), by Sub-Segment 2, 2018-2029
Figure 70: Asia Pacific Geotechnical Engineering And Design Software Market Value Share (%), By Segment 2, 2022 & 2029
Figure 71: Asia Pacific Geotechnical Engineering And Design Software Market Forecast (USD Billion), by Sub-Segment 1, 2018-2029
Figure 72: Asia Pacific Geotechnical Engineering And Design Software Market Forecast (USD Billion), by Sub-Segment 2, 2018-2029
Figure 73: Asia Pacific Geotechnical Engineering And Design Software Market Forecast (USD Billion), by Sub-Segment 3, 2018-2029
Figure 74: Asia Pacific Geotechnical Engineering And Design Software Market Forecast (USD Billion), by Others, 2018-2029
Figure 75: Asia Pacific Geotechnical Engineering And Design Software Market Value Share (%), By Segment 3, 2022 & 2029
Figure 76: Asia Pacific Geotechnical Engineering And Design Software Market Forecast (USD Billion), by Sub-Segment 1, 2018-2029
Figure 77: Asia Pacific Geotechnical Engineering And Design Software Market Forecast (USD Billion), by Sub-Segment 2, 2018-2029
Figure 78: Asia Pacific Geotechnical Engineering And Design Software Market Forecast (USD Billion), by Sub-Segment 3, 2018-2029
Figure 79: Asia Pacific Geotechnical Engineering And Design Software Market Forecast (USD Billion), by Others, 2018-2029
Figure 80: Asia Pacific Geotechnical Engineering And Design Software Market Forecast (USD Billion), by China, 2018-2029
Figure 81: Asia Pacific Geotechnical Engineering And Design Software Market Forecast (USD Billion), by India, 2018-2029
Figure 82: Asia Pacific Geotechnical Engineering And Design Software Market Forecast (USD Billion), by Japan, 2018-2029
Figure 83: Asia Pacific Geotechnical Engineering And Design Software Market Forecast (USD Billion), by Australia, 2018-2029
Figure 84: Asia Pacific Geotechnical Engineering And Design Software Market Forecast (USD Billion), by Southeast Asia, 2018-2029
Figure 85: Asia Pacific Geotechnical Engineering And Design Software Market Forecast (USD Billion), by Rest of Asia Pacific, 2018-2029
Figure 86: Middle East & Africa Geotechnical Engineering And Design Software Market Value Share (%), By Segment 1, 2022 & 2029
Figure 87: Middle East & Africa Geotechnical Engineering And Design Software Market Forecast (USD Billion), by Sub-Segment 1, 2018-2029
Figure 88: Middle East & Africa Geotechnical Engineering And Design Software Market Forecast (USD Billion), by Sub-Segment 2, 2018-2029
Figure 89: Middle East & Africa Geotechnical Engineering And Design Software Market Value Share (%), By Segment 2, 2022 & 2029
Figure 90: Middle East & Africa Geotechnical Engineering And Design Software Market Forecast (USD Billion), by Sub-Segment 1, 2018-2029
Figure 91: Middle East & Africa Geotechnical Engineering And Design Software Market Forecast (USD Billion), by Sub-Segment 2, 2018-2029
Figure 92: Middle East & Africa Geotechnical Engineering And Design Software Market Forecast (USD Billion), by Sub-Segment 3, 2018-2029
Figure 93: Middle East & Africa Geotechnical Engineering And Design Software Market Forecast (USD Billion), by Others, 2018-2029
Figure 94: Middle East & Africa Geotechnical Engineering And Design Software Market Value Share (%), By Segment 3, 2022 & 2029
Figure 95: Middle East & Africa Geotechnical Engineering And Design Software Market Forecast (USD Billion), by Sub-Segment 1, 2018-2029
Figure 96: Middle East & Africa Geotechnical Engineering And Design Software Market Forecast (USD Billion), by Sub-Segment 2, 2018-2029
Figure 97: Middle East & Africa Geotechnical Engineering And Design Software Market Forecast (USD Billion), by Sub-Segment 3, 2018-2029
Figure 98: Middle East & Africa Geotechnical Engineering And Design Software Market Forecast (USD Billion), by Others, 2018-2029
Figure 99: Middle East & Africa Geotechnical Engineering And Design Software Market Forecast (USD Billion), by GCC, 2018-2029
Figure 100: Middle East & Africa Geotechnical Engineering And Design Software Market Forecast (USD Billion), by South Africa, 2018-2029
Figure 101: Middle East & Africa Geotechnical Engineering And Design Software Market Forecast (USD Billion), by Rest of Middle East & Africa, 2018-2029
List of Tables
Table 1: Global Geotechnical Engineering And Design Software Market Revenue (USD Billion) Forecast, by Segment 1, 2018-2029
Table 2: Global Geotechnical Engineering And Design Software Market Revenue (USD Billion) Forecast, by Segment 2, 2018-2029
Table 3: Global Geotechnical Engineering And Design Software Market Revenue (USD Billion) Forecast, by Segment 3, 2018-2029
Table 4: Global Geotechnical Engineering And Design Software Market Revenue (USD Billion) Forecast, by Region, 2018-2029
Table 5: North America Geotechnical Engineering And Design Software Market Revenue (USD Billion) Forecast, by Segment 1, 2018-2029
Table 6: North America Geotechnical Engineering And Design Software Market Revenue (USD Billion) Forecast, by Segment 2, 2018-2029
Table 7: North America Geotechnical Engineering And Design Software Market Revenue (USD Billion) Forecast, by Segment 3, 2018-2029
Table 8: North America Geotechnical Engineering And Design Software Market Revenue (USD Billion) Forecast, by Country, 2018-2029
Table 9: Europe Geotechnical Engineering And Design Software Market Revenue (USD Billion) Forecast, by Segment 1, 2018-2029
Table 10: Europe Geotechnical Engineering And Design Software Market Revenue (USD Billion) Forecast, by Segment 2, 2018-2029
Table 11: Europe Geotechnical Engineering And Design Software Market Revenue (USD Billion) Forecast, by Segment 3, 2018-2029
Table 12: Europe Geotechnical Engineering And Design Software Market Revenue (USD Billion) Forecast, by Country, 2018-2029
Table 13: Latin America Geotechnical Engineering And Design Software Market Revenue (USD Billion) Forecast, by Segment 1, 2018-2029
Table 14: Latin America Geotechnical Engineering And Design Software Market Revenue (USD Billion) Forecast, by Segment 2, 2018-2029
Table 15: Latin America Geotechnical Engineering And Design Software Market Revenue (USD Billion) Forecast, by Segment 3, 2018-2029
Table 16: Latin America Geotechnical Engineering And Design Software Market Revenue (USD Billion) Forecast, by Country, 2018-2029
Table 17: Asia Pacific Geotechnical Engineering And Design Software Market Revenue (USD Billion) Forecast, by Segment 1, 2018-2029
Table 18: Asia Pacific Geotechnical Engineering And Design Software Market Revenue (USD Billion) Forecast, by Segment 2, 2018-2029
Table 19: Asia Pacific Geotechnical Engineering And Design Software Market Revenue (USD Billion) Forecast, by Segment 3, 2018-2029
Table 20: Asia Pacific Geotechnical Engineering And Design Software Market Revenue (USD Billion) Forecast, by Country, 2018-2029
Table 21: Middle East & Africa Geotechnical Engineering And Design Software Market Revenue (USD Billion) Forecast, by Segment 1, 2018-2029
Table 22: Middle East & Africa Geotechnical Engineering And Design Software Market Revenue (USD Billion) Forecast, by Segment 2, 2018-2029
Table 23: Middle East & Africa Geotechnical Engineering And Design Software Market Revenue (USD Billion) Forecast, by Segment 3, 2018-2029
Table 24: Middle East & Africa Geotechnical Engineering And Design Software Market Revenue (USD Billion) Forecast, by Country, 2018-2029
Research Process
Data Library Research are conducted by industry experts who offer insight on
industry structure, market segmentations technology assessment and competitive landscape (CL), and penetration, as well as on emerging trends. Their analysis is based on primary interviews (~ 80%) and secondary research (~ 20%) as well as years of professional expertise in their respective industries. Adding to this, by analysing historical trends and current market positions, our analysts predict where the market will be headed for the next five years. Furthermore, the varying trends of segment & categories geographically presented are also studied and the estimated based on the primary & secondary research.
In this particular report from the supply side Data Library Research has conducted primary surveys (interviews) with the key level executives (VP, CEO’s, Marketing Director, Business Development Manager
and SOFT) of the companies that active & prominent as well as the midsized organization
FIGURE 1: DLR RESEARH PROCESS
![research-methodology1]()
Primary Research
Extensive primary research was conducted to gain a deeper insight of the market and industry performance. The analysis is based on both primary and secondary research as well as years of professional expertise in the respective industries.
In addition to analysing current and historical trends, our analysts predict where the market is headed over the next five years.
It varies by segment for these categories geographically presented in the list of market tables. Speaking about this particular report we have conducted primary surveys (interviews) with the key level executives (VP, CEO’s, Marketing Director, Business Development Manager and many more) of the major players active in the market.
Secondary Research
Secondary research was mainly used to collect and identify information useful for the extensive, technical, market-oriented, and Friend’s study of the Global Extra Neutral Alcohol. It was also used to obtain key information about major players, market classification and segmentation according to the industry trends, geographical markets, and developments related to the market and technology perspectives. For this study, analysts have gathered information from various credible sources, such as annual reports, sec filings, journals, white papers, SOFT presentations, and company web sites.
Market Size Estimation
Both, top-down and bottom-up approaches were used to estimate and validate the size of the Global market and to estimate the size of various other dependent submarkets in the overall Extra Neutral Alcohol. The key players in the market were identified through secondary research and their market contributions in the respective geographies were determined through primary and secondary research.
Forecast Model
![research-methodology2]()