Fiberglass Fabric Market Overview
The global Fiberglass Fabric Market size was standing at USD 10.20 Billion in 2023 and is estimated to stand at USD 20.69 Billion by 2030, registering a CAGR of 7.1% from 2023 to 2030.
The demand for fiberglass fabric in the global market has been expanding as a result of the necessity to provide seamless improvements in a variety of end-use industries. Fiberglass has unusual chemical and physical qualities, which has contributed to its appeal. Furthermore, the vast range of industries that use fiberglass fabric for a variety of applications has aided in the market's expansion. The use of fiberglass cloth in the production of lightweight industrial materials has opened up new business opportunities.
In addition, the necessity for better industrial process control has propelled demand in the global fiberglass fabric market. In recent years, the lightweight of fiberglass fabric has played a significant influence in the expansion of the global market for fiberglass fabric. Other features that have made fiberglass fabric popular around the world are corrosion resistance and thermal insulation. It's worth noting that the market for fiberglass fabric has been there for decades and continues to be in high demand. Because of the aforementioned facts, it is possible to predict that the global fiberglass fabric market will generate massive profits in the coming years.
| Report Metric |
Details |
| Market size available for years |
2023–2030 |
| Base year considered |
2023 |
| Forecast period |
2024–2030 |
| Forecast unit |
Value (USD Million) |
| Segments covered |
Fabric Type, Application, and Region. |
| Regions covered |
North America (the U.S. and Canada), Europe (UK, Germany, France, Italy, Spain, Russia, Rest of Europe), Asia-Pacific (China, India, Japan, Australia, South East Asia, Rest of Asia Pacific), Latin America and the Middle East and Africa (Brazil, Saudi Arabia, UAE, Rest of LAMEA) |
| Companies covered |
Colan Australia, Atlanta Fiberglass, and Amatex Corporation. |
Covid-19 Impact on Fiberglass Fabric Market
The ongoing COVID-19 pandemic conditions have severely affected every sector around the world. Whereas, the chemicals and materials sectors were moderately affected during the pandemic. This is primarily due to the uncut demand for chemicals for healthcare, life science, and cleaning agents. However, other elements of chemical and material sectors such as paints, industrial oil, construction materials are facing diminution in demand. Strict lockdown resulted in a nearly 50-60% reduction in supply for raw materials, which directly affected the manufacturing process. Further, halt on many end-use industries directly affected the chemical demand all around the world.
Fiberglass Fabric Market Segment Overview
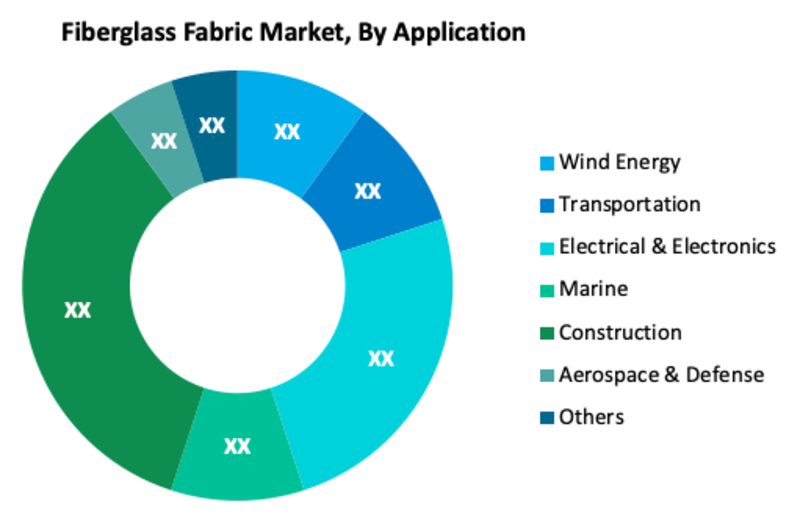
According to Application, Construction is the most prominent segment in the global Fiberglass Fabric Market. Moreover, Electrical & Electronics is another main segment in the global market. The global market for fiberglass fabric has been growing as a result of developments in a number of important end-use industries. In recent years, the construction industry has emerged as the most active user of fiberglass fabric, which has boosted market expansion. Over the last decade, several new development projects have begun in economically successful regions. In addition, over the last few years, the electrical and electronics industry has seen a large inflow of revenue. Because fiberglass fabric is such an important component in the production of electronic products, demand for it is likely to skyrocket.
Fiberglass Fabric Market, By Fabric Type
· Woven
· Non-woven
Fiberglass Fabric Market, By Application
· Wind Energy
· Transportation
· Electrical & Electronics
· Marine
· Construction
· Aerospace & Defense
· Others
Fiberglass Fabric Market Regional Overview
In terms of geography, the global Fiberglass Fabric market is classified into North America, Europe, Asia Pacific, South America, Middle East & Africa. North America's fiberglass fabric market has outperformed all other geographical divisions in terms of growth potential. This is due to the booming construction industry in both Canada and the United States. Furthermore, due to improvements in the industrial sector in China and India, the market for fiberglass fabric in the Asia Pacific is growing at a breakneck speed.
Fiberglass Fabric Market, By Geography
· North America (US & Canada)
· Europe (UK, Germany, France, Italy, Spain, Russia & Rest of Europe)
· Asia-Pacific (Japan, China, India, Australia, & South Korea, & Rest of Asia-Pacific)
· LAMEA (Brazil, Saudi Arabia, UAE & Rest of LAMEA)
Fiberglass Fabric Market, Key Players
· Colan Australia
· Atlanta Fiberglass
· Amatex Corporation
· Fabric Type, Application
. Hangzhou Mingda Glass Finbre Co. Ltd
. Xiangyang Huierjie Glassfibre
Frequently Asked Questions (FAQ) :
Q1. What are the driving factors for the global Fiberglass Fabric market?
The demand for fiberglass fabric in the global market has been expanding as a result of the necessity to provide seamless improvements in a variety of end-use industries.
Q2. Which Segments are covered in the global Fiberglass Fabric market report?
Fabric Type, Application, and Region. these segments are covered in the global Fiberglass Fabric market report.
Q3. Which segment is projected to hold the largest share in the global Fiberglass Fabric market?
The construction segment is projected to hold the largest share in the global Fiberglass Fabric market.
Q4. Which region holds the largest share in the global Fiberglass Fabric market?
North America holds the largest share in the global Fiberglass Fabric market
Q5. Which are the prominent players in the global Fiberglass Fabric market?
Colan Australia, Atlanta Fiberglass, and Amatex Corporation. are some key players in the global Fiberglass Fabric market
List of Figures
Figure 1: Global Fiberglass Fabric Market Revenue Breakdown (USD Billion, %) by Region, 2021 & 2030
Figure 2: Global Fiberglass Fabric Market Value Share (%), By Segment 1, 2021 & 2030
Figure 3: Global Fiberglass Fabric Market Forecast (USD Billion), by Sub-Segment 1, 2018-2030
Figure 4: Global Fiberglass Fabric Market Forecast (USD Billion), by Sub-Segment 2, 2018-2030
Figure 5: Global Fiberglass Fabric Market Value Share (%), By Segment 2, 2021 & 2030
Figure 6: Global Fiberglass Fabric Market Forecast (USD Billion), by Sub-Segment 1, 2018-2030
Figure 7: Global Fiberglass Fabric Market Forecast (USD Billion), by Sub-Segment 2, 2018-2030
Figure 8: Global Fiberglass Fabric Market Forecast (USD Billion), by Sub-Segment 3, 2018-2030
Figure 9: Global Fiberglass Fabric Market Forecast (USD Billion), by Others, 2018-2030
Figure 10: Global Fiberglass Fabric Market Value Share (%), By Segment 3, 2021 & 2030
Figure 11: Global Fiberglass Fabric Market Forecast (USD Billion), by Sub-Segment 1, 2018-2030
Figure 12: Global Fiberglass Fabric Market Forecast (USD Billion), by Sub-Segment 2, 2018-2030
Figure 13: Global Fiberglass Fabric Market Forecast (USD Billion), by Sub-Segment 3, 2018-2030
Figure 14: Global Fiberglass Fabric Market Forecast (USD Billion), by Others, 2018-2030
Figure 15: Global Fiberglass Fabric Market Value (USD Billion), by Region, 2021 & 2030
Figure 16: North America Fiberglass Fabric Market Value Share (%), By Segment 1, 2021 & 2030
Figure 17: North America Fiberglass Fabric Market Forecast (USD Billion), by Sub-Segment 1, 2018-2030
Figure 18: North America Fiberglass Fabric Market Forecast (USD Billion), by Sub-Segment 2, 2018-2030
Figure 19: North America Fiberglass Fabric Market Value Share (%), By Segment 2, 2021 & 2030
Figure 20: North America Fiberglass Fabric Market Forecast (USD Billion), by Sub-Segment 1, 2018-2030
Figure 21: North America Fiberglass Fabric Market Forecast (USD Billion), by Sub-Segment 2, 2018-2030
Figure 22: North America Fiberglass Fabric Market Forecast (USD Billion), by Sub-Segment 3, 2018-2030
Figure 23: North America Fiberglass Fabric Market Forecast (USD Billion), by Others, 2018-2030
Figure 24: North America Fiberglass Fabric Market Value Share (%), By Segment 3, 2021 & 2030
Figure 25: North America Fiberglass Fabric Market Forecast (USD Billion), by Sub-Segment 1, 2018-2030
Figure 26: North America Fiberglass Fabric Market Forecast (USD Billion), by Sub-Segment 2, 2018-2030
Figure 27: North America Fiberglass Fabric Market Forecast (USD Billion), by Sub-Segment 3, 2018-2030
Figure 28: North America Fiberglass Fabric Market Forecast (USD Billion), by Others, 2018-2030
Figure 29: North America Fiberglass Fabric Market Forecast (USD Billion), by U.S., 2018-2030
Figure 30: North America Fiberglass Fabric Market Forecast (USD Billion), by Canada, 2018-2030
Figure 31: Latin America Fiberglass Fabric Market Value Share (%), By Segment 1, 2021 & 2030
Figure 32: Latin America Fiberglass Fabric Market Forecast (USD Billion), by Sub-Segment 1, 2018-2030
Figure 33: Latin America Fiberglass Fabric Market Forecast (USD Billion), by Sub-Segment 2, 2018-2030
Figure 34: Latin America Fiberglass Fabric Market Value Share (%), By Segment 2, 2021 & 2030
Figure 35: Latin America Fiberglass Fabric Market Forecast (USD Billion), by Sub-Segment 1, 2018-2030
Figure 36: Latin America Fiberglass Fabric Market Forecast (USD Billion), by Sub-Segment 2, 2018-2030
Figure 37: Latin America Fiberglass Fabric Market Forecast (USD Billion), by Sub-Segment 3, 2018-2030
Figure 38: Latin America Fiberglass Fabric Market Forecast (USD Billion), by Others, 2018-2030
Figure 39: Latin America Fiberglass Fabric Market Value Share (%), By Segment 3, 2021 & 2030
Figure 40: Latin America Fiberglass Fabric Market Forecast (USD Billion), by Sub-Segment 1, 2018-2030
Figure 41: Latin America Fiberglass Fabric Market Forecast (USD Billion), by Sub-Segment 2, 2018-2030
Figure 42: Latin America Fiberglass Fabric Market Forecast (USD Billion), by Sub-Segment 3, 2018-2030
Figure 43: Latin America Fiberglass Fabric Market Forecast (USD Billion), by Others, 2018-2030
Figure 44: Latin America Fiberglass Fabric Market Forecast (USD Billion), by Brazil, 2018-2030
Figure 45: Latin America Fiberglass Fabric Market Forecast (USD Billion), by Mexico, 2018-2030
Figure 46: Latin America Fiberglass Fabric Market Forecast (USD Billion), by Rest of Latin America, 2018-2030
Figure 47: Europe Fiberglass Fabric Market Value Share (%), By Segment 1, 2021 & 2030
Figure 48: Europe Fiberglass Fabric Market Forecast (USD Billion), by Sub-Segment 1, 2018-2030
Figure 49: Europe Fiberglass Fabric Market Forecast (USD Billion), by Sub-Segment 2, 2018-2030
Figure 50: Europe Fiberglass Fabric Market Value Share (%), By Segment 2, 2021 & 2030
Figure 51: Europe Fiberglass Fabric Market Forecast (USD Billion), by Sub-Segment 1, 2018-2030
Figure 52: Europe Fiberglass Fabric Market Forecast (USD Billion), by Sub-Segment 2, 2018-2030
Figure 53: Europe Fiberglass Fabric Market Forecast (USD Billion), by Sub-Segment 3, 2018-2030
Figure 54: Europe Fiberglass Fabric Market Forecast (USD Billion), by Others, 2018-2030
Figure 55: Europe Fiberglass Fabric Market Value Share (%), By Segment 3, 2021 & 2030
Figure 56: Europe Fiberglass Fabric Market Forecast (USD Billion), by Sub-Segment 1, 2018-2030
Figure 57: Europe Fiberglass Fabric Market Forecast (USD Billion), by Sub-Segment 2, 2018-2030
Figure 58: Europe Fiberglass Fabric Market Forecast (USD Billion), by Sub-Segment 3, 2018-2030
Figure 59: Europe Fiberglass Fabric Market Forecast (USD Billion), by Others, 2018-2030
Figure 60: Europe Fiberglass Fabric Market Forecast (USD Billion), by U.K., 2018-2030
Figure 61: Europe Fiberglass Fabric Market Forecast (USD Billion), by Germany, 2018-2030
Figure 62: Europe Fiberglass Fabric Market Forecast (USD Billion), by France, 2018-2030
Figure 63: Europe Fiberglass Fabric Market Forecast (USD Billion), by Italy, 2018-2030
Figure 64: Europe Fiberglass Fabric Market Forecast (USD Billion), by Spain, 2018-2030
Figure 65: Europe Fiberglass Fabric Market Forecast (USD Billion), by Russia, 2018-2030
Figure 66: Europe Fiberglass Fabric Market Forecast (USD Billion), by Rest of Europe, 2018-2030
Figure 67: Asia Pacific Fiberglass Fabric Market Value Share (%), By Segment 1, 2021 & 2030
Figure 68: Asia Pacific Fiberglass Fabric Market Forecast (USD Billion), by Sub-Segment 1, 2018-2030
Figure 69: Asia Pacific Fiberglass Fabric Market Forecast (USD Billion), by Sub-Segment 2, 2018-2030
Figure 70: Asia Pacific Fiberglass Fabric Market Value Share (%), By Segment 2, 2021 & 2030
Figure 71: Asia Pacific Fiberglass Fabric Market Forecast (USD Billion), by Sub-Segment 1, 2018-2030
Figure 72: Asia Pacific Fiberglass Fabric Market Forecast (USD Billion), by Sub-Segment 2, 2018-2030
Figure 73: Asia Pacific Fiberglass Fabric Market Forecast (USD Billion), by Sub-Segment 3, 2018-2030
Figure 74: Asia Pacific Fiberglass Fabric Market Forecast (USD Billion), by Others, 2018-2030
Figure 75: Asia Pacific Fiberglass Fabric Market Value Share (%), By Segment 3, 2021 & 2030
Figure 76: Asia Pacific Fiberglass Fabric Market Forecast (USD Billion), by Sub-Segment 1, 2018-2030
Figure 77: Asia Pacific Fiberglass Fabric Market Forecast (USD Billion), by Sub-Segment 2, 2018-2030
Figure 78: Asia Pacific Fiberglass Fabric Market Forecast (USD Billion), by Sub-Segment 3, 2018-2030
Figure 79: Asia Pacific Fiberglass Fabric Market Forecast (USD Billion), by Others, 2018-2030
Figure 80: Asia Pacific Fiberglass Fabric Market Forecast (USD Billion), by China, 2018-2030
Figure 81: Asia Pacific Fiberglass Fabric Market Forecast (USD Billion), by India, 2018-2030
Figure 82: Asia Pacific Fiberglass Fabric Market Forecast (USD Billion), by Japan, 2018-2030
Figure 83: Asia Pacific Fiberglass Fabric Market Forecast (USD Billion), by Australia, 2018-2030
Figure 84: Asia Pacific Fiberglass Fabric Market Forecast (USD Billion), by Southeast Asia, 2018-2030
Figure 85: Asia Pacific Fiberglass Fabric Market Forecast (USD Billion), by Rest of Asia Pacific, 2018-2030
Figure 86: Middle East & Africa Fiberglass Fabric Market Value Share (%), By Segment 1, 2021 & 2030
Figure 87: Middle East & Africa Fiberglass Fabric Market Forecast (USD Billion), by Sub-Segment 1, 2018-2030
Figure 88: Middle East & Africa Fiberglass Fabric Market Forecast (USD Billion), by Sub-Segment 2, 2018-2030
Figure 89: Middle East & Africa Fiberglass Fabric Market Value Share (%), By Segment 2, 2021 & 2030
Figure 90: Middle East & Africa Fiberglass Fabric Market Forecast (USD Billion), by Sub-Segment 1, 2018-2030
Figure 91: Middle East & Africa Fiberglass Fabric Market Forecast (USD Billion), by Sub-Segment 2, 2018-2030
Figure 92: Middle East & Africa Fiberglass Fabric Market Forecast (USD Billion), by Sub-Segment 3, 2018-2030
Figure 93: Middle East & Africa Fiberglass Fabric Market Forecast (USD Billion), by Others, 2018-2030
Figure 94: Middle East & Africa Fiberglass Fabric Market Value Share (%), By Segment 3, 2021 & 2030
Figure 95: Middle East & Africa Fiberglass Fabric Market Forecast (USD Billion), by Sub-Segment 1, 2018-2030
Figure 96: Middle East & Africa Fiberglass Fabric Market Forecast (USD Billion), by Sub-Segment 2, 2018-2030
Figure 97: Middle East & Africa Fiberglass Fabric Market Forecast (USD Billion), by Sub-Segment 3, 2018-2030
Figure 98: Middle East & Africa Fiberglass Fabric Market Forecast (USD Billion), by Others, 2018-2030
Figure 99: Middle East & Africa Fiberglass Fabric Market Forecast (USD Billion), by GCC, 2018-2030
Figure 100: Middle East & Africa Fiberglass Fabric Market Forecast (USD Billion), by South Africa, 2018-2030
Figure 101: Middle East & Africa Fiberglass Fabric Market Forecast (USD Billion), by Rest of Middle East & Africa, 2018-2030
List of Tables
Table 1: Global Fiberglass Fabric Market Revenue (USD Billion) Forecast, by Segment 1, 2018-2030
Table 2: Global Fiberglass Fabric Market Revenue (USD Billion) Forecast, by Segment 2, 2018-2030
Table 3: Global Fiberglass Fabric Market Revenue (USD Billion) Forecast, by Segment 3, 2018-2030
Table 4: Global Fiberglass Fabric Market Revenue (USD Billion) Forecast, by Region, 2018-2030
Table 5: North America Fiberglass Fabric Market Revenue (USD Billion) Forecast, by Segment 1, 2018-2030
Table 6: North America Fiberglass Fabric Market Revenue (USD Billion) Forecast, by Segment 2, 2018-2030
Table 7: North America Fiberglass Fabric Market Revenue (USD Billion) Forecast, by Segment 3, 2018-2030
Table 8: North America Fiberglass Fabric Market Revenue (USD Billion) Forecast, by Country, 2018-2030
Table 9: Europe Fiberglass Fabric Market Revenue (USD Billion) Forecast, by Segment 1, 2018-2030
Table 10: Europe Fiberglass Fabric Market Revenue (USD Billion) Forecast, by Segment 2, 2018-2030
Table 11: Europe Fiberglass Fabric Market Revenue (USD Billion) Forecast, by Segment 3, 2018-2030
Table 12: Europe Fiberglass Fabric Market Revenue (USD Billion) Forecast, by Country, 2018-2030
Table 13: Latin America Fiberglass Fabric Market Revenue (USD Billion) Forecast, by Segment 1, 2018-2030
Table 14: Latin America Fiberglass Fabric Market Revenue (USD Billion) Forecast, by Segment 2, 2018-2030
Table 15: Latin America Fiberglass Fabric Market Revenue (USD Billion) Forecast, by Segment 3, 2018-2030
Table 16: Latin America Fiberglass Fabric Market Revenue (USD Billion) Forecast, by Country, 2018-2030
Table 17: Asia Pacific Fiberglass Fabric Market Revenue (USD Billion) Forecast, by Segment 1, 2018-2030
Table 18: Asia Pacific Fiberglass Fabric Market Revenue (USD Billion) Forecast, by Segment 2, 2018-2030
Table 19: Asia Pacific Fiberglass Fabric Market Revenue (USD Billion) Forecast, by Segment 3, 2018-2030
Table 20: Asia Pacific Fiberglass Fabric Market Revenue (USD Billion) Forecast, by Country, 2018-2030
Table 21: Middle East & Africa Fiberglass Fabric Market Revenue (USD Billion) Forecast, by Segment 1, 2018-2030
Table 22: Middle East & Africa Fiberglass Fabric Market Revenue (USD Billion) Forecast, by Segment 2, 2018-2030
Table 23: Middle East & Africa Fiberglass Fabric Market Revenue (USD Billion) Forecast, by Segment 3, 2018-2030
Table 24: Middle East & Africa Fiberglass Fabric Market Revenue (USD Billion) Forecast, by Country, 2018-2030
Research Process
Data Library Research are conducted by industry experts who offer insight on
industry structure, market segmentations technology assessment and competitive landscape (CL), and penetration, as well as on emerging trends. Their analysis is based on primary interviews (~ 80%) and secondary research (~ 20%) as well as years of professional expertise in their respective industries. Adding to this, by analysing historical trends and current market positions, our analysts predict where the market will be headed for the next five years. Furthermore, the varying trends of segment & categories geographically presented are also studied and the estimated based on the primary & secondary research.
In this particular report from the supply side Data Library Research has conducted primary surveys (interviews) with the key level executives (VP, CEO’s, Marketing Director, Business Development Manager
and SOFT) of the companies that active & prominent as well as the midsized organization
FIGURE 1: DLR RESEARH PROCESS
![research-methodology1]()
Primary Research
Extensive primary research was conducted to gain a deeper insight of the market and industry performance. The analysis is based on both primary and secondary research as well as years of professional expertise in the respective industries.
In addition to analysing current and historical trends, our analysts predict where the market is headed over the next five years.
It varies by segment for these categories geographically presented in the list of market tables. Speaking about this particular report we have conducted primary surveys (interviews) with the key level executives (VP, CEO’s, Marketing Director, Business Development Manager and many more) of the major players active in the market.
Secondary Research
Secondary research was mainly used to collect and identify information useful for the extensive, technical, market-oriented, and Friend’s study of the Global Extra Neutral Alcohol. It was also used to obtain key information about major players, market classification and segmentation according to the industry trends, geographical markets, and developments related to the market and technology perspectives. For this study, analysts have gathered information from various credible sources, such as annual reports, sec filings, journals, white papers, SOFT presentations, and company web sites.
Market Size Estimation
Both, top-down and bottom-up approaches were used to estimate and validate the size of the Global market and to estimate the size of various other dependent submarkets in the overall Extra Neutral Alcohol. The key players in the market were identified through secondary research and their market contributions in the respective geographies were determined through primary and secondary research.
Forecast Model
![research-methodology2]()