Hair Loss Treatment Products Market Overview
Baldness is a term that refers to a person's scalp losing a lot of hair. The most prevalent cause of baldness is hereditary hair loss as people become older. Some people would rather let their hair loss go unnoticed and untreated. Hair loss can be caused by a variety of factors, and it can also be treated in a variety of ways. Hair loss treatment treatments stop hair loss in its tracks and encourage hair growth.
The major factors driving the hair loss treatment market are changing lifestyle patterns, increasing stress levels due to the adoption of hectic schedules, which results in frequent hair loss at an earlier age among the young population, increasing disposable income, and increasing emphasis on appearance. Hair loss is caused by a variety of factors including heredity, excessive stress or shock to the body, toxic substances such as chemotherapy, radiation therapy, and some drugs, as well as medical disorders.
The global hair loss treatment products market is being boosted by rising demand for hair loss treatment products, an increase in patient population, an increase in research and development activities in health care, an increase in the geriatric population, and an increase in the adoption of hair care products.
The availability of many alternative hair loss treatment alternatives, such as laser hair therapy, hair transplant surgery, and light-based therapies, is expected to constrain the global hair loss treatment products market over the forecast period.
| Report Metric |
Details |
| Market size available for years |
2023–2030 |
| Base year considered |
2023 |
| Forecast period |
2024–2030 |
| Forecast unit |
Value (USD Million) |
| Segments covered |
Product Type, Disease Type, Distribution Channel, and Region. |
| Regions covered |
North America (the U.S. and Canada), Europe (UK, Germany, France, Italy, Spain, Russia, Rest of Europe), Asia-Pacific (China, India, Japan, Australia, South East Asia, Rest of Asia Pacific), Latin America and the Middle East and Africa (Brazil, Saudi Arabia, UAE, Rest of LAMEA) |
| Companies covered |
Sun Pharmaceutical Industries Ltd., Aclaris Therapeutics, Inc., Concert Pharmaceuticals, Daiichi Sankyo Company, Limited, GlaxoSmithKline plc., HCell Inc., Histogen Inc., Merck & Co., Inc., Johnson & Johnson Services, Inc. |
Covid-19 Impact on Hair Loss Treatment Products Market
In addition, the current Hair Loss Treatment Products Market study offers a detailed analysis of the current COVID-19 pandemic impact on the market growth and its influence on the future growth of the Hair Loss Treatment Products Market. The recently published report demonstrates the elevation in the demand for the healthcare sector. The healthcare manufacturers have experienced long term as well as short term effect which includes supply shortages, panic buying, and stocking, regulation changes as short-term whereas approval delays and possible trend variations in consumption could be perceived as long-term impacts of COVID-19 on the health and pharmaceutical market.
The increasing need for a cure has pushed vaccine research and manufacturers to the limit. In addition to this, panic conditions have already spurred the demand for many healthcare products and services which are discussed in detail in this report. Moreover, the impact of COVID-19 on overall market revenue for the base year 2020 and its projection up to 2027 is provided in detail in this report.
Hair Loss Treatment Products Market Segment Overview
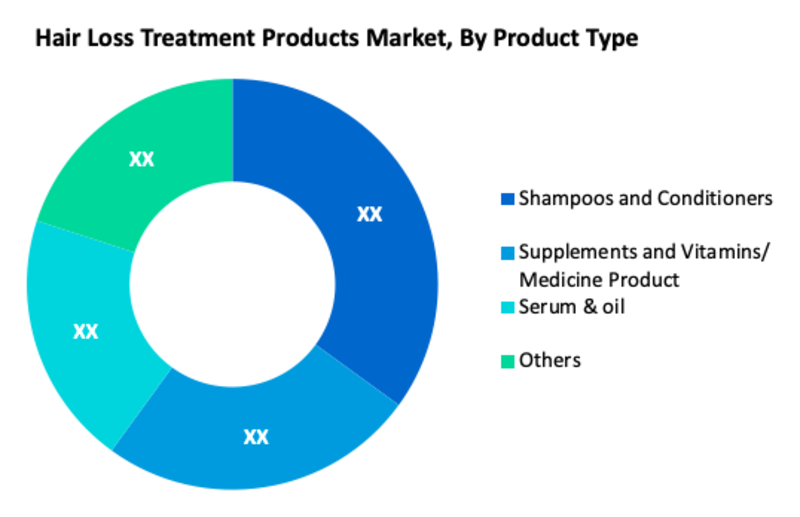
According to Product Type, Shampoos and Conditioners is the most prominent segment in the global Hair Loss Treatment Products Market. Supplements and Vitamins/ Medicine Product and Serum & oil, these are another main segment in the global market. Based on Disease Type, Alopecia Areata is one of the major segments in the global Hair Loss Treatment Products Market. Alopecia areata is a condition in which the immune system attacks hair follicles, which can be triggered by extreme stress. Hair loss is the most common symptom. Treatment may include topical scalp treatment to address any underlying conditions.
Hair Loss Treatment Products Market, By Product Type
· Shampoos and Conditioners
· Supplements and Vitamins/ Medicine Product
· Serum & oil
· Others
Hair Loss Treatment Products Market, By Disease Type
· Alopecia Areata
· Cicatricial Alopecia
· Traction Alopecia
· Others
Hair Loss Treatment Products Market, By Distribution Channel
· Hypermarkets and Supermarkets
· Medical/Pharmacy Stores
· E-commerce
· Others
Hair Loss Treatment Products Regional Overview
In terms of geography, the global Hair Loss Treatment Products Market is classified into North America, South America, Europe, Asia Pacific and Middle East & Africa. North America is expected to account for a leading share of the global hair loss treatment products market during the forecast period. This is due to an increase in patient population, increasing changes in lifestyle, increased hair loss, increasing ageing population, increased research & development activities, availability of well-established health care infrastructure, continuous technological advancements, rise in the number of well-equipped laboratories, and presence of key players.
Furthermore, due to the rising prevalence of hair loss, growing geriatric population, rising patient population, increasing awareness, expanding health care sector, and rising interest of key players in expanding their presence in the market in the Asia Pacific, the hair loss treatment products market is expected to grow at a rapid pace during the forecast period.
Hair Loss Treatment Products Market, By Geography
· North America (US & Canada)
· Europe (UK, Germany, France, Italy, Spain, Russia & Rest of Europe)
· Asia-Pacific (Japan, China, India, Australia, & South Korea, & Rest of Asia-Pacific)
· LAMEA (Brazil, Saudi Arabia, UAE & Rest of LAMEA)
Hair Loss Treatment Products Market Competitor overview
Some key developments and strategies adopted by manufacturers in Hair Loss Treatment Products are highlighted below.
· In November 2023, Exicure, Inc., a pioneer in gene regulatory and immunotherapeutic drugs utilizing spherical nucleic acid (SNA™) technology, announced that Allergan’s wholly-owned subsidiary, Allergan Pharmaceuticals International Limited, and Exicure, Inc. have entered into a global collaboration agreement to discover and develop novel treatments for hair loss disorders based on Exicure’s proprietary SNA technology.
Hair Loss Treatment Products Market, Key Players
· Sun Pharmaceutical Industries Ltd.
· Aclaris Therapeutics, Inc.
· Concert Pharmaceuticals
· Daiichi Sankyo Company, Limited
· GlaxoSmithKline plc.
· HCell Inc.
· Histogen Inc.
· Merck & Co., Inc.
· Johnson & Johnson Services, Inc.
Frequently Asked Questions (FAQ) :
Q1. What are the driving factors for the global Hair Loss Treatment Products market?
The global hair loss treatment products market is being boosted by rising demand for hair loss treatment products, an increase in patient population, an increase in research and development activities in health care etc
Q2. Which Segments are covered in the global Hair Loss Treatment Products market report?
Product Type, Disease Type, Distribution Channel, and Region. these segments are covered in the global Hair Loss Treatment Products market report
Q3. Which segment is projected to hold the largest share in the global Hair Loss Treatment Products market?
Shampoos and Conditioners segment is projected to hold the largest share in the global Hair Loss Treatment Products market
Q4. Which region holds the largest share in the global Hair Loss Treatment Products market?
North America holds the largest share in the global Hair Loss Treatment Products market
Q5. Which are the prominent players in the global Hair Loss Treatment Products market?
Sun Pharmaceutical Industries Ltd., Aclaris Therapeutics, Inc., Concert Pharmaceuticals, Daiichi Sankyo Company, Limited, GlaxoSmithKline plc., HCell Inc., Histogen Inc., Merck & Co., Inc., Johnson & Johnson Services, Inc. are some key players in the global Hair Loss Treatment Products market.
List of Figures
Figure 1: Global Hair Loss & Growth Treatments and Products Market Revenue Breakdown (USD Billion, %) by Region, 2019 & 2027
Figure 2: Global Hair Loss & Growth Treatments and Products Market Value Share (%), By Segment 1, 2019 & 2027
Figure 3: Global Hair Loss & Growth Treatments and Products Market Forecast (USD Billion), by Sub-Segment 1, 2016-2027
Figure 4: Global Hair Loss & Growth Treatments and Products Market Forecast (USD Billion), by Sub-Segment 2, 2016-2027
Figure 5: Global Hair Loss & Growth Treatments and Products Market Value Share (%), By Segment 2, 2019 & 2027
Figure 6: Global Hair Loss & Growth Treatments and Products Market Forecast (USD Billion), by Sub-Segment 1, 2016-2027
Figure 7: Global Hair Loss & Growth Treatments and Products Market Forecast (USD Billion), by Sub-Segment 2, 2016-2027
Figure 8: Global Hair Loss & Growth Treatments and Products Market Forecast (USD Billion), by Sub-Segment 3, 2016-2027
Figure 9: Global Hair Loss & Growth Treatments and Products Market Forecast (USD Billion), by Others, 2016-2027
Figure 10: Global Hair Loss & Growth Treatments and Products Market Value Share (%), By Segment 3, 2019 & 2027
Figure 11: Global Hair Loss & Growth Treatments and Products Market Forecast (USD Billion), by Sub-Segment 1, 2016-2027
Figure 12: Global Hair Loss & Growth Treatments and Products Market Forecast (USD Billion), by Sub-Segment 2, 2016-2027
Figure 13: Global Hair Loss & Growth Treatments and Products Market Forecast (USD Billion), by Sub-Segment 3, 2016-2027
Figure 14: Global Hair Loss & Growth Treatments and Products Market Forecast (USD Billion), by Others, 2016-2027
Figure 15: Global Hair Loss & Growth Treatments and Products Market Value (USD Billion), by Region, 2019 & 2027
Figure 16: North America Hair Loss & Growth Treatments and Products Market Value Share (%), By Segment 1, 2019 & 2027
Figure 17: North America Hair Loss & Growth Treatments and Products Market Forecast (USD Billion), by Sub-Segment 1, 2016-2027
Figure 18: North America Hair Loss & Growth Treatments and Products Market Forecast (USD Billion), by Sub-Segment 2, 2016-2027
Figure 19: North America Hair Loss & Growth Treatments and Products Market Value Share (%), By Segment 2, 2019 & 2027
Figure 20: North America Hair Loss & Growth Treatments and Products Market Forecast (USD Billion), by Sub-Segment 1, 2016-2027
Figure 21: North America Hair Loss & Growth Treatments and Products Market Forecast (USD Billion), by Sub-Segment 2, 2016-2027
Figure 22: North America Hair Loss & Growth Treatments and Products Market Forecast (USD Billion), by Sub-Segment 3, 2016-2027
Figure 23: North America Hair Loss & Growth Treatments and Products Market Forecast (USD Billion), by Others, 2016-2027
Figure 24: North America Hair Loss & Growth Treatments and Products Market Value Share (%), By Segment 3, 2019 & 2027
Figure 25: North America Hair Loss & Growth Treatments and Products Market Forecast (USD Billion), by Sub-Segment 1, 2016-2027
Figure 26: North America Hair Loss & Growth Treatments and Products Market Forecast (USD Billion), by Sub-Segment 2, 2016-2027
Figure 27: North America Hair Loss & Growth Treatments and Products Market Forecast (USD Billion), by Sub-Segment 3, 2016-2027
Figure 28: North America Hair Loss & Growth Treatments and Products Market Forecast (USD Billion), by Others, 2016-2027
Figure 29: North America Hair Loss & Growth Treatments and Products Market Forecast (USD Billion), by U.S., 2016-2027
Figure 30: North America Hair Loss & Growth Treatments and Products Market Forecast (USD Billion), by Canada, 2016-2027
Figure 31: Latin America Hair Loss & Growth Treatments and Products Market Value Share (%), By Segment 1, 2019 & 2027
Figure 32: Latin America Hair Loss & Growth Treatments and Products Market Forecast (USD Billion), by Sub-Segment 1, 2016-2027
Figure 33: Latin America Hair Loss & Growth Treatments and Products Market Forecast (USD Billion), by Sub-Segment 2, 2016-2027
Figure 34: Latin America Hair Loss & Growth Treatments and Products Market Value Share (%), By Segment 2, 2019 & 2027
Figure 35: Latin America Hair Loss & Growth Treatments and Products Market Forecast (USD Billion), by Sub-Segment 1, 2016-2027
Figure 36: Latin America Hair Loss & Growth Treatments and Products Market Forecast (USD Billion), by Sub-Segment 2, 2016-2027
Figure 37: Latin America Hair Loss & Growth Treatments and Products Market Forecast (USD Billion), by Sub-Segment 3, 2016-2027
Figure 38: Latin America Hair Loss & Growth Treatments and Products Market Forecast (USD Billion), by Others, 2016-2027
Figure 39: Latin America Hair Loss & Growth Treatments and Products Market Value Share (%), By Segment 3, 2019 & 2027
Figure 40: Latin America Hair Loss & Growth Treatments and Products Market Forecast (USD Billion), by Sub-Segment 1, 2016-2027
Figure 41: Latin America Hair Loss & Growth Treatments and Products Market Forecast (USD Billion), by Sub-Segment 2, 2016-2027
Figure 42: Latin America Hair Loss & Growth Treatments and Products Market Forecast (USD Billion), by Sub-Segment 3, 2016-2027
Figure 43: Latin America Hair Loss & Growth Treatments and Products Market Forecast (USD Billion), by Others, 2016-2027
Figure 44: Latin America Hair Loss & Growth Treatments and Products Market Forecast (USD Billion), by Brazil, 2016-2027
Figure 45: Latin America Hair Loss & Growth Treatments and Products Market Forecast (USD Billion), by Mexico, 2016-2027
Figure 46: Latin America Hair Loss & Growth Treatments and Products Market Forecast (USD Billion), by Rest of Latin America, 2016-2027
Figure 47: Europe Hair Loss & Growth Treatments and Products Market Value Share (%), By Segment 1, 2019 & 2027
Figure 48: Europe Hair Loss & Growth Treatments and Products Market Forecast (USD Billion), by Sub-Segment 1, 2016-2027
Figure 49: Europe Hair Loss & Growth Treatments and Products Market Forecast (USD Billion), by Sub-Segment 2, 2016-2027
Figure 50: Europe Hair Loss & Growth Treatments and Products Market Value Share (%), By Segment 2, 2019 & 2027
Figure 51: Europe Hair Loss & Growth Treatments and Products Market Forecast (USD Billion), by Sub-Segment 1, 2016-2027
Figure 52: Europe Hair Loss & Growth Treatments and Products Market Forecast (USD Billion), by Sub-Segment 2, 2016-2027
Figure 53: Europe Hair Loss & Growth Treatments and Products Market Forecast (USD Billion), by Sub-Segment 3, 2016-2027
Figure 54: Europe Hair Loss & Growth Treatments and Products Market Forecast (USD Billion), by Others, 2016-2027
Figure 55: Europe Hair Loss & Growth Treatments and Products Market Value Share (%), By Segment 3, 2019 & 2027
Figure 56: Europe Hair Loss & Growth Treatments and Products Market Forecast (USD Billion), by Sub-Segment 1, 2016-2027
Figure 57: Europe Hair Loss & Growth Treatments and Products Market Forecast (USD Billion), by Sub-Segment 2, 2016-2027
Figure 58: Europe Hair Loss & Growth Treatments and Products Market Forecast (USD Billion), by Sub-Segment 3, 2016-2027
Figure 59: Europe Hair Loss & Growth Treatments and Products Market Forecast (USD Billion), by Others, 2016-2027
Figure 60: Europe Hair Loss & Growth Treatments and Products Market Forecast (USD Billion), by U.K., 2016-2027
Figure 61: Europe Hair Loss & Growth Treatments and Products Market Forecast (USD Billion), by Germany, 2016-2027
Figure 62: Europe Hair Loss & Growth Treatments and Products Market Forecast (USD Billion), by France, 2016-2027
Figure 63: Europe Hair Loss & Growth Treatments and Products Market Forecast (USD Billion), by Italy, 2016-2027
Figure 64: Europe Hair Loss & Growth Treatments and Products Market Forecast (USD Billion), by Spain, 2016-2027
Figure 65: Europe Hair Loss & Growth Treatments and Products Market Forecast (USD Billion), by Russia, 2016-2027
Figure 66: Europe Hair Loss & Growth Treatments and Products Market Forecast (USD Billion), by Rest of Europe, 2016-2027
Figure 67: Asia Pacific Hair Loss & Growth Treatments and Products Market Value Share (%), By Segment 1, 2019 & 2027
Figure 68: Asia Pacific Hair Loss & Growth Treatments and Products Market Forecast (USD Billion), by Sub-Segment 1, 2016-2027
Figure 69: Asia Pacific Hair Loss & Growth Treatments and Products Market Forecast (USD Billion), by Sub-Segment 2, 2016-2027
Figure 70: Asia Pacific Hair Loss & Growth Treatments and Products Market Value Share (%), By Segment 2, 2019 & 2027
Figure 71: Asia Pacific Hair Loss & Growth Treatments and Products Market Forecast (USD Billion), by Sub-Segment 1, 2016-2027
Figure 72: Asia Pacific Hair Loss & Growth Treatments and Products Market Forecast (USD Billion), by Sub-Segment 2, 2016-2027
Figure 73: Asia Pacific Hair Loss & Growth Treatments and Products Market Forecast (USD Billion), by Sub-Segment 3, 2016-2027
Figure 74: Asia Pacific Hair Loss & Growth Treatments and Products Market Forecast (USD Billion), by Others, 2016-2027
Figure 75: Asia Pacific Hair Loss & Growth Treatments and Products Market Value Share (%), By Segment 3, 2019 & 2027
Figure 76: Asia Pacific Hair Loss & Growth Treatments and Products Market Forecast (USD Billion), by Sub-Segment 1, 2016-2027
Figure 77: Asia Pacific Hair Loss & Growth Treatments and Products Market Forecast (USD Billion), by Sub-Segment 2, 2016-2027
Figure 78: Asia Pacific Hair Loss & Growth Treatments and Products Market Forecast (USD Billion), by Sub-Segment 3, 2016-2027
Figure 79: Asia Pacific Hair Loss & Growth Treatments and Products Market Forecast (USD Billion), by Others, 2016-2027
Figure 80: Asia Pacific Hair Loss & Growth Treatments and Products Market Forecast (USD Billion), by China, 2016-2027
Figure 81: Asia Pacific Hair Loss & Growth Treatments and Products Market Forecast (USD Billion), by India, 2016-2027
Figure 82: Asia Pacific Hair Loss & Growth Treatments and Products Market Forecast (USD Billion), by Japan, 2016-2027
Figure 83: Asia Pacific Hair Loss & Growth Treatments and Products Market Forecast (USD Billion), by Australia, 2016-2027
Figure 84: Asia Pacific Hair Loss & Growth Treatments and Products Market Forecast (USD Billion), by Southeast Asia, 2016-2027
Figure 85: Asia Pacific Hair Loss & Growth Treatments and Products Market Forecast (USD Billion), by Rest of Asia Pacific, 2016-2027
Figure 86: Middle East & Africa Hair Loss & Growth Treatments and Products Market Value Share (%), By Segment 1, 2019 & 2027
Figure 87: Middle East & Africa Hair Loss & Growth Treatments and Products Market Forecast (USD Billion), by Sub-Segment 1, 2016-2027
Figure 88: Middle East & Africa Hair Loss & Growth Treatments and Products Market Forecast (USD Billion), by Sub-Segment 2, 2016-2027
Figure 89: Middle East & Africa Hair Loss & Growth Treatments and Products Market Value Share (%), By Segment 2, 2019 & 2027
Figure 90: Middle East & Africa Hair Loss & Growth Treatments and Products Market Forecast (USD Billion), by Sub-Segment 1, 2016-2027
Figure 91: Middle East & Africa Hair Loss & Growth Treatments and Products Market Forecast (USD Billion), by Sub-Segment 2, 2016-2027
Figure 92: Middle East & Africa Hair Loss & Growth Treatments and Products Market Forecast (USD Billion), by Sub-Segment 3, 2016-2027
Figure 93: Middle East & Africa Hair Loss & Growth Treatments and Products Market Forecast (USD Billion), by Others, 2016-2027
Figure 94: Middle East & Africa Hair Loss & Growth Treatments and Products Market Value Share (%), By Segment 3, 2019 & 2027
Figure 95: Middle East & Africa Hair Loss & Growth Treatments and Products Market Forecast (USD Billion), by Sub-Segment 1, 2016-2027
Figure 96: Middle East & Africa Hair Loss & Growth Treatments and Products Market Forecast (USD Billion), by Sub-Segment 2, 2016-2027
Figure 97: Middle East & Africa Hair Loss & Growth Treatments and Products Market Forecast (USD Billion), by Sub-Segment 3, 2016-2027
Figure 98: Middle East & Africa Hair Loss & Growth Treatments and Products Market Forecast (USD Billion), by Others, 2016-2027
Figure 99: Middle East & Africa Hair Loss & Growth Treatments and Products Market Forecast (USD Billion), by GCC, 2016-2027
Figure 100: Middle East & Africa Hair Loss & Growth Treatments and Products Market Forecast (USD Billion), by South Africa, 2016-2027
Figure 101: Middle East & Africa Hair Loss & Growth Treatments and Products Market Forecast (USD Billion), by Rest of Middle East & Africa, 2016-2027
List of Tables
Table 1: Global Hair Loss & Growth Treatments and Products Market Revenue (USD Billion) Forecast, by Segment 1, 2016-2027
Table 2: Global Hair Loss & Growth Treatments and Products Market Revenue (USD Billion) Forecast, by Segment 2, 2016-2027
Table 3: Global Hair Loss & Growth Treatments and Products Market Revenue (USD Billion) Forecast, by Segment 3, 2016-2027
Table 4: Global Hair Loss & Growth Treatments and Products Market Revenue (USD Billion) Forecast, by Region, 2016-2027
Table 5: North America Hair Loss & Growth Treatments and Products Market Revenue (USD Billion) Forecast, by Segment 1, 2016-2027
Table 6: North America Hair Loss & Growth Treatments and Products Market Revenue (USD Billion) Forecast, by Segment 2, 2016-2027
Table 7: North America Hair Loss & Growth Treatments and Products Market Revenue (USD Billion) Forecast, by Segment 3, 2016-2027
Table 8: North America Hair Loss & Growth Treatments and Products Market Revenue (USD Billion) Forecast, by Country, 2016-2027
Table 9: Europe Hair Loss & Growth Treatments and Products Market Revenue (USD Billion) Forecast, by Segment 1, 2016-2027
Table 10: Europe Hair Loss & Growth Treatments and Products Market Revenue (USD Billion) Forecast, by Segment 2, 2016-2027
Table 11: Europe Hair Loss & Growth Treatments and Products Market Revenue (USD Billion) Forecast, by Segment 3, 2016-2027
Table 12: Europe Hair Loss & Growth Treatments and Products Market Revenue (USD Billion) Forecast, by Country, 2016-2027
Table 13: Latin America Hair Loss & Growth Treatments and Products Market Revenue (USD Billion) Forecast, by Segment 1, 2016-2027
Table 14: Latin America Hair Loss & Growth Treatments and Products Market Revenue (USD Billion) Forecast, by Segment 2, 2016-2027
Table 15: Latin America Hair Loss & Growth Treatments and Products Market Revenue (USD Billion) Forecast, by Segment 3, 2016-2027
Table 16: Latin America Hair Loss & Growth Treatments and Products Market Revenue (USD Billion) Forecast, by Country, 2016-2027
Table 17: Asia Pacific Hair Loss & Growth Treatments and Products Market Revenue (USD Billion) Forecast, by Segment 1, 2016-2027
Table 18: Asia Pacific Hair Loss & Growth Treatments and Products Market Revenue (USD Billion) Forecast, by Segment 2, 2016-2027
Table 19: Asia Pacific Hair Loss & Growth Treatments and Products Market Revenue (USD Billion) Forecast, by Segment 3, 2016-2027
Table 20: Asia Pacific Hair Loss & Growth Treatments and Products Market Revenue (USD Billion) Forecast, by Country, 2016-2027
Table 21: Middle East & Africa Hair Loss & Growth Treatments and Products Market Revenue (USD Billion) Forecast, by Segment 1, 2016-2027
Table 22: Middle East & Africa Hair Loss & Growth Treatments and Products Market Revenue (USD Billion) Forecast, by Segment 2, 2016-2027
Table 23: Middle East & Africa Hair Loss & Growth Treatments and Products Market Revenue (USD Billion) Forecast, by Segment 3, 2016-2027
Table 24: Middle East & Africa Hair Loss & Growth Treatments and Products Market Revenue (USD Billion) Forecast, by Country, 2016-2027
Research Process
Data Library Research are conducted by industry experts who offer insight on
industry structure, market segmentations technology assessment and competitive landscape (CL), and penetration, as well as on emerging trends. Their analysis is based on primary interviews (~ 80%) and secondary research (~ 20%) as well as years of professional expertise in their respective industries. Adding to this, by analysing historical trends and current market positions, our analysts predict where the market will be headed for the next five years. Furthermore, the varying trends of segment & categories geographically presented are also studied and the estimated based on the primary & secondary research.
In this particular report from the supply side Data Library Research has conducted primary surveys (interviews) with the key level executives (VP, CEO’s, Marketing Director, Business Development Manager
and SOFT) of the companies that active & prominent as well as the midsized organization
FIGURE 1: DLR RESEARH PROCESS
![research-methodology1]()
Primary Research
Extensive primary research was conducted to gain a deeper insight of the market and industry performance. The analysis is based on both primary and secondary research as well as years of professional expertise in the respective industries.
In addition to analysing current and historical trends, our analysts predict where the market is headed over the next five years.
It varies by segment for these categories geographically presented in the list of market tables. Speaking about this particular report we have conducted primary surveys (interviews) with the key level executives (VP, CEO’s, Marketing Director, Business Development Manager and many more) of the major players active in the market.
Secondary Research
Secondary research was mainly used to collect and identify information useful for the extensive, technical, market-oriented, and Friend’s study of the Global Extra Neutral Alcohol. It was also used to obtain key information about major players, market classification and segmentation according to the industry trends, geographical markets, and developments related to the market and technology perspectives. For this study, analysts have gathered information from various credible sources, such as annual reports, sec filings, journals, white papers, SOFT presentations, and company web sites.
Market Size Estimation
Both, top-down and bottom-up approaches were used to estimate and validate the size of the Global market and to estimate the size of various other dependent submarkets in the overall Extra Neutral Alcohol. The key players in the market were identified through secondary research and their market contributions in the respective geographies were determined through primary and secondary research.
Forecast Model
![research-methodology2]()